Using the Workspace
This chapter discusses the structures and features of Tecplot 360 that act the same regardless of the data type or plot layers you are using. These include:
- Data Hierarchy
-
How Tecplot 360 manages data.
- Interface Coordinate Systems
-
Tecplot 360’s use of different coordinate systems, and when and where they occur.
- Frames
-
Areas in the workspace in which you can create plots and control formatting.
- Workspace Management Options
-
Factors that determine the color and orientation of your paper, as well as the ruler and grid, in order to precisely size and position objects. For in-depth information on Display Performance, refer to Performance Dialog.
- View Modification
-
The commands to zoom, translate, and fit plots within frames.
- Edit Menu
-
The commands to cut, copy, and paste plot elements in the workspace.
Data Hierarchy
Tecplot 360 structures data in two levels: datasets, which display in frames, and zones, which make up a dataset. Each dataset is composed of one or more zones, and each zone contains one or more variables. All zones within a dataset contain the same set of variables.
Data Displays in Frames
Tecplot 360 always displays data in a window called a "frame". By default, Tecplot 360 opens one frame when you launch Tecplot 360 or open a new layout, but you can display multiple plots concurrently in Tecplot 360 by adding additional frames. You can add frames to the workspace using the menu. You can display one dataset in one frame, or you can share one dataset between multiple frames. Using the same dataset in multiple frames allows you to generate different plots of the same data. To learn more about working with frames, see Frames.
Frames appear on pages. You can manage multiple pages in Tecplot 360 using the Pages Sidebar and macro commands in the default Quick Macro Panel. Each page has its own collection of frames.
A Dataset Includes All Data in a Frame
A dataset is defined as "all of the data in a frame". To create a dataset, load one or more data files into an empty frame in Tecplot 360, or create a zone in a frame.
Datasets Are Made of Zones
A zone represents a subset of a dataset. A dataset can be composed of a single zone or several zones. Zones are either defined in a data file or created directly in Tecplot 360. The number of zones in a dataset is the sum of the number of zones in each of the data files included in the dataset, plus any zones created within Tecplot 360.
Typically, a data file is divided into zones based on its physical coordinates. For example, a dataset of an airplane may consist of a zone for each wing, each wheel, the nose, etc. Alternatively, zones may be defined based on the material. For example, a dataset of a fluid tank may have a zone for the tank itself and additional zones for each fluid inside the tank.
| All zones in a given dataset must have the same variables defined for each data point. |
Interface Coordinate Systems
Tecplot 360 incorporates a number of coordinate systems, including the paper, frame, and the physical coordinate systems for the plot (2D, 3D, XY, or Polar). The origins of each coordinate system and their relationship to one another is shown in Figure 2.
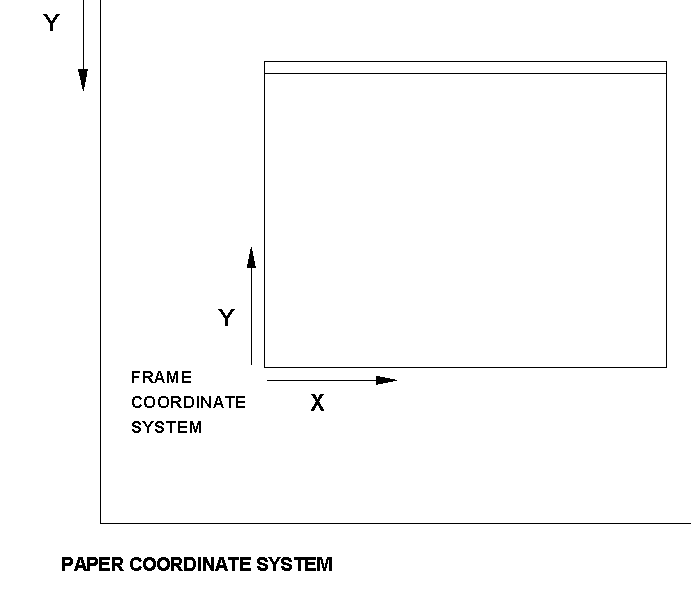
The physical coordinate system (2D or 3D) depends on the plot type of the active frame. Two-dimensional physical coordinates are often referred to as grid coordinates. The Grid coordinate system is aligned with the coordinate system used by the plot axes; the Frame coordinate system is fixed to the frame and does not change when the plot is zoomed, translated, or rotated.
In 2D Cartesian plots, objects such as text labels and geometries are drawn in either the Frame or the Grid coordinate system. In 3D Cartesian plots, these objects are drawn in either the Frame coordinate system, or in what is known as the Eye coordinate system. The eye coordinate system is aligned with the Grid coordinate system; so objects drawn in the Eye coordinate system move with the data as you zoom and translate, but remain fixed when you rotate the plot.
Frames
All plots and sketches are displayed within frames. Initially, the Tecplot 360 workspace contains one frame. You may add additional frames, resize and reposition frames, modify background color, and specify border and header appearance. Tecplot 360 acts upon only one frame, The Active Frame, at any given time (however, frames may be linked, so that changing one may also change others). The active frame displays with a darker, thicker border than the inactive frames so that you can easily see which frame is active.
| Tecplot 360 uses the height of the frame for objects scaled by frame units, such as font size. When you enter a frame unit value into a dialog or when you set frame size and position on the paper, you may specify a different unit system (inches, points, centimeters, or pixels). Tecplot 360 automatically converts the values into frame units. |
The Active Frame
The active frame, indicated by default with a darker and thicker border, is the frame in your workspace affected by all operations you do in Tecplot 360. To make a frame the active frame, click anywhere inside that frame with the Selector tool (or any other tool except the tool). Reference the following sections for additional actions you can perform on frames.
Frame Creation
To create a new frame, which you can use to display a new dataset or another view of an
already-loaded data set, select the New Frame
 button in the toolbar. Or select from the menu. Selecting either the or in the menu will change your selector tool into a small
+ symbol. Click with this tool in your workspace where you want one corner
of your new frame, and drag across the workspace to where you would like the opposite
corner of your new frame.
|
Tecplot 360 automatically makes the new frame the active frame. For optimal printing of your plot(s), draw frames that sit completely within the paper displayed in the workspace. See Create Multiple Frames for information on simultaneously creating multiple frames. |
|
Data Set Inheritance After creating a new frame, you can assign the frame to share the dataset of another frame by changing the frame order and the plot type of the new frame. When you switch a frame without data out of Sketch plot type, Tecplot 360 searches for another frame with which to share data. It performs this search in the order that the frames are drawn on-screen, starting from the top and moving down. The empty frame will inherit data from the first frame in the draw order that contains data. |
Edit Active Frame
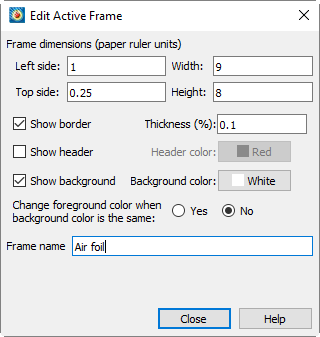
The dialog (accessed from the menu) allows you to adjust the dimensions and style of your active frame. When you are working with multiple frames, select a frame with your selector tool to make that frame active. Then select from the menu to adjust the position and properties of that frame.
Frame Dimensions
You can size and position a frame using your mouse, the keyboard, or a dialog. To use only your mouse, select the frame to activate the resizing handles (black boxes on the edges and corners of the frame). Click and drag on a handle to resize a frame, or click and drag on an edge in a location without a handle to change the frame location. To specify size or position with a dialog, select from the menu.
In the dialog, you may specify the exact location for the frame’s left and top sides, along with width and height.

- Left Side
-
Left edge of the frame, relative to the workspace.
- Top Side
-
Top edge of the frame, relative to the workspace.
- Width
-
Width of the frame (coordinates are: left side to left side + width).
- Height
-
Height of the frame (coordinates are: top side to top side - height).
The units in the Frame Dimensions region of the dialog are based on the units set for the in .
| You may also use the mouse or the arrow keys to resize and position frames. Click anywhere on a frame’s header or border to activate resizing handles for the frame. To scale frames proportionally (maintaining the vertical to horizontal aspect ratio) select the frames, then press + on your keyboard to enlarge or - to reduce. |
After selecting frames, you may position them using the arrow keys on your keyboard. You can move frames up, down, left, or right in one-pixel increments for precise location.
| To fit the active frame to the entire printable region of US letter-size paper (landscape orientation), set Left Side=0.127, Top Side=0.125, Width=10.75, and Height=8.25. Or, set Width=8.25 and Height=10.75 for portrait orientation. |
Frame Border and Header Controls
Use the dialog (accessed from the menu) to adjust the frame border or header.

Toggling-off makes the frame border invisible. Use the Thickness box in the dialog to adjust the line thickness of the border.
Remember that Tecplot 360 uses a thicker border to indicate The Active Frame, so making borders thicker can make it become more difficult to determine which frame is active.
The frame header displays when both and are toggled-on. If you turn off the border by toggling-off , the header turns off as well.
The frame header contains user-configurable information which defaults to:
&(FrameName) | &(date) | &(DataSetTitle)where FrameName is the frame’s name, date is the date the frame was created or revised, and DataSetTitle is the title of the active dataset. You can change these defaults in your configuration file using the $!GLOBALFRAME command (see the Scripting Guide).
Frame Background Color Modification
Select the Color box in the dialog (accessed from the menu) to adjust the frame background color. Toggle-off to set the frame background to transparent.

Frame Name Modification
Enter text in the Frame Name region of the dialog (accessed from the menu) to change the name of the active frame. The text entered here is displayed as the name of the frame.

Frame Linking
The dialog, accessible through , allows you to link specific style attributes either between frames or within a frame. Linking between frames, on the Between Frames page of the dialog, allows you to quickly make changes in one frame and propagate them to a number of other frames. Linking within frames, on the Within Frame page, links attributes between similar objects within a frame.
Attribute Linking Between Frames
Use the Between Frames page of the dialog (accessed from ) to link the following attributes (shown below):
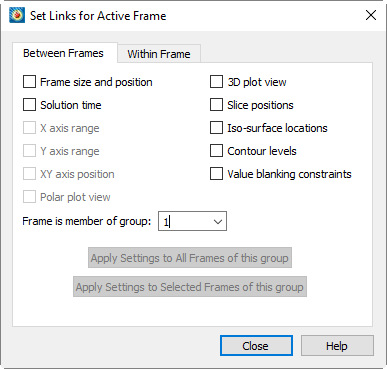
- Frame Size and Position
-
Use this option to overlay transparent frames. (See Frame Background Color Modification.)
- Solution Time
-
All frames display the same solution time.
- X Axis Range, Y Axis Range (For XY Line and 2D plots)
-
Links the X-Axis or Y-Axis range and the positioning of the left and right sides of the viewport.
| For XY Line plots, axis range linking applies only to the first axes, X1 and/or Y1. |
- XY Axis Position (For XY Line and 2D plots)
-
Links the positioning of the X and Y-Axes between frames, including the method used for positioning the axes, such as aligning with an opposing axis value.
- Polar Plot View
-
Link views for frames using the Polar Line plot type.
- 3D Plot View
-
Link the 3D axes and 3D view.
- Slice Positions
-
Link slice positions and slice planes for active slices (not slice style).
- Iso-Surface Locations
-
Link iso-surface values (but not iso-surface plot style).
- Contour Levels
-
Link the values and number of contour levels for 2D and 3D plots.
- Value Blanking Constraints
-
Link all value-blanking attributes.
| It is not necessary to close and reopen the dialog between frames. Simply select another frame with the dialog open to edit linking for the newly active frame. |
Frame Linking Groups
You can segregate frames into groups so that only frames in that group receive changes made in the linked attributes. By default, all frames are added to Group 1. Add a frame to a group by selecting the appropriate group number from the drop-down menu on the Between Frames page of the dialog. You can assign frames to groups 1-20. New frames added to a group take on the characteristics of previous members of the group.
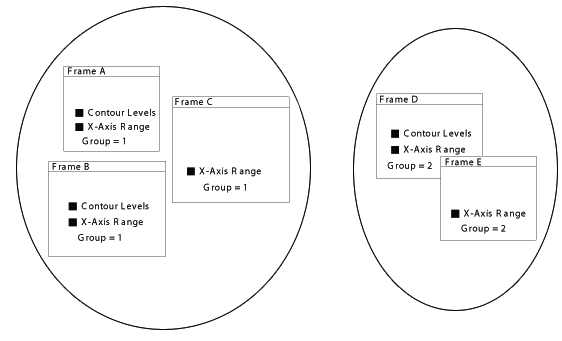
Propagating Between-Frame Link Attributes to Other Frames
Once link attributes are set in a frame group, you must set these same attributes in other frames for linking to occur. Each frame may have each of the attributes selected or not linked. If you want all or a selected group of frames to have the same link attributes, select the appropriate button to quickly propagate the link settings. Alternatively, you can select each frame individually, making the same selections on the dialog for each chosen frame.
| When 2D or XY Line frames have dependent axes and these axis ranges are linked, a "best-fit" attempt is made to match the axis ranges between frames. Misalignments can occur when the aspect ratios for the lengths of the axes is not the same between two frames with linked X and Y-axes. Setting the X and Y-axes to be independent allows a precise match. |
Attribute Linking Within A Frame
The Within Frame page of the dialog (shown below) allows you to link the following attributes:
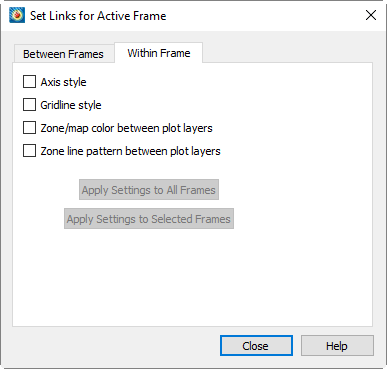
- Axis Style
-
Link activation, colors, line styles, and font styles for objects associated with axes.
- Gridline Style
-
Link activation, colors, and line styles for gridlines.
- Zone/Map Color between Plot Layers
-
Link the color of meshes, contour lines, and other zone layers for Cartesian plots, or link the color of lines, symbols, and other map layers for line plots.
- Zone Line Pattern between Plot Layers
-
Link line pattern style and length for meshes, vector, and contour lines for Cartesian plots.
Settings changed on this dialog take effect immediately. You may also apply the settings to all frames or just to selected frames using the buttons in the dialog.
| Keep in mind that within-frame Linking only links attributes between similar objects within a frame. These attributes are not linked to other frames. The buttons turn on the same Within-Frame Linking properties in other frames. |
Frame Deletion
Delete a frame by selecting the frame and then choosing or pressing the Delete key. This action is not undoable.
Managing Frame Order
Frames can overlap, and when they do, one is drawn in front of the other. You can think of the frames as a stack of papers pinned to a bulletin board. The order of frames can be managed by right-clicking a frame name in the Frames sidebar and choosing one of the following options.
| The Frames sidebar is initially hidden. To display it, choose . |
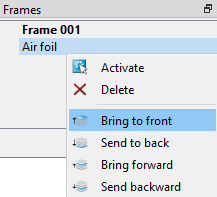
- Bring Forward
-
To move a frame one step closer to the front of the frame stack, right-click its name and choose from the context menu.
- Send Backward
-
To move a frame to one step closer to the back of the frame stack, right-click its name and choose from the context menu.
- Bring to Front
-
To move a frame to the front of the frame drawing order, right-click its name and choose from the context menu. That frame will then appear in front of all other frames.
- Send to Back
-
To move a frame to the bottom of the frame drawing order, right-click its name and choose from the context menu. That frame will then appear behind all other frames.
The context menu in the Frames sidebar also contains an option to the selected frame. This does not change the drawing order of the frame, but does make it The Active Frame.
Save Frame Style
You can save a frame’s style for later use or to share with another frame by selecting in the menu. This will open the dialog, in which you can name and save the style of your active frame as a stylesheet (with the extension .sty). Use the Load Frame Style action to retrieve your frame style in another frame or layout.
The following data is saved:
-
All plot style information
-
Text elements
-
Geometries (shapes such as boxes, circles, and polylines)
-
Stream positions
-
Contour levels
Load Frame Style
To load a saved frame style into your active frame, select in the menu. With the dialog that appears, you can load a frame style saved from another frame (with the extension .sty) to dictate the frame attributes of your active frame. This will affect only the The Active Frame. To save a frame style, use the Save Frame Style function.
The following data is retrieved from the file and applied to the current frame:
-
All plot style information
-
Text elements
-
Geometries (shapes such as boxes, circles, and polylines)
-
Stream positions
-
Contour levels
Workspace Management Options
The workspace is the region in which you can create frames. The paper layout is a subset of the workspace and is correlated to the printer settings.
| The paper is hidden by default in Tecplot 360. Select in the dialog under the menu to include the paper. |
Paper Setup
Tecplot 360’s representation of paper in the workspace allows you to lay out plots precisely the way you want them printed. If you place a frame on the paper and print the resulting plot, the frame appears in the exact relative location on the printed paper.
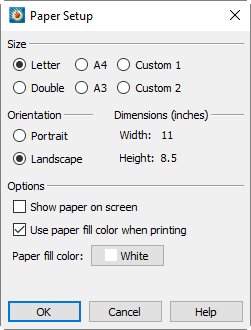
You can control the size, orientation, and color of your paper by going to .
Paper Size Controls
Tecplot 360 offers the following six paper sizes:
- Letter
-
Standard U.S. letter size, 8 1/2 by 11 inches.
- Double
-
Standard U.S. ledger size, 11 by 17 inches.
- A4
-
Standard European letter size, 21 by 29.7 centimeters.
- A3
-
Standard European size, 29.7 by 42 centimeters.
- Custom 1
-
Default is 8.5 by 14 inches.
- Custom 2
-
Default is 8 by 10 inches.
All paper sizes may be customized using options in configuration or macro files. It is recommended that you only change the dimensions of the Custom 1 and Custom 2 paper sizes. To change the Custom sizes see the $!PAPER command in the Scripting Guide.
Paper Orientation Controls
Layouts can be landscape or portrait. In landscape (the default), the long axis of the paper is horizontal, while in portrait, the long axis is vertical. Portrait orientation uses the width of the specified paper for the horizontal dimension, while landscape uses this for the vertical dimension. You specify the orientation as part of paper set-up.
Screen Paper Controls
If you are creating plots for display on your screen, you can toggle-off the screen representation of the paper and use the full workspace by deselecting .
Dimensions (display only)
The units displayed in the region of the dialog are determined by the units established in .
Paper Color Controls
You can set up your paper to show any color as a background color (the "paper fill color") on your screen, as well as use that color when printing to a color printer. When you are printing, the paper can be flooded with your specified fill color. (By default, the paper fill color is ignored during printing.) To use the paper fill color when printing, select from the dialog.
Grid and Ruler Set-Up
The workspace grid provides a convenient guide for placing objects on your paper. When placing text or geometric shapes, you can choose to snap the anchor points of the shapes to the grid. Rulers provide a reference length for sizing objects.
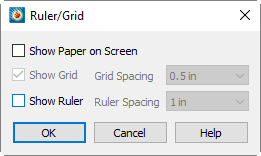
To customize the ruler/grid settings, select from the menu.
Workspace Grid Controls
Tecplot 360 allows you to select grid spacing from several pre-set sizes in centimeters (cm), inches (in), or points (pt) with the Grid Spacing drop-down menu. You can also specify not to show the grid by toggling-off .
| The grid does not display if or are toggled-off. |
Workspace Ruler Controls
You can select the ruler markings from several pre-set sizes in centimeters (cm), inches (in), or points (pt) with the Ruler Spacing drop-down menu. You can also specify not to show the ruler by toggling-off . With toggled-on, rulers appear on the bottom and right-hand sides of the workspace.
View Modification
Use the menu to adjust the view of the active frame, sidebars, or toolbars, or to adjust the view of the entire workspace. The menu is discussed in the following subsections.
Show a Sidebar or Toolbar
You may close a sidebar by clicking its close box. Once closed, you may reopen it by choosing the desired sidebar from the appropriate menu.
| Sidebar | Menu Command |
|---|---|
Plot |
View→Plot sidebar |
Pages |
View→Pages sidebar |
Frames |
View→Frames sidebar |
Quick Macro Panel |
Scripting→Quick Macros |
You may also show or hide a sidebar or a toolbar by right-clicking any toolbar (or the menu bar) and choosing the toolbar or sidebar you wish to show or hide from the context menu.
Redraw Frame
When is toggled-off, click the Redraw button in the Plot sidebar to redraw the active frame.
Zoom
There are two zoom modes: axis (dataset) zooming and paper zooming. To use either,
first activate the Zoom tool  from the Toolbar.
Plot Zooming
With the Zoom tool selected, drag the magnifying glass cursor to draw a box. The region within the view box will be resized to fit into the frame according to the longest dimension of the view box. If is selected (on the Plot sidebar), you cannot make the zoom box larger than the grid area.
| To return to the previous view, select (Ctrl-L) from the menu or (Ctrl-Z) from the menu. |
- 3D mouse
-
Tecplot 360 also supports a 3D mouse, an input device that allows zooming (and translation and rotation) of 3D plots with a touch. You do not need to activate the Zoom tool to use the 3D mouse for zooming. Simply push the mouse’s cap toward or away from you to zoom.
Hold the Alt key while zooming with the 3D mouse to switch the zoom method (see Input Devices for details).
Avoid tilting the mouse cap, as this may induce unintended rotation. Hold down the Alt key to switch between zooming by moving the data and by moving the viewer.
Paper Zooming
With the Zoom tool selected, Shift-drag the magnifying glass cursor to draw a box about the region that you want to magnify. The plot is resized such that the longest dimension of the zoom box fits into the workspace.
| You can fit all frames to the workspace by using the option of the menu. |
Mouse Zoom and Translation
The middle and right mouse buttons allow you to smoothly zoom and translate your plot. The middle mouse button zooms smoothly, and the right mouse button translates (moves).
- 3D mouse
-
Tecplot 360 also supports a 3D mouse, an input device that can be used to zoom and translate 3D plots at any time regardless of the tool or mode selected.
-
Push the mouse’s cap toward or away from you to zoom. Hold the Alt key while zooming with the 3D mouse to switch the zoom method (see Input Devices for details).
-
Pull the mouse’s cap up or push it down to translate vertically.
-
Move the mouse’s cap left or right to translate horizontally.
Avoid tilting or rotating the mouse when using these motions to avoid rotating the plot.
-
Fit Everything
(Ctrl-E) resizes 3D Cartesian plots so that all data points, and all text and geometries positioned using grid coordinates, are included in the frame. By default, geometries use grid coordinates, while text objects use frame coordinates, so typically this means that Fit Everything fits geometries but not text objects, although if a text object has been set to use grid coordinates, it will be included. Use to consider only data in the resizing.
| Long text strings may still extend out of the frame even if positioned using grid coordinates. |
Fit Surfaces
(Ctrl-F) resizes 3D Cartesian plots so that all surfaces are included in the frame, excluding any volume zones. If there are no surfaces plotted, fits all data points, text, and geometries into the frame.
Fit to Full Size
(Ctrl-F) resizes non-3D plots so that all zones or lines, geometries, and text fit within the frame.
Data Fit
resizes the plot so all data points are included in the frame. Text and geometries are not considered. The text and geometries must be set to grid coordinates to be considered in the resizing.
Fit All Frames to Workspace
(Ctrl-Shift-A) resizes all frames proportionally so the frame(s) fill the workspace either vertically or horizontally.
Nice Fit to Full Size
(Ctrl-I) sets the axis range of 2D Cartesian, XY Line, and Sketch plot types to begin and end on major axis increments. If axes are dependent, the vertical axis length is adjusted to accommodate a major tick mark.
Make Current View Nice
(Ctrl-K) modifies the range on a specified axis of 2D Cartesian, XY Line, and Sketch plots to fit the minimum and maximum of the variable assigned to that axis, then snaps the major tick marks to the ends of the axis. If axis dependency is not independent, this may affect the range on another axis.
Center
Centers the plot within the frame. Only the data is centered; text, geometry, and the 3D axes are not considered. Neither the axes nor the plot is changed in size.
Translate/Magnify
The dialog (accessed via the menu), allows you to move and resize your plot within a frame. Translating using this dialog moves the image of your data with respect to the active frame. You can translate plots in any direction within a frame.
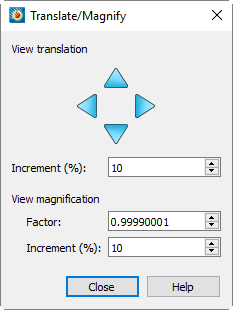
The following options are available in the dialog:
- Up, Down, Left, Right
-
Use the arrows to translate (move) the image.
- Increment (%)
-
Controls the step size for each arrow as a percentage of the workspace.
- View Magnification - Factor
-
Change magnification using the up and down arrows to the right of the text field, or enter a value in the text field.
- View Magnification - Increment (%)
-
The step size for each click of the arrows in the Factor field, as a percentage of the current magnification.
The Translate/Magnify tool  (located in the
Toolbar) allows you to translate/magnify the data within the frame or the entire
workspace. Use the Shift key to translate/magnify the workspace instead of the data.
When the Translate/Magnify tool is active, type +/- on your keyboard to increase/decrease the scale of the image.
| To use the Magnify tool on the workspace, hold the Shift key and click on the workspace. Then, use the + or - keys on the keyboard to change the magnification of the workspace. Single-click on the data to change the mode back to dataset magnification. |
Last
(Ctrl-L) restores the previous view. The command allows you to step backward through the resizings and repositionings of plots. Any time you change the view of a frame, either by zooming, centering, translating, or fitting the plot, the previous view is placed in a view stack. Each frame is allotted four view stacks, one for each plot type. Each view stack stores up to sixteen views, including the active view.
Rotate
Available in the 3D Cartesian plot type only; calls up the dialog for image rotation. For further information, see Three-dimensional Rotation.
3D View Details
Available in the 3D Cartesian plot type only; calls up the dialog for setting the view position and angle of 3D objects. For further information, see Three-dimensional Rotation.
Copy View
Use the menu option to copy the active frame view to the frame view buffer, where it can then be pasted to other frames having the same plot type. The copied view includes all the attributes of the view that are affected by the menu: the amount of zoom, translation and scale, and (in 3D Cartesian plot type) the amount of rotation and perspective projection.
Edit Menu
You can duplicate frames, text, and geometries with the cut, copy and paste options of the menu (or their keyboard equivalents, Ctrl-X, Ctrl-C, and Ctrl-V). You can also cut objects from one location and paste them into another, or throw them away completely using the Delete option.
Undo
All plot and mapping style modifications can be undone. In addition, you can undo a variety of other plot alterations. As a rule, Tecplot 360 allows undo for reversible operations that can be restored without significant impact on the operation’s performance. To undo an operation, select from the menu, or press Ctrl-Z in the workspace.
Specifically, the Undo option is allowed for the following conditions:
-
All zone and map style changes.
-
Some (though not all) frame control operations.
-
Creating new frames.
-
Moving and copying line maps.
-
View operations.
-
Some pick operations.
-
Streamtrace actions.
-
The following data alterations:
-
Deleting zones and variables.
-
Renaming datasets and zones.
-
Creating rectangular or circular zones.
-
Duplication zones.
-
Processing Equations. (Except equations containing derivatives.)
-
| Undo is unavailable for all data operations once an Undo operation has been performed on an un-allowed item. In addition, once an operation is performed that cannot be undone, the entire undo history for that frame is erased. |
Cut
or Ctrl-X removes the selected item from the plot and the active dataset (if applicable), and stores the removed item in the Paste buffer.
| Generally, the Cut, Copy, and Paste options work only within Tecplot 360. However, you can copy selected frames and text objects and paste them into other applications. See Clipboard Exporting to Other Applications. |
Copy
or Ctrl-C stores the selected item in the Paste buffer but leaves it in your plot or the active dataset.
| Generally, the Cut, Copy, and Paste options work only within Tecplot 360. However, you can copy selected frames and text objects and paste them into other applications. See Clipboard Exporting to Other Applications. |
Paste
Use or Ctrl-V to add the contents of the Paste buffer to the active plot. If the object is being copied into the same frame, the new object will be overlaid directly over the original object. Use the or the tool to move the copied item to different locations in the frame.
| Pasting from the Paste buffer is allowed only between compatible frames. Attempting to copy an object into a frame that does not hold an appropriate data type results in an error message. |
Delete
Remove the selected item from the plot and from the active dataset. Deleted items are not stored in the Paste buffer.
| If you cut or clear the only Tecplot 360 frame in the workspace, Tecplot 360 automatically creates a blank frame to replace it. |
Send to Back
Pushes the selected item to the bottom of the active draw stack. The plot is drawn on your screen from the bottom of the draw stack to the top; elements lying further down in the stack may be partially obscured by elements higher up. The following types of objects may be pushed: text, geometries, 2D or XY grid areas, and frames.