Slices
You can add slices to volume and surface zones in your plot in order to view X, Y, or Z planes within your data. With IJK-ordered data, you can also add slices on the I, J, or K planes. It is also possible to create slices with arbitrary orientations.
Slices can include lighting effects, contours, meshes, and more. To customize these and other attributes of slices, use the dialog, accessible in the or the , or use the context menu and context toolbar.

The context toolbar appears above the context menu when you right-click a slice in your plot. This toolbar allows you to turn on or off the grid, contour, vector, shade, edge, and translucency layers for the selected slice(s). Additionally, you may adjust frequently-used style settings for each layer using the drop-down menu to the right of each, for example selecting a color for the grid (or choosing a variable by which to color it).
Tecplot 360 includes a simple interactive method for creating slices. Select the in the toolbar or in the to activate a crosshair cursor, then click in a volume or surface zone to "drop" a slice into that zone. You can then drag the slice to change its position. Refer to Slice Tool for more information on working with the tool.
For additional control, additional slices, or another way to insert slices derived from
the dataset, use the page of the dialog. You can open
the dialog by clicking the  button next to the in the or by choosing from the
.
Interactively created slices are derived from the dataset and are defined by a constant X, Y, or Z location (or constant I, J, or K indexes, for IJK ordered zones). Tecplot 360 considers this type of slice as part of your plot’s style and does not add it to the dataset unless you extract it to a zone (using ).
Interactively Created Slices
Use the dialog to customize interactively created slices (that
is, slices derived from your dataset). Click the  button next to the in the , or select from the
, to launch the dialog. To add slices to your
plot in the dialog, toggle-on in the
dialog.
The dialog includes the following pages: Slice Definition Page, Contour Page, Vector Page, Other Page, and Animate Page.
| You must toggle-on Show Group in order for the changes made in the dialog to be visible in your plot. |
Slice Groups
Up to eight different slice groups can be set. Each slice group can use different slice planes or different ranges for the same slice plane. Changing the settings in the dialog allows you to make the appearance of each slice group unique. The slice group is specified using the numbers at the top of the dialog
| You must toggle-on Show Group (where ) in order to include the in your plot. |
Slice Definition Page
Use the page of the dialog to customize the position of the active slice group (accessed via the or ).
You can toggle-on and use the to move the first (start) slice, or type in the slice position. Activate the last (end) slice and move it with the .
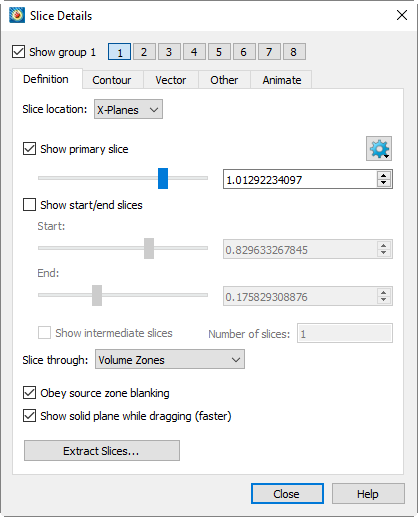
The following options are available:
- Slice Location
-
Select which plane the slice is drawn on (X, Y, Z, I, J, or K). You may also choose Arbitrary to place the slice on an arbitrary plane; see Arbitrary Slice Orientation.
- Show Primary Slice
-
Toggle-on to include the primary slice (first slice placed) in your plot. Use the slider or the text field to position the primary slice.
- Show Start/End Slices
-
Toggle-on to include start and end slices in your plot. Use the corresponding sliders or text fields to position the slices.
- Show Intermediate Slices
-
Toggle-on to show intermediate slices evenly distributed between the start and end slices.
- Num Slices
-
Enter the number of intermediate slicing planes in the text field. (Range 1-5000.)
- Range for all Sliders
-
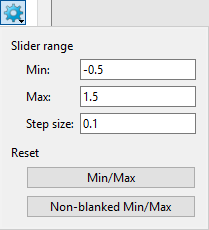
Click the gear icon next to to reveal a flyout dialog that sets the range of the sliders.
- Min, Max, Step Size
-
Specify the start, end, and step for the slider range.
- Reset Slider Range
-
Automatically selects the min/max of values based on Slice location or the min/max of the non-blanked values based on Slice location. is disabled for I-, J-, and K-Planes.
- Slice Through
-
Choose to slice through volume zones, surface zones, or the surfaces of volume zones.
- Obey Source Blanking
-
When active, slices are subject to any blanking used for the data. When inactive, slices are generated for blanked and unblanked regions. See also Blanking.
- Show solid plane while dragging
-
Toggle-on to show a solid-colored plane in place of the slice while dragging. Since the data within the slice does not need to be drawn to the screen, this can make dragging noticeably faster and smoother, particularly with large data sets.
The checkbox is a global setting that applies to all slice groups, not just the selected group. It is not available if the slice plane is I, J, or K. - Extract Slices
-
Select the Extract Slices button to open the Extract Slices dialog. See Extracting Slices to Zones for more information.
Arbitrary Slice Orientation
To orient slices in an arbitrary direction, choose from the menu. As with other slices, you may specify origin points for a primary slice and/or for start and end slices. Slices pass through the indicated origin point(s), so you can easily align the edge of a slice or group of slices along some other feature of the plot, such as an axis. If intermediate slices are activated, they are drawn equally spaced between the slices defined by the start and end origins.

An arbitrarily-oriented slice may be manipulated interactively. When the slice tool is active, a slice-normal interactor appears in the plot.
-
Drag the far end of the interactor to change where the normal points and thus the orientation of the slice(s).
-
Drag the near end of the slice normal to move the origin point of the slice.
-
If multiple slices are active, you may click a slice to move the normal to that slice.
| Interactive orientation of arbitrary slices is not available with scaled axes or perspective view. In these cases, the interactor does not appear. |
You may adjust the orientation of the slice in small increments using the + and - buttons for the X, Y, and Z axes to rotate the slice a step at a time around an axis.
With an arbitrary slice, you may also:
- Orient a Slice by Specifying a Normal
-
Click the gear icon to enter a normal vector in a flyout dialog.
- Orient a Slice by Entering Three Points
-
Click the Three Points button to specify three points on the cutting plane using the Enter 3 Points dialog.
- Orient a Slice by Probing Three Points
-
Click the
 three-point probe icon on the Definition
page of the Slice Details dialog to specify three points on the cutting plane by
clicking the plot.
Orient a Slice by Specifying a Normal
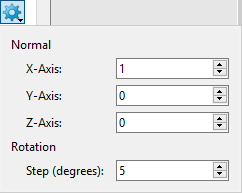
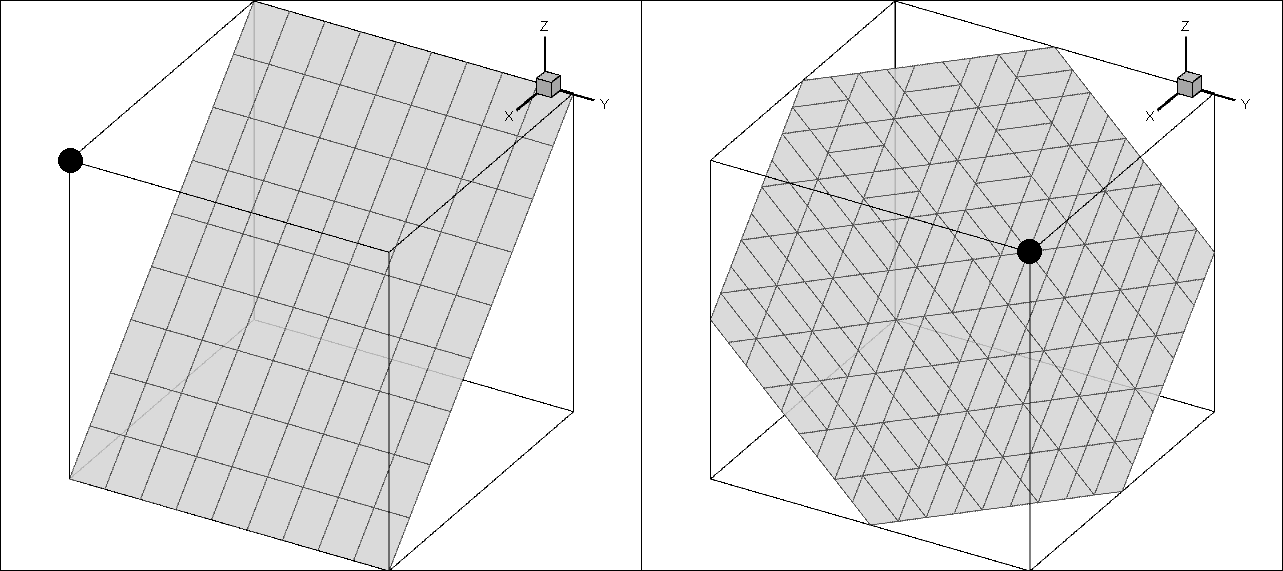
Click the gear icon to reveal a flyout dialog that lets you choose the orientation of the slice by numerically specifying its normal. A normal vector is established between the slice origin and the specified coordinates, and the slice is oriented perpendicular to this vector, as shown below.
You can also adjust the step value by which the + and - buttons rotate the slice in this flyout.
Orient a Slice by Entering Three Points
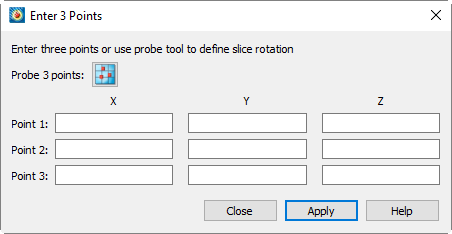
You can orient a slice by specifying the coordinates of three points on a plane. These points must form a triangle; they cannot be coincident or collinear.
Click the button in the dialog to open the dialog, shown here, then enter the X, Y, and Z coordinates of the three points. When you click , the origin and normal vector of the slice are recalculated so that the slice plane passes through all three specified points. (The third entered point is used as the slice origin.)
| The values in the dialog are not updated when the slice orientation is adjusted using the other available methods. |
In this dialog, you may also click the  three-point
probe button to Orient a Slice by Probing Three Points.
Orient a Slice by Probing Three Points
In the dialog or the dialog, click the
 three-point probe button, then click three points in
your plot. The X, Y, and Z coordinates of the three points are collected in the dialog. After the third point is clicked, the slice’s origin and normal are
recalculated so that the cutting plane passes through all three clicked points. The
third point is used as the slice’s origin.
| The probe tool keyboard shortcuts may be used when clicking to change the points selected, for example choosing the nearest data point by holding the Control key while clicking. See Probe Tool for other shortcuts. |
Contour Page
Use the Contour page to control the contour attributes of the active slice group (determined by the number buttons on the top of the page).
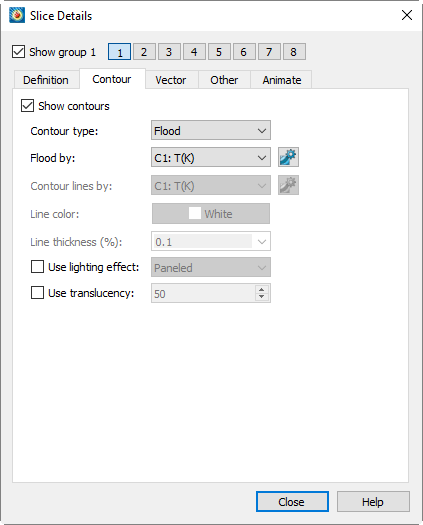
The following options are available:
- Show Contours
-
Select this check box to show contours.
- Contour Type
-
Select the contour type from the drop-down. Lines, Flood, Lines and Flood, Average Cell Flood, and Primary Value Flood are available.
- Flood by
-
If you chose contour flooding, select the contour group by which to flood, or RGB flooding.
 Icon
Icon-
Use this button to bring up the Contour & Multi-Coloring Details dialog.
- Contour Lines by
-
If you chose contour lines or lines and flood, select the contour group by which to draw the lines.
 Icon
Icon-
Use this button to bring up the dialog.
- Line Color
-
Choose the line color in the Color Chooser. Multi-Color will color the slice contour lines based on the contour group variable.
- Line Thickness
-
Specify the line thickness as a percentage of the frame width. You may enter a value in the text field, or choose one of the values in the drop-down.
- Use Lighting Effect
-
Select this check box to enable the lighting effect drop-down menu where you may choose "Paneled", "Smooth", or "Smooth with creases" shading. See Lighting Effects for more details on lighting effects.
- Use Translucency
-
Select this check box to enable the surface translucency text field, where you may set the surface translucency from one (opaque) to 99 (translucent).
Vector Page
Use the Vector page of the dialog to control the vector attributes of the active slice group (determined by the group number buttons on the top of the page).
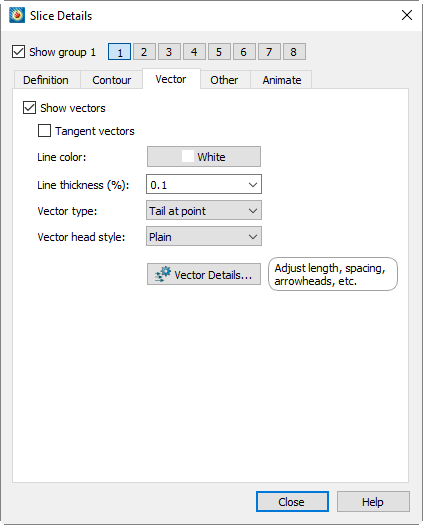
The following options are available:
- Show Vectors
-
Select this check box to show vectors.
- Tangent Vectors
-
Select to use tangent vectors for your slices. See Vector Plot Modification for more information.
- Line Color
-
Choose the line color from the Color Chooser. Multi-color will color vectors based on the contour group variable. If no contour variable is set for the selected contour group, the dialog will appear.
- Line Thickness
-
Specify line thickness as a percentage of the frame height. You may enter a value in the text field, or choose one of the values in the drop-down.
- Vector Type
-
Use this drop-down to set the vector type for your slices. Choose from Tail at Point, Head at Point, Anchor at Midpoint, and Head Only.
- Vector Head Style
-
Use this drop-down to set the vector head style for your slices. Choose from Plain, Filled, and Hollow.
- Vector Details…
-
Opens the Vector Details dialog to adjust Vector length, spacing, arrowheads, etc.
Other Page
The Other page of the dialog controls the mesh, shade, and edge attributes of the active slice group. (The active slice group is determined by the group number buttons on the top of the page.)
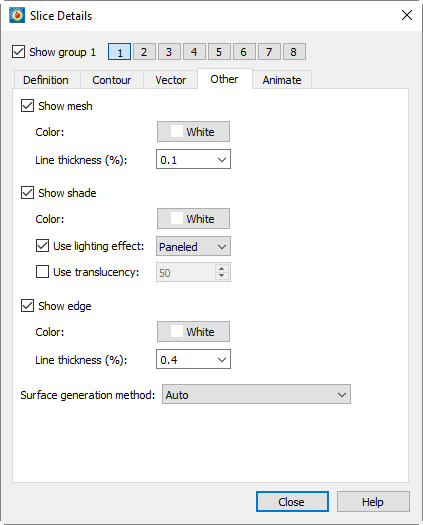
The following options are available:
- Show Mesh
-
Select this check box to show mesh lines.
- Color
-
Choose the line color in the Color Chooser. Multi-color will color meshes based on the contour group variable. If no contour variable is set for the selected group when selecting Multi-color, the dialog will appear.
- Line Thickness
-
Specify the mesh line thickness as a percentage of the frame width. You may enter a value in the text field, or choose one of the values in the drop-down.
- Show Shade
-
Select this check box to show shading on the slice when Show Contour has not been selected or is set to Lines on the Contour page of this dialog.
- Color
-
Choose the shade color from the Color Chooser. Multi-color and RGB coloring are not available—use flooded contours for multi-color or RGB flooding.
- Use Lighting Effect
-
Select this check box to enable the lighting effect drop-down, where you may choose "Paneled", "Smooth", or "Smooth with creases" shading.
- Use Surface Translucency
-
Select this check box to enable the surface translucency text field, where you may set the surface translucency from one (opaque) to 99 (translucent). By default, slice translucency is toggled-on at 10 percent when your plot is loaded.
- Show Edge
-
Select this check box to show selected edge lines on all slices.
- Color
-
Choose the edge color from the Color Chooser. Multi-color and RGB coloring are not available.
- Line Thickness
-
Specify the edge thickness as a percentage of the frame width. You may enter a value in the text field, or choose one of the values in the drop-down.
- Surface Generation Method
-
Determines how the surface is generated.
- Auto
-
Auto selects one of the surface generation algorithms best suited for the zones participating in the slice generation. "All Polygons" is used if one or more of the participating zones is polytope, otherwise slices use "Allow Quads".
- Allow Quads
-
Allow Quads can produce quads or triangles, and the resulting surface more closely resembles the shape of the volume cells from the source zone. Since the quads are not arbitrarily divided into triangles, no biases are introduced, and the resulting surface may appear smoother. This method is preferred when the source zone is FE-Brick or IJK-Ordered and the surface is aligned with the source cells.
- All Triangles
-
All Triangles is an advanced algorithm that can handle complex saddle issues and guarantees that there will be no holes in the final surface. As the surface is composed entirely of triangles, it can be delivered more efficiently to the graphics hardware.
- All Polygons
-
All Polygons is similar to the "All triangles" method except that all interior faces generated as a result of triangulation that are not part of the original mesh are eliminated. This preserves the original mesh of the source zones on the resulting slice.
Animate Page
See Slice Animation.
Extracting Slices to Zones
Normally, slices are derived from the dataset "on the fly" and do not add any data to the dataset. To extract slices to Tecplot zones, allowing you to retain them even if the slice details are changed, use .
In most cases it is not necessary to extract slices to zones, as it is possible to apply most style options directly to a slice. When you need to display multiple sets of slices in various directions, or simply want to "freeze" a slice for some other reason, you may wish to extract at least some of the slices to zones.
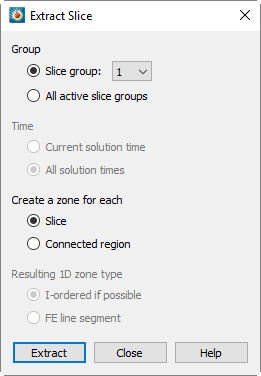
Extracting slices has the following options:
- Group
-
Select between an individual group extraction or all active groups extraction, where active means slices visible on the screen.
- Slice Group
-
Select from the dropdown menu which group is extracted to a zone.
- All Active Slice Groups
-
Extracts slice groups that are set to active.
- Time
-
Specify between extracting a slice for all solution times or the current solution time.
- Current Solution Time
-
Extract a slice for the active solution time.
- All Solution Times
-
Extract a slice for each solution time.
- Create a zone for each
-
Specify how each slice is extracted into single or multiple zones.
- Slice
-
Extracts each slice to a single zone.
- Connected Region
-
Extracts each slice to its connected regions. Connected regions are defined by zone boundaries and areas of disconnected meshes.
- Resulting 1D Zone Type
-
Only active when the slice source is not a volume.
- I-ordered If Possible
-
Creates an I-ordered zone for each slice zone that is a single connected region.
- FE Line Segment
-
Creates all extracted linear zones as FE-LineSeg zones.
Values in the extracted slice are nodal unless Contour Type is set to Primary Value flood on the Contour page of the Slice Details dialog. In this case, the value location for the extracted slice is the same as for the source zones.