Axes
Tecplot 360 automatically enables the axes for 3D, 2D, XY, and Polar plot types. There are five distinct sets of axes, one for each plot type. When the axes are generated, the axis labels, position, spacing, and tick mark labels are created. You can adjust any of these settings by using the dialog (accessed via the menu). Each page of the dialog controls a different aspect of the axis, and each page is available for each axis.
Axis Display
Use the "Show Axis" toggle in the dialog to turn on an axis display. By default, displaying an axis shows the axis line, tick marks, tick mark labels, and title for the axis. It is possible to disable any of these components separately, including the axis line.
To edit an axis from the dialog, use the axis buttons ([X], [Y], [R], etc.) at the top of the dialog to indicate which axis you are working with. To edit a different axis, select a different axis button.

Axis Variable Assignment
For 2D and 3D Cartesian plots, Tecplot 360 initially assigns the first and second variables in the dataset to the X- and Y-axes, respectively. For 3D axes, the third variable in the dataset is assigned to the Z-axis.
To change variable assignments for 2D and 3D axes, select "Assign XY" or "Assign XYZ" from the menu. For line plots, assigning axis variables is part of defining the mappings. See XY and Polar Line Plots for more information.
The axis range may be modified using the Range page of the dialog, accessed via the menu or by right-clicking an axis in a plot. See Axis Range Options for XY and 2D/3D Plots and Axis Range Options for Polar Plots
When working with axis ranges, please keep the following definitions in mind:
- Axis Range
-
Specifies the minimum and maximum data values displayed along the axis. The range for an axis fits the value of the first variable assigned to that axis. If you deactivate the current layer and activate another layer, it may be necessary to reset the axis range.
- Axis Length
-
Specifies the physical length of the axis on the screen or paper.
- Axis Scale
-
Specifies the ratio of the axis length to the axis range.
Axis Range Options for XY and 2D/3D Plots
This section discusses the options for XY Line, 2D Cartesian, and 3D Cartesian plots that can be found on the Range page of the dialog.
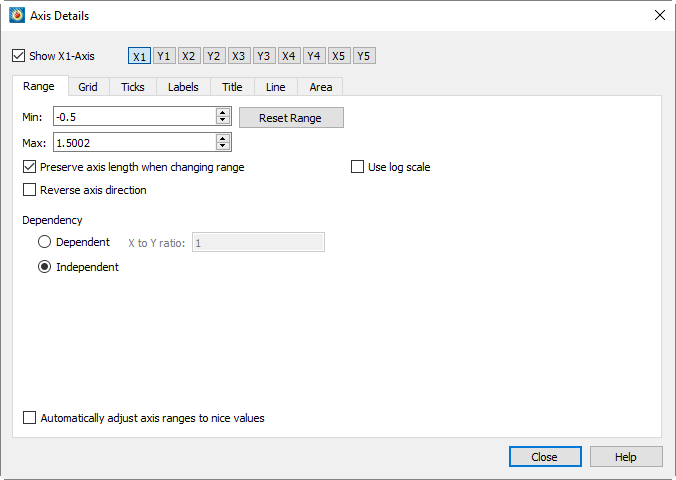
The Range page has the following options:
-
Toggle-on this checkbox to show the selected axis (n) on the plot. Use the buttons [X], [Y], etc. to the right of this checkbox to select the axis to show.
-
Enter the minimum value of the axis range.
-
Enter the maximum value of the axis range.
-
Reset the and fields by selecting one of three options from the drop-down menu:
-
Sets the range to slightly larger than the current axis variable range in order to begin and end the axis at major axis increments.
-
Sets the range to the minimum and maximum variable values, considering the effects of blanking.
-
Rounds the axis range to the nearest major axis increment.
-
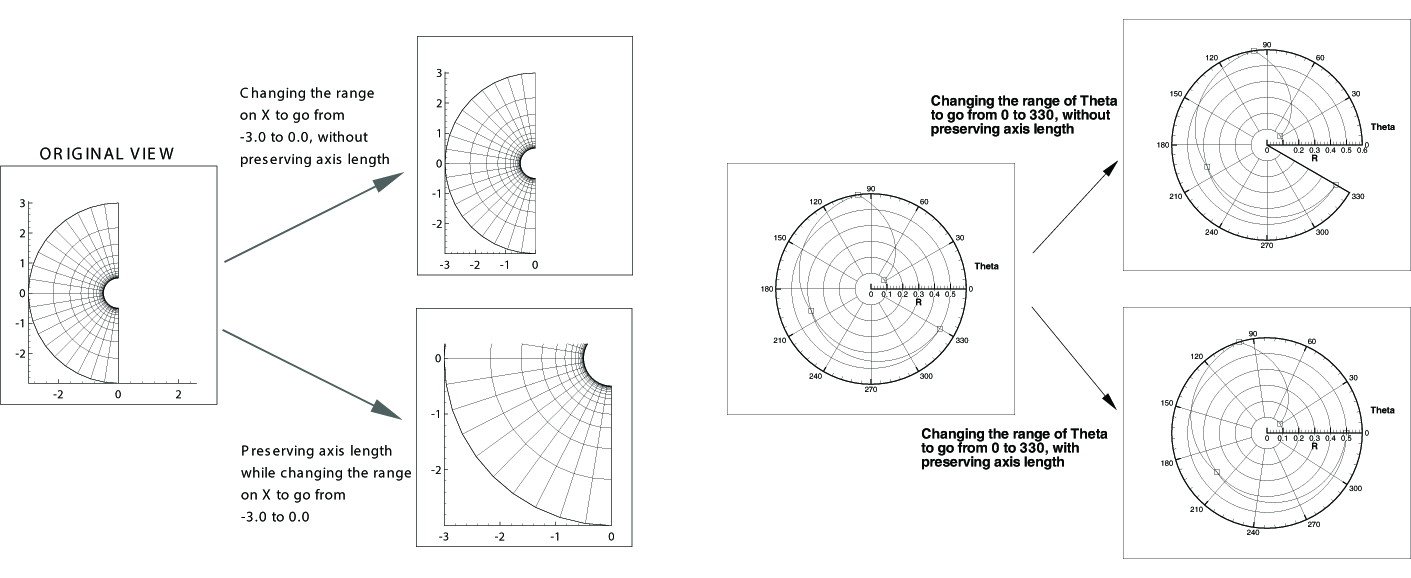
If toggled-on, and your axes are Independent, changes to the X to Y Ratio will affect the axes' range, but not their scale. Toggle-off to change both the axis range and axis scale simultaneously. See Figure 1.
-
The X and Y axes of 2D or XY Line plots can have a linear scale (default) or logarithmic scale. When "Auto Spacing" is selected with logarithmic scale, large numbers are displayed in scientific notation (i.e., 3.48x10⁵). It is strongly recommended that you use "Auto Spacing" with log axes. Navigate to the Ticks or Labels page of the dialog, and toggle-on "Auto Spacing" to use this option.
-
Toggle on to display the axis from high to low rather than from low to high. Not available for 3D Cartesian plots.
-
Select whether to set the axes as dependent upon or independent of each other. For XY Line or 2D Cartesian, select "Independent" or "Dependent".
When a logarithmic scale is being used in an XY Line plot, the axes must be independent. For 3D Cartesian, select from one of the following options:
-
All axes are independent.
-
The X and Y axes are dependent upon each other. The Z axis is independent.
-
Changing the scale on any axis results in a proportional change in scale on the other two axes, so that the specified X to Y Ratio and X to Z Ratio are preserved.
-
- 2D Plots
-
If "Dependent" is selected, enter the X to Y Ratio.
- 3D Plots
-
If "XY Dependent" is selected, enter the X to Y Ratio.
- 3D Plots
-
If "XYZ Dependent" is selected, enter the X to Y Ratio and the X to Z Ratio.
-
Automatically adjusts the axis ranges to the nearest major axis increments.
-
If the axes are XY-dependent, changing the X or Y size factor changes the other. If the axes are XYZ-dependent, changing one size factor changes the other two.
-
Resets the Dependency controls to their defaults.
Axis Range Options for Polar Plots
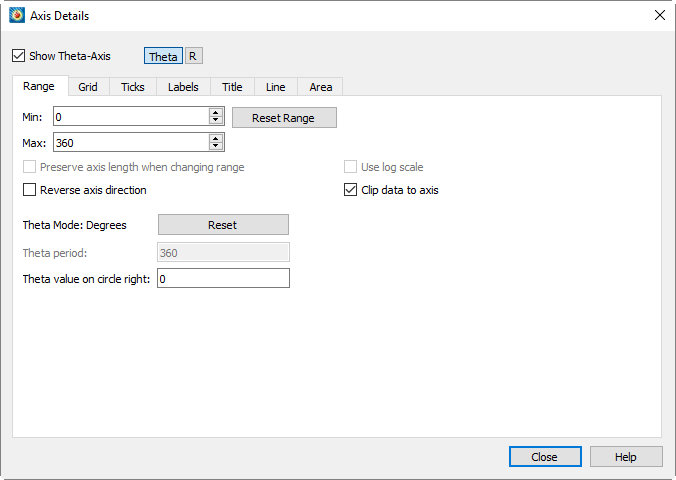
Polar axes are different from any other axis type due to their cyclical nature. Each polar axis (Theta and R) has very different settings, unlike XY or XYZ axes. For the Theta-axis you can change the Theta Mode, Theta Period, and Theta Value on Circle Right; for the R-axis you can change the origin; and for both axes you can clip the data to the axes.
- Show Axis
-
Toggle-on this checkbox to show the selected axis on the plot. Use the buttons Theta, R, etc. to the right of this checkbox to select an axis.
- Min
-
Enter the minimum value of the axis range.
- Max
-
Enter the maximum value of the axis range.
- Reset Range
-
Reset the and fields by selecting one of three options from the drop-down menu.
- Reset to Entire Circle
-
Sets the range of Theta to encompass an entire circle.
- Reset to Nice Values
-
Sets the range to slightly larger than the current axis variable range in order to begin and end the axis at major axis increments.
- Set to Var Min/Max
-
Sets the range to the minimum and maximum variable values.
- Make Current Values Nice
-
Rounds the axis range to the nearest major axis increment.
- Preserve length when changing range
-
If toggled-on, changes to the Theta to R Ratio will affect the axes' range, but not their scale. Toggle-off to change both the axis range and axis scale simultaneously. See Figure 1 for an illustration of the difference.
- Use log scale
-
The R axis can have a linear scale (default) or a logarithmic scale. When "Auto Spacing" is selected with logarithmic scale, large numbers are displayed in scientific notation (i.e., 3.48x10⁵). It is strongly recommended that you use "Auto Spacing" with log axes. Navigate to the Ticks or Labels page of the dialog, and toggle-on "Auto Spacing" to use this option.
- Reverse axis direction
-
Toggle on to display the axis from high to low rather than from low to high. Not available for 3D Cartesian plots.
- Clip Data to axis
-
For Polar Line plots, it is possible to have data that extends beyond the edges of the axes. Use this feature to eliminate data drawn outside of the range of the axes. Clipping data can be set independently for each axis. To activate or deactivate clipping, toggle "Clip Data to Axis" on or off. This feature is illustrated in Figure 2.
 Figure 2. An example of clipping polar data to an axis.
 - Theta Mode
-
By default, the Theta-axis is expressed in degrees mode with a range of 0 to 360. For the Theta axis, you can plot the angles in units of Radians, Degrees, or Arbitrary (where arbitrary sets the Theta range to the maximum and minimum values of the Theta-axis variable).
To set the Theta Mode, choose from the following options:
-
0 - 360 Degrees
-
-180 – 180 Degrees
-
0 – 2Pi Radians
-
Pi-Pi Radians
-
Fit to Var Min/Max
Selecting any of these options changes the Theta Mode, resets the Theta-axis range, and resets the Theta Period. When the Theta Mode is Radians, Tecplot 360 draws Theta labels as fractional units of Pi.
-
- Theta Period
-
The Theta Period specifies the Theta range that is required to create a complete circle. If your Theta Mode is "Degrees", the Theta Period is forced to 360; for "Radians", the period is 2 Pi; for "Fit to Var Min/Max", the period can be set to any value.
- Theta Value on Circle Right
-
The "Theta Value on Circle Right" setting changes the orientation of the Theta-axis. By default, this value is zero, which means that the value zero (or equivalent value, 360 degrees, 720 degrees, and so forth) is displayed on the right hand side of the circle. You can change this value to change the orientation of the axis.
- R-origin
-
The R-origin specifies what value of R is represented at the center of the axis. The effect of changing the R-origin is displayed in Figure 3.
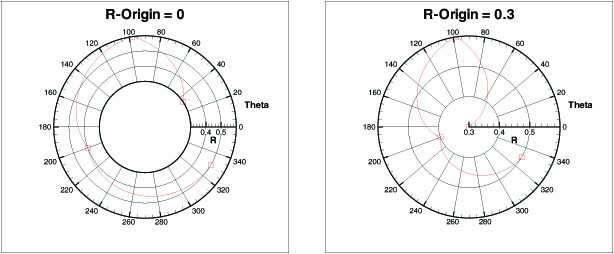 Figure 3. An example of changing the R-origin from a range of 0.3 to 0.6 on a polar plot.
Axis Grid Options
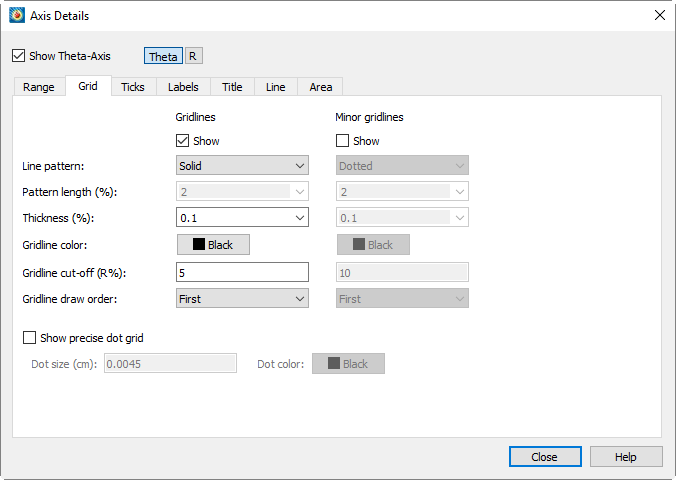
You control the gridlines and precise dot grid from the Grid page of the dialog, as shown below. On this page, you can customize the line pattern, pattern length, line thickness, and gridline color for Gridlines and Minor Gridlines.
-
Match the spacing of tick marks.
-
Subdivisions of Gridlines.
The spacing of Gridlines is controlled by the tick mark spacing; see Tick Mark Options for more information.
-
To activate Gridlines or Minor Gridlines, toggle-on "Show" under these headings on the Grid page. Both kinds of gridlines have the following options:
-
From the Line Pattern drop-down menu, choose one of the following line patterns: Solid, Dashed, DashDot, Dotted, LongDash, or DashDotDot.
-
(Theta axis only) Select a pattern length from the drop-down menu, or enter in your own.
-
Select a line thickness from the drop-down menu, or enter your own as a percentage of frame height.
-
Select the color of your gridlines using the Color Chooser.
-
For all axes except 3D, you may specify a gridline draw order. Gridlines may be drawn either first, before any of the other plotting layers, or last, so they overlay any plotting layers.
-
(Theta axis only) Select the point along the R-axis where you want to stop drawing Theta lines.
In a Polar Line plot, the abundance of gridlines at the center may obscure data. You can specify a gridline cutoff along the R-axis of Polar plots on the Grid page of the dialog for the Theta-axis.
-
The precise dot grid is a set of small dots drawn at the intersection of every minor gridline. In line plots, the axis assignments for the first active mapping govern the precise dot grid. The precise dot grid option is disabled for the 3D Cartesian plots and Line plots when either axis for the first active line mapping uses a log scale.
Tick Mark Options
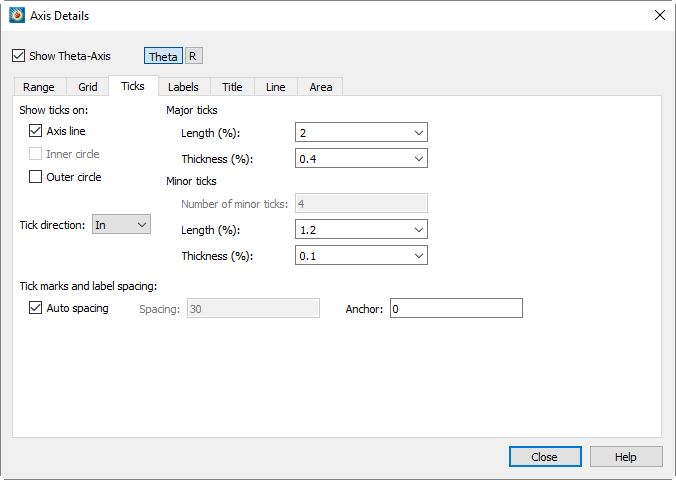
Tick marks can be placed on each axis and labeled with either numbers or text strings. You can define your tick marks and their placement using the Ticks page of the dialog. You can define the tick mark labels using the Label page of the dialog.
-
For each plot type, you can display tick marks at different sections of the axis.(This description also applies to Labels and Titles.)
Sketch, XY Line, and 2D Cartesian axes allow tick marks to be displayed in the following areas:
-
The line that represents the specified axis.
-
By default, the axis line and grid border left/bottom are in the same position. Grid Border Bottom is the lower left-most position of the grid as defined by the viewport settings on the Area page of the dialog.
-
Grid Border Top is the top right-most position of the grid as defined by the viewport settings on the Area page of the dialog.
3D Cartesian axis tick marks can be displayed in the following areas:
-
The line that represents the specified axis.
-
The complimentary line that is opposite the axis line.
Polar R-axis tick marks can be displayed in the following areas:
-
The line that represents the R-axis.
-
Only available if "Draw Axis in Both Directions" or "Draw Perpendicular Axis" is toggled-on for the R-axis. The All R-axes setting will draw tick marks on the additional axes that are drawn.
-
Start point of the polar grid area.
-
End point of the polar grid area.
Grid Border Start and Grid Border End are only available if the polar plot does not form a complete circle. If the data forms a complete circle, there is no start or end point on which to draw the ticks.
Polar Theta-axis tick marks can be displayed in the following areas:
-
The line that represents the Theta-axis.
-
Only available if the minimum (Min) value on the R-axis is greater than the R-origin (Max) value. The Min and Max values are located on the Range page of the dialog (see Axis Range Options for Polar Plots). When this is the case, the center of the polar plot is a circle rather than a single point; therefore, ticks can be drawn on the inner circle.
-
The outer edge of the polar grid area.
-
Tick mark length and thickness can be set independently for major and minor tick marks using the Length and Thickness fields o.
-
To specify the number of minor tick marks, you must first toggle-off "Auto Spacing" at the bottom of the page. The number of minor tick marks can be set in the "Number of Minor Ticks" text field in the Minor Ticks section of the dialog. You may also set their length and thickness.
There is not a separate control for showing minor tick marks. To hide minor tick marks, enter zero in the "Number of Minor Ticks" text field. -
You can control tick mark and label spacing directly, or use "Auto Spacing" (the default) to calculate an optimal spacing for tick marks and tick mark labels. As you change views, particularly in zooming, Tecplot 360 recalculates the spacing. With "Auto Spacing" selected, Tecplot 360 also calculates the number of minor tick marks for you.
Spacing values are shared between tick marks and tick labels. You can change the spacing by adjusting the Auto Spacing, Spacing, and Anchor controls at the bottom of the page under "Tick Mark and Label Spacing".
Tick Mark Label Options
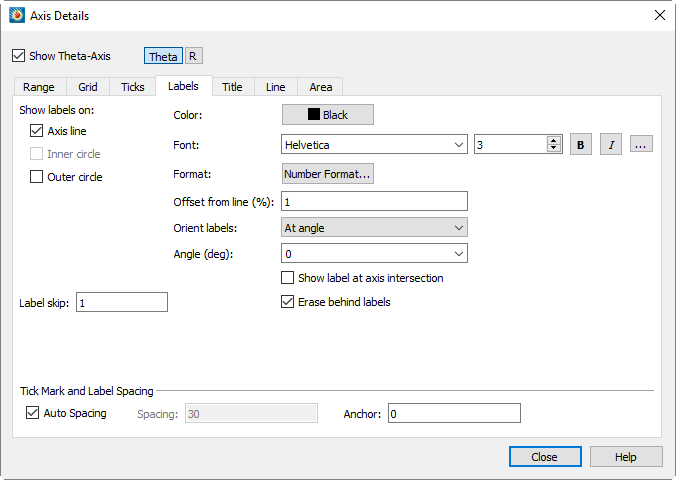
From the Labels page of the dialog, you can specify the label attributes for the tick marks of each axis.
-
Toggle-on the appropriate options for label display. The available options are dependent on plot type.
For Sketch, XY line, and 2D Cartesian line plots, choose from:
-
When toggled-on, axis labels will display on the selected axis line.
-
When toggled-on, axis labels will display on the bottom of the grid.
-
When toggled-on, axis labels will display on the top of the grid.
For 3D Cartesian line plots, choose from:
-
When toggled-on, axis labels will display on the selected axis line.
-
When toggled-on, axis labels will display on the opposite edge of the plot.
For Polar Line plots, choose from:
-
When toggled-on, axis labels will display on the selected axis line.
-
When toggled-on, axis labels will display on the inner edge of the polar grid area. (Only available if the minimum value on the R-axis is greater than the R-Origin value.)
-
When toggled-on, axis labels will display on the outer edge of the polar grid area.
-
Select the color and font in which you want your labels to appear. (See Font Folders and Fallback for more information on how fonts work with Tecplot 360.)
-
Choose how the numbers should be formatted for axis labels using the Specify Number Format dialog.
-
Enter the offset of the tick mark labels from the axis.
-
Select from the following additional options for label display:
-
Labels oriented at the angle specified in the drop-down menu.
-
Labels are parallel to the axis.
-
Labels are perpendicular to the axis.
-
If Orient Labels is set to "At Angle", specify the orientation of the tick mark labels relative to the axis. The angle is measured in degrees counter-clockwise from the axis.
-
[2D, XY, and Polar Only] - Toggle-on to draw a label at the point where two axes intersect. Use this toggle if you have axis labels that are colliding, or are stacked on top of one another at the intersection of two axes.
-
Toggle-on to include a rectangle (with the color of the frame background) behind the label to increase the visibility of the label.
-
Specify the interval between tick mark labels.
-
You can control tick mark and tick mark label spacing directly, or use Auto Spacing (the default) to calculate an optimal spacing for tick marks and tick mark labels. As you change views, particularly in zooming, Tecplot 360 recalculates the spacing. With Auto Spacing selected, Tecplot 360 also calculates the number of minor tick marks for you.
Spacing values are shared between the tick marks and tick labels. You can change the spacing by adjusting the Auto Spacing, Spacing, and Anchor controls at the bottom of the Ticks or Label pages of the dialog.
Axis Title Options
An axis title is a text label that identifies the axis. By default, Tecplot 360 labels each axis with the name of the variable assigned to that axis.
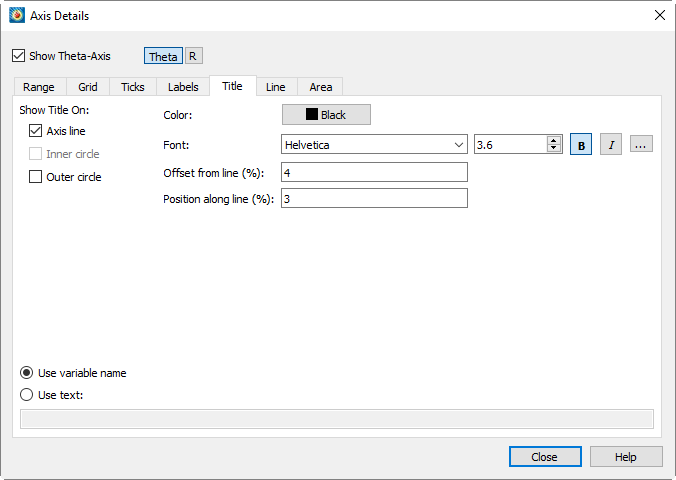
From the Title page of the dialog, you can specify the following attributes for each axis title:
-
For any plot type, you can specify where to show the axis title. Toggle-on "Axis Line" to show the axis title directly on the corresponding axis. The remaining available options are dependent upon plot type.
- For 3D
-
Opposite Edge.
- For 2D, XY Line or Sketch
-
Grid Border Bottom or Grid Border Top.
- For Polar Line plots
-
Inner Circle or Outer Circle.
-
Select the color and font in which you would like your axis to appear. (See Font Folders and Fallback for more information on how fonts work with Tecplot 360.)
-
Prevents Tecplot 360 from printing your axis title directly on top of the axis. You may specify a positive or negative offset from one side or the other of the axis. An offset of zero prints the edge of the axis title on the axis.
You may also adjust the axis title offset using the Adjustor
 tool from the Toolbar (not available for 3D Cartesian plots).
 -
Specify the start position of the axis title as a percentage of axis length.
-
Choose one of the following display options:
-
The legend header will display the variable name assigned to the contour group.
-
The legend header will display text entered into the text field next to the options widget. The text can contain dynamic text (See Dynamic Text for information on dynamic text) and formatted using tags (See Text Details for information text formatting tags).
Axis Line Options
The actual axis line is shown by default whenever the axis is shown. However, you can hide the axis line without turning off the axis as a whole. To show or hide the axis line, select the Lines page of dialog (accessed via the menu).
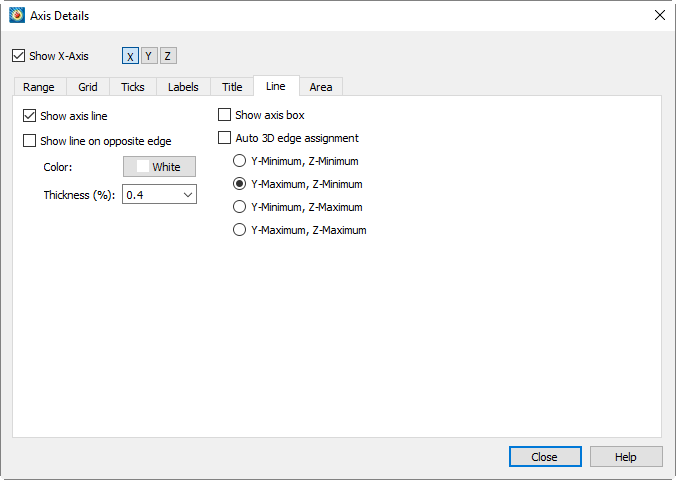
The options in this dialog vary depending on the plot type and, for some plot types, the axis selected. All of the available options are described below, but not all will be available at any one time.
-
Toggle-on or off to display or hide an axis line.
-
Select the color of your axis line using the Color Chooser.
-
Select the thickness of your axis line.
-
(3D Cartesian only) - Toggle-on or off to draw a line on the opposite edge from the selected axis line.
-
Turning on the grid border draws a border around your grid. Toggle-on or off to display or hide the borders of your grid. Not available for 3D Cartesian plots.
-
Select the color of your grid border.
-
Select the thickness of your grid border.
-
Select what part of your plot with which you would like to align your axis. Not available for 3D Cartesian plots.
Sketch, XY line, and 2D Cartesian plots, choose from , , , or . If you choose Axis Value (e.g. Y Value), enter the desired value in the text field. For Bottom or Top, enter the offset from the bottom or top. For Viewport, enter the position within the viewport.
Polar plots (Theta-axis), choose from , , or . When aligning with an R Value, you may enter an R-axis Value to specify the position of the axis line. When aligning with the inner or outer circle, specify an offset. With a zero offset, the axis line is on the inner or outer circle, a positive offset moves the axis line outside the grid area. A negative offset moves the axis line within the grid area.
Polar plots (R-axis),choose from , , or . When aligning with a Theta Value, you may enter a Theta axis value to specify the position of the axis line. When aligning with the inner or outer circle, specify an offset. With a zero offset, the axis line is on the inner or outer circle, a positive offset moves the axis line outside the grid area. A negative offset moves the axis line within the grid area.
-
Align the R-axis with a specific Theta B=Value. The axis is limited to the grid area.
-
Align the R-axis with the start of the grid border. The axis is limited to the grid area.
-
Align the R-axis with the end of the grid border. The axis is limited to the grid area.
-
Align the R-axis with a specific screen angle. The axis is limited to the grid area.
-
Align the R-axis with the top of the grid area. The axis may be drawn outside the grid area.
-
Align the R-axis with the bottom of the grid area. The axis may be drawn outside the grid area.
-
Align the R-axis with the left side of the grid area. The axis may be drawn outside the grid area.
-
Align the R-axis with the right side of the grid area. The axis may be drawn outside the grid area.
-
Specify a Theta-axis value to specify the position of the axis line.
-
Enter the offset of the line from the axis.
-
Enter the angle of the line from the axis.
-
In addition to setting the alignment of the R-axis, you may choose to extend the R-axis by drawing an axis line perpendicular or parallel to the existing axis line.
Toggle-on "Draw Axis in Both Directions" to extend the axis line so that it spans the width of the grid area.
-
Toggle-on "Draw Perpendicular Axis" to draw an axis line perpendicular to the main axis line.
-
(Polar line plots only) Toggle-on "Show Viewport Border" to show the viewport border. The viewport border is defined on the Area page of the dialog.
-
Select the color of your viewport border.
-
Select the thickness of your viewport border.
-
(3D Cartesian only) - When toggled-on, axis lines will display on the opposite edge of the plot.
-
Select the color of your grid border.
-
Select the thickness of your grid border.
-
(3D Cartesian only) Toggle-on "Show Axis Box" to display all edges of all axes.
-
(3D Cartesian only) - Toggle-on "Auto 3D Edge Assignment" to place the three axis lines so they will not interfere with the drawing of the plot. If toggled-off, you have the option to place the line at any pair of edges, such as Y-Minimum & Z-Minimum, Y-Maximum & Z-Minimum, Y-Minimum and Z-Maximum, or Y-Maximum & Z-Maximum. The available pairs depend on the axis selected to edit.
Grid Area Options
The grid area of your plot is the area defined by the axes. From the Area page of , you control whether the grid area or viewport are color-filled. The Area page is shown below.
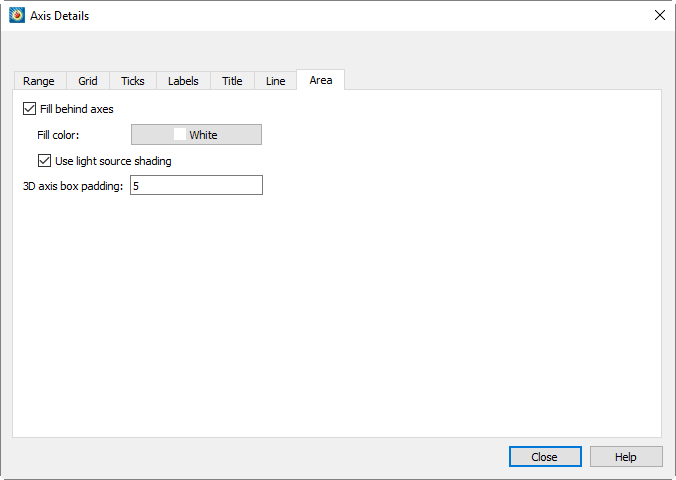
 The Area page has the following options, some of which may not be
available depending on plot type and, for Polar line plots, the selected
axis:
-
For Sketch, XY Line, and 2D Cartesian plots, you can alter the size of the grid area by changing the extents of the viewport. (For these plot types, the viewport and grid area are synonymous.) Click the button to select the color using the Color Chooser.
For 3D Cartesian and Polar Line plots, the grid area is altered by changes to the axis ranges.
3D Cartesian options:
-
Select this option to fill the area behind the axes (your grid area) with a specific color.
-
Select the color with which to fill your grid area in the Color Chooser.
-
Select this option to light source shade the axis planes.
-
Enter the minimum distance from the data to the axis box. Lowering this value does not immediately affect the appearance of the plot, since the existing axes still meet the new constraint; you can use Reset Range on the Range page see Axis Range Options for XY and 2D/3D Plots to force the plot to redraw.
Polar Line options:
-
Select this option to fill the grid area with a specified color.
-
Select this option to fill the viewport area with a specified color.
-
Select the position of the Viewport. The Viewport is the percentage of the entire plot area occupied by the plot grid. Select the location (as a percentage of the entire plot area) in which to place the Left, Right, Top, and Bottom borders of your grid area.
Time/Date Format Options
The dialog is available for all plot types, including Sketch. You can use this dialog to display your axis labels in a number of different formats, including Time/Date format. The dialog can be accessed by going to the or the page, and selecting the [Number Format] button. See Specify Number Format for more information on the dialog.
You can also display elapsed time, instead of absolute time, on any axis. To do this, the original time/date data in your data file must indicate the elapsed time.)
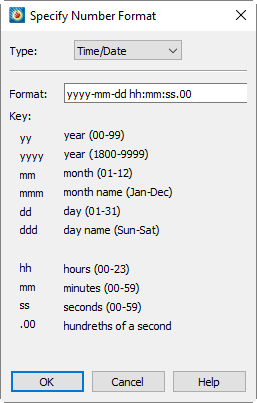
To specify your axis label using Time/Date format, select "Time/Date" from the drop-down menu. Data is read forward from December 30, 1899. Tecplot 360 also accepts negative values to support dates back to January 1, 1800.
You can format your labels by entering the available Time/Date codes in the Format field. When entering a format, any combination or subset of the Time/Date formula may be used.
| If you use "m" immediately after the "h" or "hh" code or immediately before the "ss" code, Tecplot 360 displays minutes instead of the month. |
Use the following formula and table to enter your Time/Date codes:
:
years-months-days hours:minutes:seconds:
| Time/Date Code | Display Format | |
|---|---|---|
Years |
yy |
00-99 |
yyyy |
1800-9999 |
|
Months 1 |
mmmmm |
first letter of the month |
m |
1-12 |
|
mm |
01-12 |
|
mmm |
Jan-Dec |
|
mmmm |
January-December |
|
Days |
[d] 2 |
total number of elapsed days |
d |
1-31 |
|
dd |
01-31 |
|
ddd |
Sun-Sat |
|
dddd |
Sunday-Saturday |
|
ddddd |
S,M,T,W,T,F,S |
|
Hours 3 |
[h] |
total number of elapsed hours |
h |
0-23 or 1-12 |
|
hh |
00-23 or 1-12 |
|
AM/PM |
AM or PM |
|
A/P |
AM or PM as "A" or "P" |
|
Minutes |
[m] |
total number of elapsed minutes |
m |
0-59 |
|
mm |
00-59 |
|
Seconds |
s |
0-59 |
ss |
00-59 |
|
.0 |
Tenths |
|
.00 |
Hundredths |
|
.000 |
Thousandths |
1 Codes can be entered as upper or lower case letters; however, letters will be displayed as shown in the display format. Numbers that cannot be formatted as a time or date will be displayed as asterisks.
2 Total number of elapsed days, hours, and minutes are valid for time values greater than or equal to zero, and equal to or less than 1,000,000 days.
3 If you enter "AM/PM" or "A/P" in your Time/Date format, the "h" and "hh" hour codes are expressed using a 12-hour clock. Otherwise, hours are expressed in military time (24 hour clock).
|
Placing a backslash in front of a y, m, d, or s in the Time/Date formula will keep it from being processed as part of the formula. All characters not part of the Time/Date formula will appear as entered. For example, "\year yyyy" will appear as "year 2008", as the backslash keeps the first y from being processed as part of the formula. |
Examples
To display the time and date on your plot as a "Sat-Jan-05-2008", enter the following code:
ddd-mmm-dd-yyyy
To display the time and date on your plot as a "1-3-08", enter the following code:
m-d-yy
To display the time and date on your plot as a "9:30:05 AM", enter the following code:
h:mm:ss AM
To display an elapsed time, such as "3:10:15", enter the following code:
[d]:hh:mm
Microsoft Excel Support
Tecplot 360 supports Microsoft Excel (except for Mac Excel "1904" format) Time/Date number strings, with the exception of AM/PM time specifications, long day names, and long month names. This support allows you to create number formats in Excel and import them for use with your Tecplot 360 plots, or vice versa.
| Time/Date number strings can be transferred from Excel to Tecplot 360 from Mar 1, 1900 forward. |
Loading Time/Date Data
You can load time/date data into Tecplot 360 in the same way as any other data point. The following methods load time/date data as a floating-point number. (After loading, use to change the axis format to a time/date display.) The following methods can be used to load time/date data into Tecplot 360.
- Excel Macro (add-on)
-
This add-on offers more options to load data from Excel. Although it requires installation into Excel, after installing, this method enables quick and simple data loading from Excel into Tecplot 360. Refer to Excel Add-In for details.
- Text Spreadsheet Loader
-
For loading delimited files, use this loader. Refer to Text Spreadsheet Loader for instructions. Time/date data included in this format must be represented by the floating point number used by Excel and Tecplot 360. (See the Data Format Guide for more information on this formatting.)[xxxxxxxxxxxxxxxxx placeholder for data format guide]