Plot and Data Handling
How to Create a Plot
The basic steps for creating a plot in Tecplot 360 are:
-
Define your dataset using one of the following methods:
-
Use the Load Data command from the menu. Please refer to Loading Data for information on working with a specific data loader.
-
Use the command from the menu to load linked layout or layout package files. (See Layout Files, Layout Package Files, Stylesheets for more information on layout files.)
-
Use any combination of the options in the submenu of the menu or the menu to create your datasets directly within Tecplot 360. Zone Creation and Text, Geometries and Images for more information.
-
-
Select the Plot Type (3D, 2D, XY Line, Polar Line, or Sketch) from the Plot sidebar. Refer to Field Plots for information regarding 3D and 2D plots, XY and Polar Line Plots for information on XY Line and Polar Line plots, and Text, Geometries and Images for information on sketch plots.
-
Toggle-on any mapping or zone layers from the Plot sidebar. The following mapping and zone layers are available:
The layers available in the Plot sidebar are dependent upon the active plot type.
|
In order to view surfaces on your plot, open the dialog, select the , and use the drop-down menu to choose an available surface plotting option. The dialog is available by either on your plot, selecting the button from the Plot sidebar, or selecting from the Menu bar. |
-
Use the options in the menu (such as or ) to customize how your data is displayed. Refer to Three-dimensional Plot Control or Axes for additional information.
-
Use the options in the menu (such as or ) to alter the dataset. Refer to Data Operations and CFD Analysis for additional information.
-
[3D only] Toggle-on zone effects ( and ). Refer to Translucency and Lighting for details.
-
Use the or dialogs to opt zones in and out of plot layers or the entire plot. Refer to Field Plot Modification and the Zone Style Dialog and Mapping Style and Creation, respectively, for details.
-
[2D or 3D only] Add derived objects (Slices, Streamtraces or Iso-Surfaces). Use their respective buttons:


 to customize any derived objects.
You are not limited to working with only one plot at a time. You can create multiple plots on a single page using frames and frame linking, and you can create multiple pages. See Frames for more information.
Data Journaling
On occasion you may modify data prior to making a final plot. Some (but not all) of the data operations mentioned in this chapter modify data. Tecplot 360 "journals" the data modifications you make in the form of macro instructions as well as performing them. If you then save a layout file, the layout file can reference the original data and include the instructions necessary to reconstruct the plot. This way, the original data file is not modified. You can also generate a new plot using a different data file by reusing the layout. (Layout files are text files and may be modified in an editor.)
If you perform an operation that Tecplot 360 is unable to journal, you are prompted to save the dataset to a new file when you save a layout file. This is necessary for the layout to reproduce exactly what you have in your plot.
The following operations are included in the data journal:
-
Data alteration except for derivatives in equations.
-
Creation of rectangular zones, circular zones.
-
Slice extraction of a primary slice through volume or surface zones for X, Y, Z, or arbitrary planes.
-
Zone duplication and mirroring.
-
Zone and variable deletion.
-
Fourier transform.
Data Sharing
In order to conserve computer memory and disk space, Tecplot 360 shares variables between zones whenever possible. Variable sharing typically occurs with any of the following scenarios:
-
When a variable is calculated for two or more zones, Tecplot 360 determines if the results will be the same in the different zones, and shares the variable where appropriate. See Equation Syntax and Variable Sharing Between Zones.
-
When zones are duplicated, all variables are shared between the source zones and their duplicates. See Zone Duplication.
-
When mirrored zones are created, the mirrored zone shares all variables with the original. See Mirror Zone Creation.
-
When a data loader supporting data sharing loads a variable that is identified for two or more zones, that variable is shared among the specified zones. This often occurs with time dependent data, where the physical coordinates (e.g. X, Y, and Z) are typically the same for all time steps.
| If a zone is altered (independently of zones it is sharing data with), any variable that is changed will no longer be shared. |
Variable sharing and connectivity sharing (for finite element zones) can also be
established in a Tecplot data file by supplying the appropriate parameters to the
TECZNE function when writing the file (see the Data Format Guide). In addition,
multiple solution files can share the same grid file.
Data Set Information
The dialog, accessed from the option on the menu, gives summary information about the current dataset, including the dataset title, zone and variable names, and the minimum and maximum values of a selected variable. You can modify the dataset title, zone, and variable names of any dataset.
Zone/Variable Info Page
The following information is provided on the page:
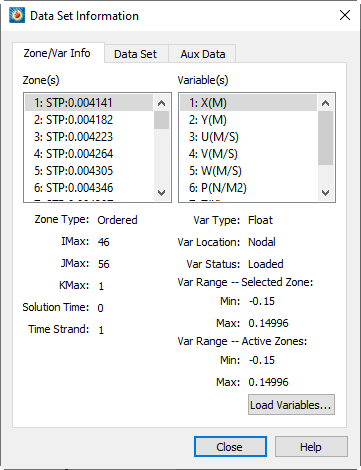
- Zone(s)
-
Lists all zones by number, with their titles.
- Zone Type (Ordered or FE data)
-
Displays the type of zone selected in the listing. For ordered data, it is followed by the index values for IMax, JMax, and KMax (shown below). For finite element data, it is followed by the element type, number of points, and number of elements:
- IMax (ordered data)
-
Displays the IMax value of the zone selected in the listing.
- JMax (ordered data)
-
Displays the JMax value of the zone selected in the listing.
- KMax (ordered data)
-
Displays the KMax value of the zone selected in the listing.
- Pts (finite element data)
-
Displays the number of data points in the zone selected in the listing.
- Elem (finite element data)
-
Displays the number of elements in the zone selected in the listing.
- Solution Time
-
Displays the solution time for the selected zone (see also Time Aware).
- Time Strand
-
Displays the strand ID for the selected zone (see also Time Aware).
- Variable(s)
-
Lists all variables by number, with their names.
- Var Type
-
Displays the type of data of the selected variable in the field.
- Var Location
-
Indicates if variables are located at nodes or cell-centers.
- Var Status
-
Use the Var Status field in the dialog to determine the status of the current variable. The variable status can indicate the variable passivity and if the variable is "loaded" or "not loaded."
- Var Range - Selected Zones
-
Displays the Min and Max values for the selected variable in the selected zones. When working with subzone data, one or more of the values displayed may be estimates, which is indicated by
(est)next to the affected values. - Var Range - Active Zones
-
Displays the Min and Max values for the selected variable for all active zones. When working with subzone data, one or more of the values displayed may be estimates, which is indicated by
(est)next to the affected values. - Load Variables
-
If a variable was not initially loaded, "Not Loaded" will be displayed in portions of the dialog. Use the button to display the Load Variable dialog, with which you can load any variables from your dataset that were not initially loaded.
Load Variable
The Load Variable dialog allows you to load variables into memory if they are not currently loaded. Choose the zone containing the variables you wish to load using the Zone menu at the top of the dialog, then select one or more variables from that zone.

-
Click once to select only a single variable
-
Hold the Shift key while clicking a second variable to select a contiguous range of variables
-
Hold the Control key while clicking to toggle individual variables on and off
-
Hold the Control key while clicking to toggle individual variables on and off
-
Press Control-A to select all variables
Click the [Load] button to load the selected variables. See Load On Demand for more information about this function.
Data Set Page
The Data Set page provides information about your data set, including: title, filenames, number of zones, variables, elements, and lock status.
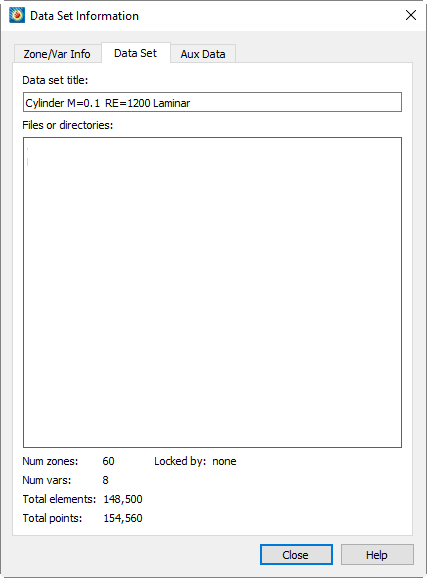
The following information can be found on the Data Set page:
- Data Set Title
-
Enter a title for the current dataset, or edit an existing title. The default is the result of concatenating the titles specified in each record encountered in the data files making up the dataset.
- Files or directories
-
Lists the names and paths of all external data files making up the current dataset. Some file formats use directories as containers; these will list only the directory name.
- Num Zones
-
Number of zones in the dataset.
- Num Vars
-
Number of variables in the dataset.
- Total Elements
-
Total number of elements in the dataset.
- Total Points
-
Total number of points in the dataset.
- Locked By
-
This field will inform you if the current dataset has been locked by an add-on. Add-ons can lock a dataset which in turn prevents you from deleting zones or deleting the last frame associated with the dataset.
Aux Data Page
Auxiliary data is metadata attached to zones, datasets, or frames. Auxiliary data is added to the plot via the data file.
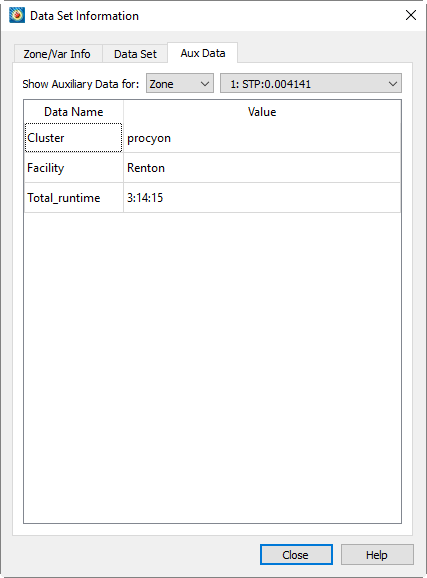
The Auxiliary Data page has the following information:
- Show Auxiliary Data
-
Use the drop-down to display auxiliary data for zones, datasets, frames, or names.
- Data Name/Value
-
Displays the names and values of any auxiliary data.
Refer to the Data Format Guide for information on creating Tecplot 360 data files that include auxiliary data.
Color Chooser
Each attribute of your plot can be set to a different color or color type using the . Use the dialog to apply contour groups, a basic color palette, or RGB coloring to the selected plot attribute.
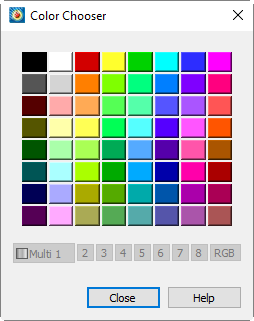
There are three types of color assignments:
- Contour Groups
-
The Contour Variables (Multi 1, 2, 3, 4, 5, 6, 7, and 8) are defined in the Contour & Multi-Coloring Details. The Contour Variables are typically used for coloring mesh, contour, vector, and scatter layers.
- RGB Coloring
-
Select RGB to use RGB coloring established in . RGB coloring is used to illustrate the relationship between two or three variables in your dataset, by setting R, G, and B to each of the variables.
- Basic Color Palette
-
Use the basic color palette to apply a single, constant color to a plot attribute.
For example, you can create a 3D field plot with a contour layer (with colors defined by a contour variable), an edge layer (with colors from the basic color palette), and a vector layer (with colors defined by RGB vectors).
RGB Coloring
RGB coloring occurs when Red, Green, and Blue values are supplied at each vertex. It may be used to create special flooding such as for Oil/Water/Gas or vector direction plots. RGB coloring may be used for each field plot object: zone layers, the mesh or contour layer for streamtraces or iso-surfaces, or any of the layers for slices. This affects multi-coloring for that object as well as any contour flooding. With RGB coloring, multi-colored objects such as vectors or scatter symbols have their color determined based on the RGB components of the field variables at their location. Multi-colored mesh and contour lines use the average value across the mesh line.
|
Exported Vector-based Files Limitation in RGB Coloring. Vector-based export files such as WMF cannot show continuous RGB flooding. Objects that use RGB flooding are reduced to contain average cell flooding where each cell is flooded a solid color based on the averages of the RGB values at each vertex. The user is warned before such output is generated. |
RGB Coloring Options
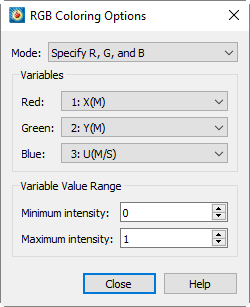
If your data has only two RGB variables, or if the sum of the variables is not normalized, you can adjust the settings using the dialog (accessed via ). The dialog (shown below) has the following options:
- Mode
-
You can either specify all three variables or specify two of the three variables and calculate the third. The third variable is calculated using the following formula f(R)+f(G)+f(B)=1.0 (assuming f() is a function that maps R,G,B values into [0,1.0]).
- Variables
-
Assign the variables which supply the values for the color components, as specified in the RGB Mode.
- Variable Value Range
-
By default, it is assumed that the minimum value for any of the Channel Variables is zero, the maximum is one, and the sum of the three variables is one at every point. If the sum is not normalized, you can set a new minimum and maximum. For example, if your variables sum to 100 at every point, you can enter 100 in the field for Value at .
