Introduction
Tecplot 360 is a powerful tool for visualizing a wide range of technical data. It offers line plotting, 2D and 3D surface plots in a variety of formats, and 3D volumetric visualization.
The user documentation for Tecplot 360 includes these resources:
- User’s Manual (this document)
-
This manual provides a complete description of working with Tecplot 360 features.
- Getting Started Manual
-
New users are encouraged to work through the tutorials provided in the Getting Started Manual to learn how to work with key features in Tecplot 360.
- Scripting Guide
-
This guide provides Tecplot macro command syntax and information on working with macro files and commands.
- Quick Reference Guide
-
This guide provides a handy reference for dynamic text, macro variables, keyboard shortcuts, special characters, and more.
- Data Format Guide
-
This guide provides information on outputting simulator data to Tecplot 360 file format.
- Installation Guide
-
These instructions give a detailed description of how to install Tecplot 360 on your system.
- Release Notes
-
These notes provide information about new and/or updated Tecplot 360 features.
Welcome Screen
When you start Tecplot 360, the Welcome Screen, shown below, appears. You can also open it at any time (even while working on a plot in Tecplot 360) by choosing .
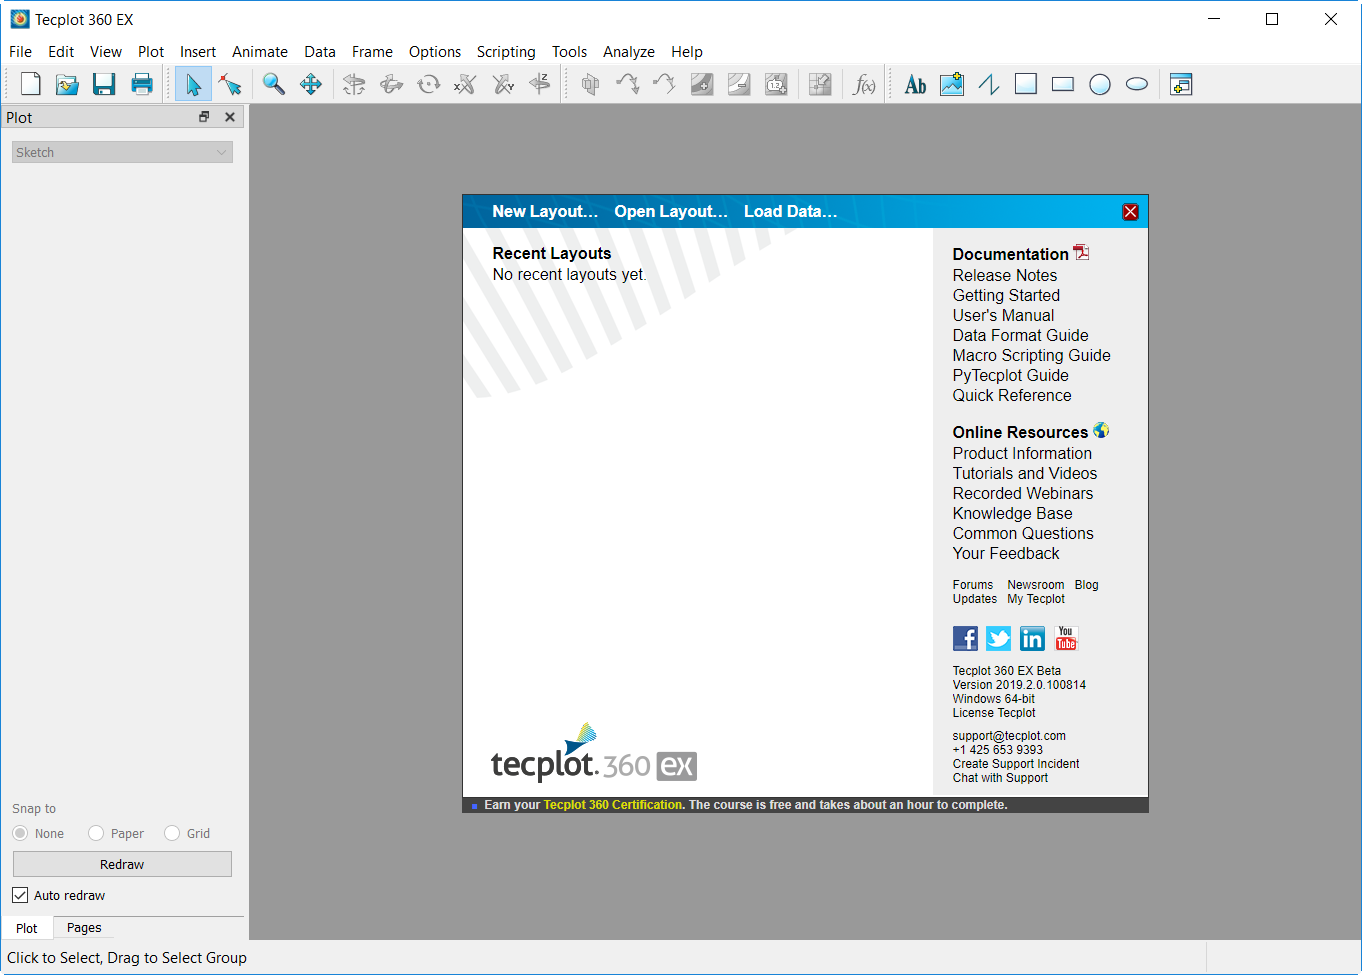
The Welcome Screen contains links that help you quickly get started working with your data and Tecplot 360.
-
Across the top are links for creating a new layout and for opening existing layouts and data files.
-
The left section provides a list of layouts you have recently worked with.
-
The right column contains links to documentation and other resources to help you get the most out of Tecplot 360.
-
At the very bottom of the right column is information for contacting Technical Support, including the version and platform information you will need for a support incident.
The Welcome Screen automatically disappears when you open a layout or create a new one. You may also close it manually by clicking the red X button in the upper right corner; this returns you to your existing layout if you have chosen while you were working with a plot.
Input Devices
Tecplot 360 supports the following input devices:
- Standard mouse
-
Used for pointing at, selecting, and manipulating objects in the workspace; changing the view; choosing fields and manipulating controls in dialogs and sidebars; and performing actions or commands using the toolbar or menus. Most mice have multiple buttons and a scroll wheel, which provide quick access to specific functions.
- Keyboard
-
Used for entering data and text and for activating commands using menu shortcuts. In conjunction with a mouse, can be used to switch modes when clicking or dragging.
- 3D mouse
-
A secondary input device that allows 3D Cartesian plots to be zoomed, translated, and rotated with a touch. Additionally, the always-active 3D mouse doesn’t make you select mouse modes, commands, or keyboard shortcuts. A 3D mouse can therefore enable faster exploration of your data and improve the experience of working with your 3D plots.
| Tecplot 360 supports 3D mouse products from 3Dconnexion, such as the SpaceMouse, SpaceNavigator, and SpacePilot lines, and only on the Windows platform. |
Actions available with a 3D mouse include:
- Translation
-
Push the mouse cap left or right, pull it up, or push it down, to translate the plot left/right or up/down on the screen.
- Zooming
-
Push the mouse cap toward you or away from you to zoom the plot. Hold down the Alt key while zooming to switch zoom methods.
The default zoom method depends on whether the current frame’s 3D view mode is perspective or orthographic (see Three-dimensional View Details). The results of zooming using the 3D mouse and the Alt key are shown here.
Pushing or pulling mouse cap In perspective mode In orthographic mode Normal (without Alt key)
Changes view distance
Changes view width
Alternate (pressing Alt key)
Changes view width
Changes view distance
- Rotation
-
Rotation is around the defined center of rotation, by default the center of the data. However, the axis of rotation is relative to the screen rather than to the data.
- X axis
-
Tilt the mouse cap forward or back to rotate around the screen’s X axis, as if rolling your plot toward you or away from you.
- Y axis
-
Twist the mouse cap clockwise or counterclockwise to rotate around the screen’s Y axis, as if on a lazy susan.
- Z axis
-
Tilt the mouse cap left or right to rotate around the screen’s Z axis, like the hands of a clock.
With practice, it is possible to perform more than one of these operations at the same time. At first, though, it is best to be careful to invoke only one function at a time.
Most 3D mice also have one or more buttons, which can be mapped to commands that you use frequently using the software provided with the device.
| An area of interest can be inspected in greater detail from any angle if the origin of rotation is assigned to it. Mapping the "o" key (orientation change) to a 3D mouse via the device GUI may facilitate a more natural workflow. Simply point the regular mouse cursor at the area of interest and press the orientation change button. |
Tecplot 360 supports the following actions (built-in to the 3D mouse software) that may be mapped to buttons using the device software:
-
Fit (same as )
-
Front, Back, Top, Bottom, Left, and Right View
-
Isometric View 1 (Tecplot 360 default view) and 2 (theta 180° from default)
-
Roll CW and CCW (in 90° increments)
Interface
Five major sections make up the Tecplot 360 interface.
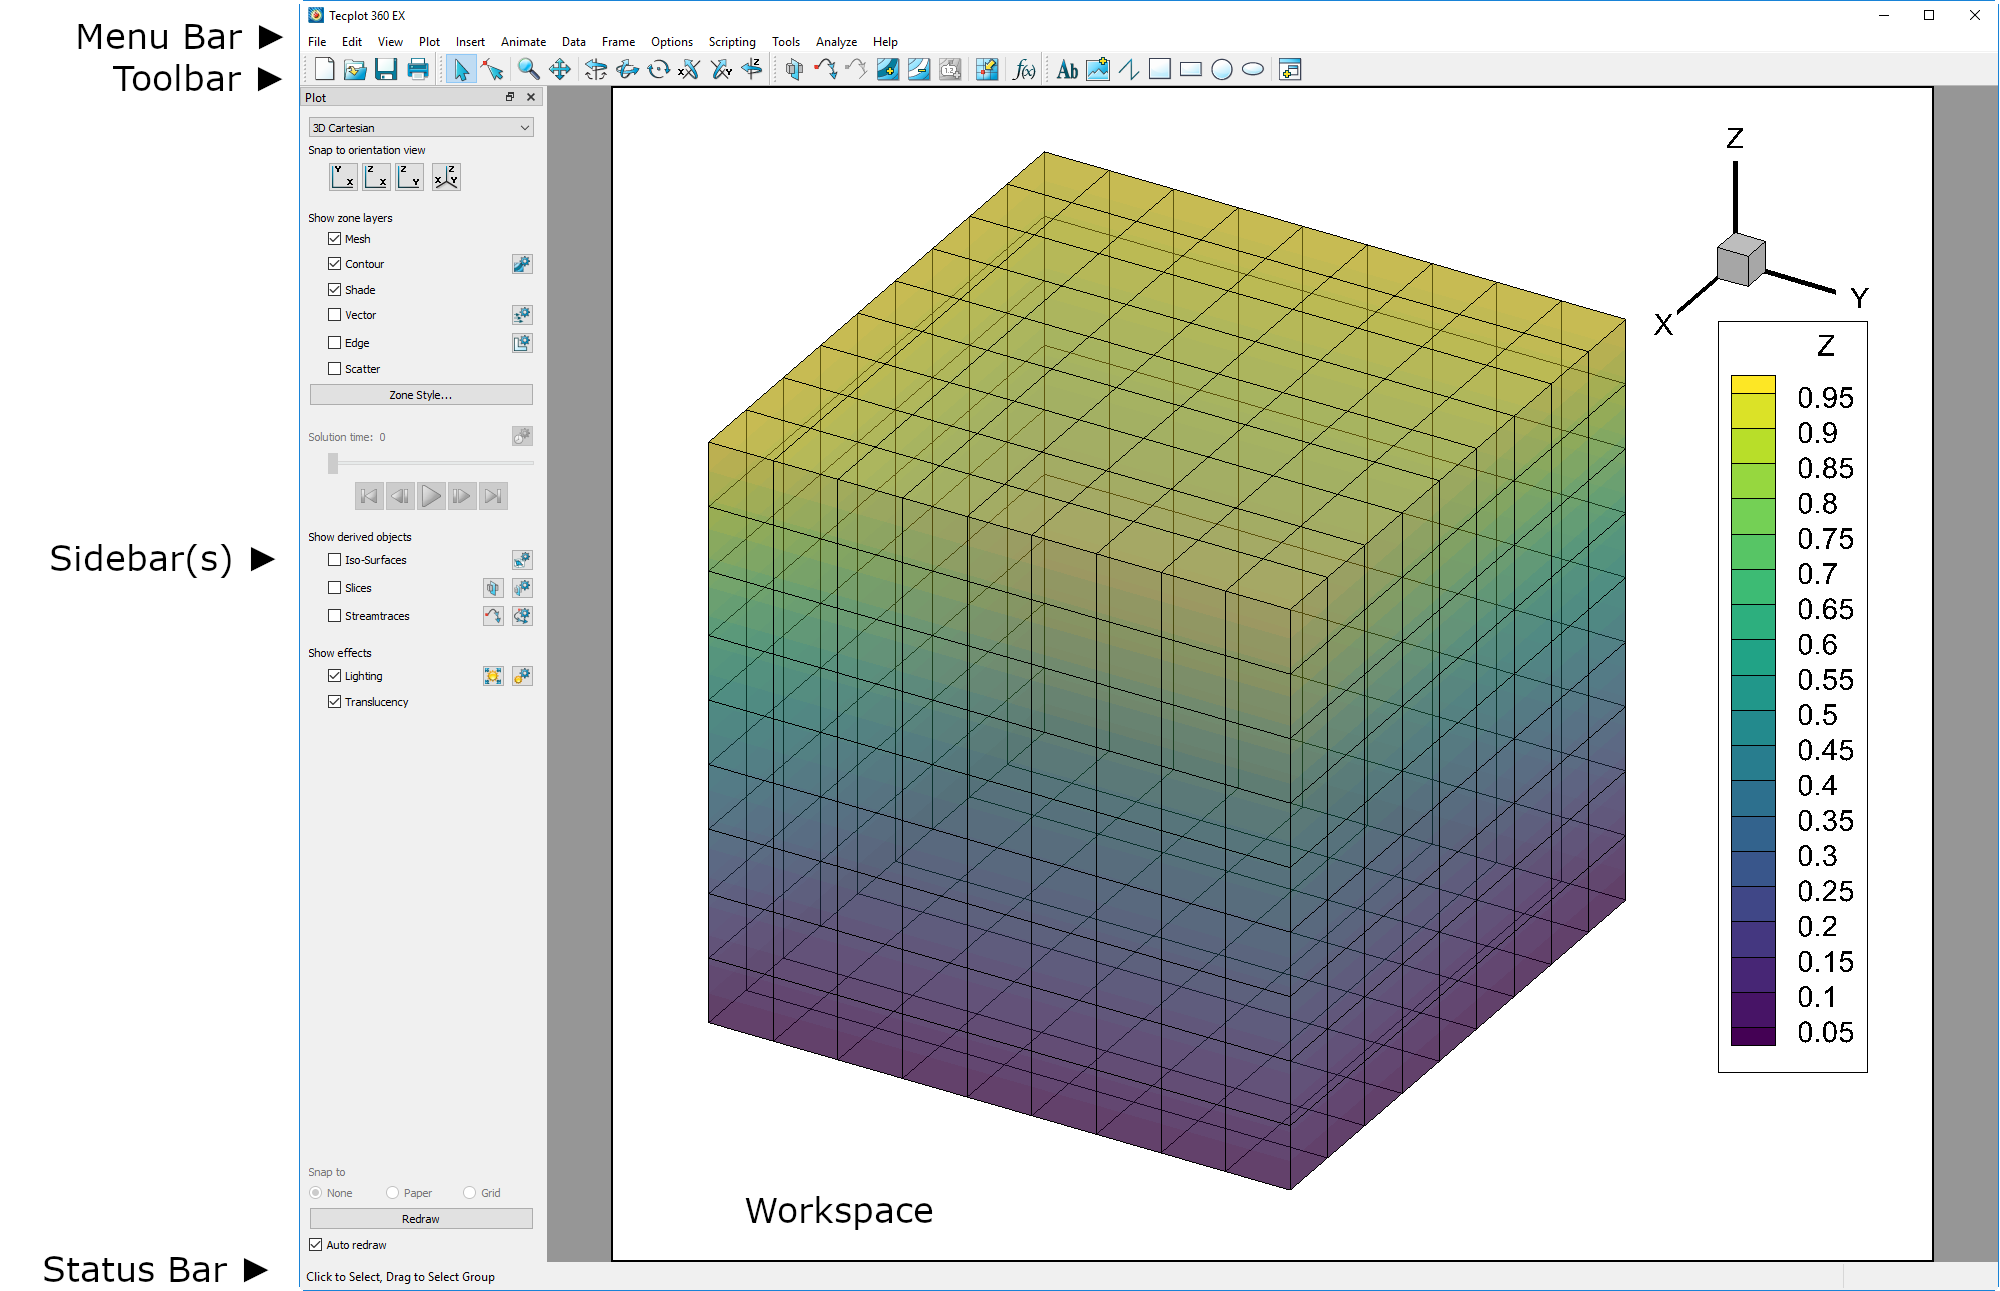
Menu Bar
The menu bar offers access to Tecplot 360 features.

Tecplot 360’s features are organized into the following menus:
-
Use the menu to read or write data files and plot layouts, and print and export plots.
-
Use the menu to select, undo, cut, copy, paste, and delete objects, and to change the draw order for selected items.
Generally, , , and of items other than text work only within Tecplot 360. You can, however, copy an image of a selected frame or the text of a selected text object to the clipboard. See Clipboard Exporting to Other Applications. -
Use the menu to manipulate the way your data is shown or to open a sidebar or the Welcome Screen. See View Modification.
-
Use the menu to control the style of your plots. The menu items available depend on the active plot type (chosen in the Plot sidebar).
-
Use the menu to add text and geometries (polylines, squares, rectangles, circles, and ellipses). If you have a 3D zone, you may also use the menu to insert a slice. If the plot type is set to 2D or 3D Cartesian, you may insert a streamtrace.
-
Use the menu to create animations of your plot.
-
Use the menu to create, manipulate, and examine data. Types of data manipulation available in Tecplot 360 include zone creation, interpolation, triangulation, and creation or alteration of variables.
-
Use the menu to create, edit, and control frames.
-
Use the menu to control your Tecplot 360 experience, including rulers, grids, and performance.
-
Use the menu to play or record macros, and to access the .
-
Use the menu to launch an add-on.
-
Use the menu to examine grid quality, perform integrations, generate particle paths, extract flow features, and estimate numerical errors.
-
Get help for Tecplot 360 features, or view the About dialog, which contains version and platform information.
Context Menu and Toolbar
In many places within Tecplot 360, clicking with the right mouse button displays a context menu that gives you quick access to just the operations most relevant to what you’re clicking. Often, these operations are also available in some other way, such as using a toolbar button, the pull-down menus, or a dialog.
In the Tecplot 360 workspace, the following objects have context menus with the specified functions:
- Frames
-
Change frame order, load and save frame style, frame details
- Axis
-
Axis settings
- Slices
-
Hide, edit slice details, extract slices, slice style
- Iso-surfaces
-
Hide, choose variable, edit iso-surface details, extract surfaces, change iso-surface style
- Zones
-
Hide, deactivate, zone style
- Streamtraces
-
Extract, delete, streamtrace settings
- 3D orientation axis
-
Hide axis, axis settings
- Line maps
-
Deactivate, copy, change curve type, mapping style, Fourier transform (when applicable), show curve details on plot; write curve details or data to file
- Legends
-
Hide, change box type, legend settings
- Geometries (shapes)
-
Change line and fill color, delete, edit geometry settings. For polylines, you may also extract data along the line.
- Text
-
Change color, cut, copy, delete, align(left, right, center, top, bottom), text settings.

When working with zones, slices, and iso-surfaces, a context toolbar appears above the context menu. This toolbar allows you to turn on or off the grid, contour, vector, shade, edge, and translucency layers for the selected object(s) by clicking the icons. (Iso-surfaces do not have vector or edge layers.) Additionally, you may adjust frequently-used style settings for each layer using the drop-down menu to the right of each icon, for example selecting a color for the grid (or choosing a variable by which to color it).

A different context toolbar appears when you right-click a line in XY or polar line plots. This toolbar allows you to turn on or off the line, symbol, and error bars for the selected line map by clicking the icons. You can also adjust the attributes of these (for example, line color, symbol shape, or error variable) using drop-down menus to the right of each icon.
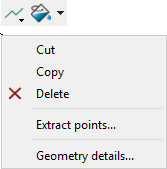
When a geometry object is right-clicked, the Geometry context menu appears. This menu allows you to Cut, Copy, Delete the object as well as adjust the line and fill attributes. When multiple geometries are selected, the Alignment of the objects can be adjusted as well.
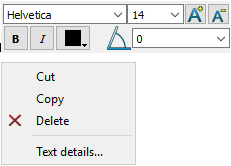
Right-clicking on a Text object brings up the Text context menu. This menu allows you to Cut, Copy, Delete the object as well as change the alignment or open the Text details dialog. You can also adjust the text attributes such as bold, italics, color, and text angle.
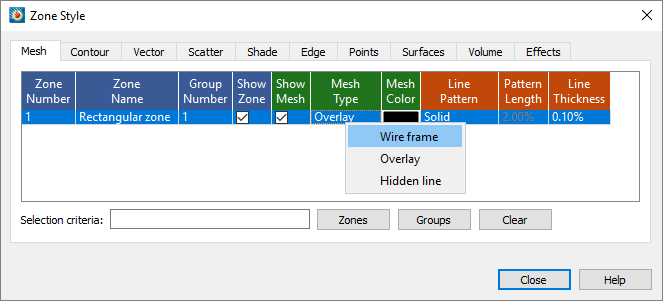
In some places, such as in the Mapping Style and Zone Style dialogs, right-clicking is the primary way to alter the displayed data.
| The right mouse button is also used for translating (moving) the plot. This doesn’t conflict with its use for context menus. The context menu appears when you right-click without moving the mouse; dragging with the right mouse button performs the translation operation. |
Sidebars
Tecplot 360’s three main sidebars provide easy access to frequently-used functionality:
- Plot Sidebar
-
Includes controls for manipulating the appearance of your plot.
- Pages Sidebar
-
A list of the pages currently open, allowing you to switch between them, and to create, rename, and delete pages.
- Frames Sidebar
-
A list of the frames in the current page, allowing you to easily manage their order and other characteristics.
Initially, the Plot and Pages sidebars appear "docked" on the left side of the workspace—attached to the left side of the plot area. The Frames sidebar is initially hidden, but appears on the left side of the workspace when enabled using the menu.
Any visible sidebar may be moved to the right side of the workspace, or even dragged out of the workspace entirely (for example, to move it to another display) by dragging its title bar.
When more than one sidebar is docked to the same side of the workspace, they can be combined in two ways:
- Tabbed panels
-
Only one sidebar is visible at a time; tabs appear at the bottom of the sidebar are to choose which sidebar you want to use. This is the default mode; the screen image in Interface shows how this looks.
- Sharing space vertically
-
Both sidebars are visible at the same time. You can drag the boundary between the two sidebars to adjust the proportion of the space used by each.
Which style is used depends on where you dock the second sidebar: drag to the top or bottom of the already-docked sidebar to split the area, or drag to the middle to combine them and use tabs to switch between them.
Additional sidebars are available for certain other features throughout Tecplot 360. For example, the Quick Macro Panel is a sidebar that initially appears docked to the right side of the workspace. Like the other sidebars, it may be "torn off" from the window or share space with another sidebar. The Probe Sidebar is another; it displays the results of probe operations.
Any sidebar may be closed if it is in your way. To open it again, choose the desired sidebar from the appropriate menu, or right-click any sidebar or the menu bar and choose the desired sidebar from the context menu.
| Sidebar | Menu Command |
|---|---|
Plot |
View→Plot sidebar |
Pages |
View→Pages sidebar |
Frames |
View→Frames sidebar |
Probe |
Data→Probe sidebar |
Quick Macro Panel |
Scripting→Quick Macros |
Plot Sidebar
The controls available in the Plot sidebar depend on the plot type of the active frame. For 2D or 3D Cartesian plot types, you can show or hide zone layers, and zone effects, and derived objects from your plot. For line plots (XY and polar) you can show or hide mapping layers.
You can open the Plot sidebar from the menu if it is not currently visible. To customize your plot, simply:
-
Select a plot type from the Plot Types drop-down menu.
-
Use the toggle switches to add or subtract Map Layers/Zone Layers, or Zone Effects, or Derived Objects. Use the / dialogs to further customize your plot by showing or hiding zones in specific plot layers/mappings, changing the way a zone or group of zones is displayed, or changing various plot settings.
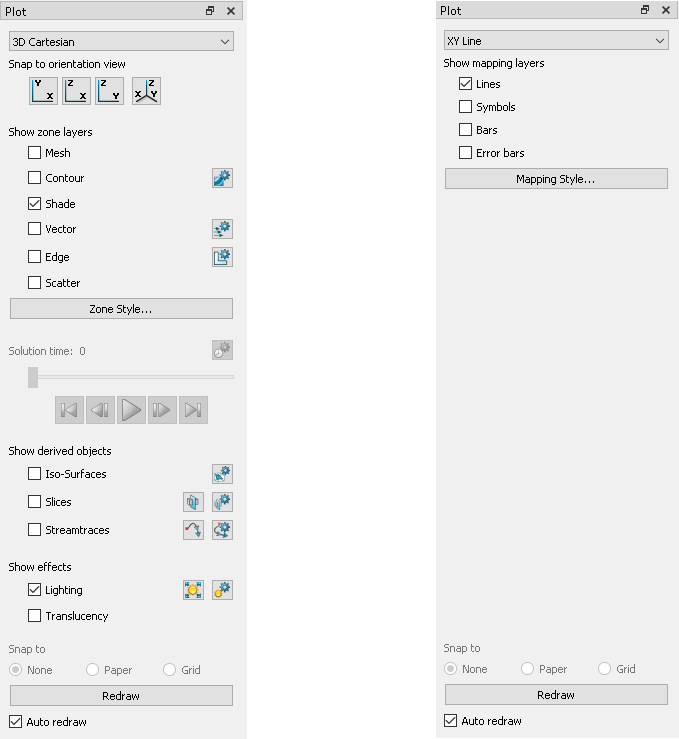
Plot Types
The Plot Type, combined with a frame’s dataset, active layers, and their associated attributes, define a plot. Each plot type represents one view of the data. There are five plot types available:
- 3D Cartesian
-
3D plots of surfaces and volumes.
- 2D Cartesian
-
2D plots of surfaces, where the vertical and horizontal axis are both dependent variables (i.e. and , where is another variable).
- XY Line
-
Line plots of independent and dependent variables on a Cartesian grid. Typically the horizontal axis (x) is the independent variable and the y-axis a dependent variable, .
- Polar Line
-
Line plots of independent and dependent variables on a polar grid.
- Sketch
-
Create plots without data such as drawings, flow charts, and viewgraphs.
Zone Layers
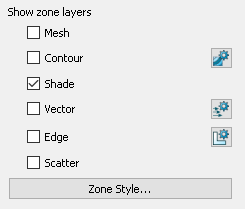
A layer is a way of representing a frame’s dataset. The complete plot is the sum of all the active layers, axes, text, geometries, and other elements added to the data plotted in the layers. The six zone layers for 2D and 3D Cartesian plot types are:
- Mesh
-
A grid of lines connecting the data points within each zone.
- Contour
-
Iso-valued lines, the region between these lines can be set to contour flooding.
- Shade
-
Used to tint each zone with a solid color, or to add light-source shading to a 3D surface plot. Used in conjunction with the Lighting zone effect you may set Paneled, Smooth, or Smooth with creases shading. Used in conjunction with the Translucency zone effect, you may create a translucent surface for your plot.
- Vector
-
The direction and magnitude of vector quantities.
- Edge
-
Zone edges and creases for ordered data and creases for finite element data.
- Scatter
-
Symbols at the location of each data point.
Zone Style
Select the button to launch the dialog. The dialog is used to customize the zone layers that you have added to your plot. Refer to the chapter for each zone layer for details on working with the dialog.
Transient Controls
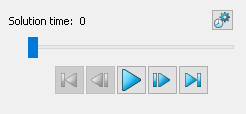
When working with transient data, simply press the Play  button in the Plot sidebar to animate over time. The active frame will be animated from
the Current Solution Time to the last time step. You may also drag the slider to change
the Current Solution Time of your plot.
The Animation Controls have the following functions:

-
Jumps to the Starting Value. (Keyboard: Home)

-
Jumps toward the Starting Value by one step. (Keyboard: Left arrow)

-
Runs the animation as specified by the 'Operation' field of the dialog. The Play button becomes a Pause button while the animation is playing. (Keyboard: Space bar)

-
Jumps toward the Ending Value by one step. (Keyboard: Right arrow)

-
Jumps to the Ending Value. (Keyboard: End)
Use the  button to launch the dialog. See Time Aware for more information on Time controls and
the dialog.
Derived Objects
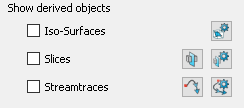
For Cartesian plot types (2D and 3D): Toggle-on Iso-surfaces, Slices, or Streamtraces
from the Plot sidebar to add any or all of these elements to your plot. For
convenience, the tool buttons for Slices and Streamtraces also appear here. The
dialogs for each of the derived objects can be accessed via their
respective buttons ( ,
,
 ,
,  ).
Refer to Iso-Surfaces, Slices, or Streamtraces for details on working with these
objects.
Zone Effects
For 3D Cartesian plot types, use the Plot sidebar to turn lighting and translucency on or off. Only shaded and flooded contour surface plot types are affected. Refer to Shade Layer and Translucency for additional information.
Map Layers
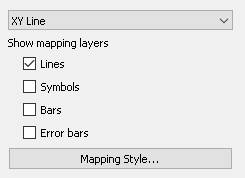
A layer is a way of representing a frame’s dataset. The complete plot is the sum of all the active layers, axes, text, geometries, and other elements added to the data plotted in the layers.
The four XY Line map layers are:
- Lines
-
Plots a pair of variables, X and Y, as a set of line segments or a fitted curve.
- Symbols
-
A pair of variables, X and Y, as individual data points represented by a symbol you specify.
- Bars
-
A pair of variables, X and Y, as a horizontal or vertical bar chart.
- Error Bars
-
Allows you to add error bars to your plot.
The two map layers for Polar Line are:
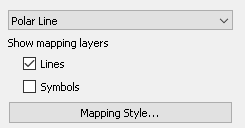
- Lines
-
A pair of variables, X and Y, as a set of line segments or a fitted curve.
- Symbols
-
A pair of variables, e.g. X and Y, as individual data points represented by a symbol you specify.
Select the button to launch the dialog. The dialog allows you to customize the style settings for each of the plot layers and specify the points to plot. The pages of the dialog are discussed in detail in XY and Polar Line Plots.
Snap Modes
Snap modes allow you to easily place objects at convenient reference points, either on the axis grid or on the workspace paper. Most movable objects (including text, images, geometries, frames, axes, legends, and the orientation axis) can be snapped. Data points in zones and line maps are also subject to snap modes when being adjusted.
The snap controls in the Plot sidebar become available when such objects are selected
using the Selector  or the Adjustor
  or, in the
case of text and geometries, when they are being placed initially using the appropriate
tool.
- None
-
No snapping is performed; objects may be positioned freely.
- Snap to Grid
-
Constrain object movement to whole steps on the axis grid as defined in the Grid page of the Axis Details dialog (); see Axis Grid Options. This can be useful for aligning objects with points of interest in a plot.
- Snap to Paper
-
Constrain object movement to whole steps on the paper’s grid as defined in the Ruler/Grid dialog (); see Grid and Ruler Set-Up. This can be useful for positioning frames precisely for printing, or for absolute positioning of text, geometries, and other plot elements.
One or the other of the snap modes may be unavailable depending on the plot type or the kind of object being moved. For example, a frame cannot be aligned to the grid because it contains the grid, so the Grid snap mode is disabled when moving a frame.
Redraw Buttons
The redraw buttons allow you to keep your plot up to date: Clicking the middle mouse button redraws the current active frame.
Auto Redraw
- Use Auto Redraw
-
When selected, the plot will be automatically redrawn, whenever style or data changes. Some users prefer to turn this option off while setting multiple style settings and then manually press the or button on the Plot sidebar to see a full plot.
| You can interrupt an auto-redraw at any time with a mouse click or key press. |
Pages Sidebar
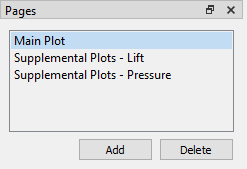
In Tecplot 360, a page is a container for any number of frames, each of which is a container for a plot. A layout can contain any number of pages (although many layouts contain only one). You can use the Pages sidebar to see the pages in the current layout, to choose which page is displayed in the workspace, and to create, rename, and delete pages.
The Pages sidebar may be opened from the View menu if it is not currently visible. In the Pages sidebar, you may:
-
Click to add a new page. The new page is initially named "Untitled."
-
Click a page to view it in the workspace. Only one page is visible at a time.
-
Double-click a page to specify or change its name. The name becomes editable in the sidebar; simply type the new name, then press Enter.
-
Click to delete the active page.
| The , , and commands on the Edit menu can be used to move or copy frames between pages. Click a frame border to select it, copy or cut it to the clipboard, then switch to the destination page using the Pages sidebar and paste it. |
Frames Sidebar
The Frames sidebar allows you to manage the frames on the current page, including activating and ordering them, which is particularly useful when you have many overlapping frames on a page. It is initially hidden, but may be opened from the menu. See Frames for more information on working with frames.
Toolbar
Each of the tools represented in the Toolbar changes the mouse mode and allows you to interactively edit your plot.

The Toolbar is actually up to four separate toolbars, with buttons grouped by function.
- File toolbar
-
Buttons for dealing with files (hidden by default)
- View toolbar
-
Buttons for manipulating the view
- Data toolbar
-
Buttons for working with data
- Insert toolbar
-
Buttons that insert objects into the workspace.
In the default toolbar configuration, shown above, the toolbars appear next to each other. Each, however, can be moved independently to any edge of the workspace by grabbing the drag handle at the left edge of the toolbar. To hide or show a toolbar, right-click the menu bar and choose the desired toolbar.
Selector Tool
 Use the Selector tool to select objects in your
workspace. To select multiple objects, hold down Shift while clicking the second and
subsequent objects. The selected objects can then be moved (translated) using the
Selector tool itself.
The following kinds of objects can be moved (translated) using the Selector tool:
-
frames
-
axis grid area
-
text
-
geometries
-
contour labels
-
streamtraces
-
streamtrace termination line
-
legends
-
3D frame axis
To select an object and open that object’s attributes dialog, double-click any object
Adjustor Tool
 Use the Adjustor tool to perform any of the
following modifications to your plot and data:
-
Location of individual or groups of data points in the grid.
-
Values of the dataset variables at a particular point.
-
Length or placement of individual axes (2D Cartesian and XY Line plot types only).
-
Spacing between an axis label and its associated axis (2D Cartesian and XY Line plot types only).
-
The points in a polyline (and therefore its shape).
The Adjustor tool behaves like the Selector tool when you click objects other than those listed above. For example, if you click a rectangular geometry, the entire object is selected, since the Adjustor tool has no special functionality with a rectangular geometry. When adjusting a polyline, click close to the points in the polyline to avoid the entire object being selected.
| The Adjustor tool can alter your data. Be sure you want to use the Adjustor tool before dragging points in the data region. |
Click a point or object to select it. To select multiple points, you can hold Shift while clicking additional points after the first. In line plots, you can select points from only one mapping at a time.
Once you have selected all desired points, move the Adjustor over the selection handles of one of the points, then click-and-drag to the desired location of the first data point. The other selected points will move as a unit with respect to the chosen data point, maintaining their relative positions.
| For XY Line plots, if several mappings are using the same data for one of the variables, adjusting one of the mappings will result in simultaneous adjustments to the others. You can avoid this by pressing the H or V key on your keyboard while adjusting the selected point. The H and V keys restrict the adjustment to the horizontal and vertical directions, respectively. |
Zoom Tool
 Zoom into or away from the plot. Geometries zoom with
the plot; however, text does not.
When a mouse-click occurs (without dragging), the zooming is centered at the location of your click.
There are two zoom modes: plot zooming and paper zooming.
- For plot zooming
-
drag the magnifying glass cursor to draw a box around the region that you want to fit into the frame. The box may be larger than the frame. Making the box larger than the frame zooms away from the plot. The region within the view box will be resized to fit into the frame.
| If (located in the Sidebar) is selected, you cannot make the zoom box larger than the grid area. |
To return to the previous view, choose the menu (Control-L). To restore the original 2D view, choose (Ctrl-E) or (Ctrl-F).
The results of plot zooming for the 2D plot type are dependent upon the axis mode selected in the dialog (accessed via the menu):
- 2D Independent Axis Mode
-
Allows the selected region to expand to exactly fit in the frame. The axes are rescaled independently to fit the zoom box.
- 2D Dependent Axis Mode
-
In dependent mode, the axes are not fit perfectly to the zoom box. The longest dimension from the zoom box is applied to an associated axis, and the other axis is resized according to the dependency relation.
- For paper zooming
-
Shift-drag the magnifying glass cursor to draw a box about the region that you want to magnify. The plot is resized so that the longest dimension of the zoom box fits into the workspace. You can fit all frames to the workspace by using on the menu.
|
Clicking anywhere in your plot while the zoom tool is active will center the zoom around your click. Alternatively, Control-click centers the plot on the point that was clicked and zooms out. Use the center mouse button and drag (or hold down the scroll wheel and drag) to interactively zoom into or out of the plot. |
- 3D mouse
-
Tecplot 360 also supports a 3D mouse, an input device that allows zooming (and translation and rotation) of 3D plots with a touch. You do not need to activate the Zoom tool to use the 3D mouse for zooming. Simply push the mouse’s cap toward or away from you to zoom. Hold the Alt key while zooming with the 3D mouse to switch the zoom method (see Input Devices for details).
Avoid tilting the mouse cap, as this may induce unintended rotation.
Translate Tool
Use the Translate tool to translate data within a frame or the paper within the workspace.
While in Translate mode, drag the cursor to move the data with respect to the frame, or Shift-drag to move the paper with respect to the workspace.
| You may translate even when some other tool is selected by dragging with the right mouse button. |
While the Translate tool is active, you can zoom your image by pressing + to magnify, - to shrink. If you are Shift-dragging to move the paper, the rescale buttons + and - will magnify or shrink the paper, as long as you have the mouse button depressed.
- 3D mouse
-
Tecplot 360 also supports a 3D mouse, an input device that can be used to translate 3D plots at any time with just a touch, regardless of the tool or mode selected.
-
Pull the mouse’s cap up or push it down to translate up or down on the screen.
-
Move the mouse’s cap left or right to translate left or right on the screen.
Avoid tilting or rotating the mouse when using these motions to avoid rotating the plot.
-
Three-dimensional Rotation
There are six 3D rotation mouse modes:
- Spherical

-
Drag the mouse horizontally to rotate about the Z-axis; drag the mouse vertically to control the tilt of the Z-axis.
- Rollerball

-
Drag the mouse in a direction to move with respect to the current orientation on the screen. In this mode, your mouse acts much like a rollerball.
- Twist

-
Drag the mouse clockwise around the image to rotate the image clockwise. Drag the mouse counterclockwise around the image to rotate the image counterclockwise.
- X-axis

-
Drag the mouse to rotate the image about the X-axis.
- Y-axis

-
Drag the mouse to rotate the image about the Y-axis.
- Z-axis

-
Drag the mouse to rotate the image about the Z-axis.
Once you have selected a rotation mouse mode, you can quickly switch to any of the others using the following keyboard shortcuts:
Drag |
Rotate about the defined rotation origin with your current Rotate tool. |
Alt-drag |
Rotate about the viewer position using your current Rotate tool. |
Middle-click-and-drag/Alt-right click-and-drag |
Smooth zoom in and out of the data. |
Right-click-and-drag |
Translate the data. |
Control-right-click-and-drag or Command-right-click-and-drag (Mac) |
This option can be used without first selecting a rotation mouse mode. Simply hover over your intended point of origin, and then Control-right-click-and-drag to translate the image. |
- 3D mouse
-
Tecplot 360 also supports a 3D mouse, an input device that can be used to rotate 3D plots at any time regardless of the tool or mode selected. The axis of rotation is relative to the screen rather than to the data.
-
Tilt the mouse’s cap forward or backward to rotate around the screen’s X axis, as if rolling toward or away from you.
-
Twist the mouse’s cap clockwise or counterclockwise to rotate around the screen’s Y axis, as if on a lazy susan.
-
Tilt the mouse’s cap left or right to rotate around the screen’s Z axis, like the hands of a clock.
-
Slice Tool
 Use the Slicing tool to control your slice(s)
interactively.
The following keyboard/mouse options are available when the Slice tool is active:
+ |
Primary Slices, Start End Slices Active - Turn on intermediate slices (if not already active) and adds a slice. Primary Slices active [ONLY] - Turns on Start/End Slices and adds a slice. Start/End Slices active [ONLY] - Turns on Start/End Slices and adds a slice. |
- |
Primary Slices, Start End Slices Active - Removes start and end slices. Primary Slices active [ONLY] - Removes the primary slice. Start/End Slices active [ONLY] - Removes the Start and End Slices. |
Click/Drag |
Updates the position of the primary slice (if active). If only start and end slices are visible, click updates the position of the starting slice. |
Alt-click/Alt-drag |
Determine the XYZ-location by ignoring zones and looking only at derived volume objects (streamtraces, slices, iso-surfaces). |
Shift-click |
Switches from one Primary slice to Start/End Slices by adding a slice. |
Shift-drag |
Move the start or end slice (whichever is closest to the initial click location). Show Start/End Slices is activated, if necessary. |
I, J, K (ordered zones only) |
Switch to slicing constant I, J, or K-planes respectively. |
X, Y, Z |
Switch to slicing constant X, Y, or Z-planes respectively. |
1-8 |
Numbers one through eight switch to the corresponding slice group. |
Add Streamtrace
 Select the Add Streamtrace tool to add a
streamtrace interactively by clicking anywhere in your plot. Select the number of
streamtraces to include with each click (rake) using 1-9 on the keyboard.
|
Keyboard Shortcuts
|
Refer to Streamtraces for more information.
Streamtrace Termination Line
 Select the Add Streamtrace Termination
Line tool to add a streamtrace termination line interactively.
To draw a Streamtrace Termination Line:
-
Move the cursor into the data region.
-
Click once at the desired starting point for the line.
-
Click again at each desired break point.
-
When the polyline is complete, double-click on the last point of the polyline, or press ESC on your keyboard.
-
The drawn polyline ends any streamtraces that pass through it.
Add Contour Level
 Select the Add Contour Level tool to add
a contour level by clicking anywhere in the active data region. A new contour level,
passing through the specified location, is calculated and drawn.
Alt-click |
Place a contour line by probing on a streamtrace, slice, or iso-surface. |
Click |
Place a contour line. |
Control-Click |
Replace the nearest contour line with a new line. |
Drag |
Move the new contour line. |
- |
Switch to the tool. |
The following keyboard and mouse shortcuts are related to the tool.
Delete Contour Level
 Select the
tool to delete a contour level by clicking anywhere in the active data region. The
contour line nearest the specified location is deleted.
| Use the + key to switch to the tool and the - key to switch back to the tool. |
Add Contour Labels
 Select the tool
to switch to the Contour Label mode, enabling you to add a contour label by clicking
anywhere in the active data region.
A contour label is added to the plot at the specified location; its level or value information is taken from the nearest contour line. This allows you to place labels at a slight offset from the lines they label.
| The Contour type must be lines or lines and flood in order for this tool to be active. You can set the contour type on the Contour page of the dialog. |
Probe Tool
 Select the tool to probe for
values of the dataset’s variables at a particular point.
To obtain interpolated values of the dataset variables at the specified location, click at any point in the data region.
To obtain exact values for the data point nearest the specified location, Control-click at the desired location.
| For XY plots, when you move into the axis grid area, the cursor cross hair is augmented by a vertical or horizontal line, depending on whether you are probing along the X-axis or the Y-axis. You can change the axis to probe simply by pressing X to probe the X-axis or Y to probe the Y-axis. |
Specify Equations
 Opens the Specify Equations dialog. See
Data Alteration through Equations.
Insert Text
 Select the Add Text tool to add text to any frame.
When this tool is in use, the Snap To buttons in the Plot sidebar become available to allow you to easily align your text with features of your plot.
Insert Image/Georeferenced Image
 Select the Insert Image tool to insert an
image or Georeferenced image to the plot.
See Images and Georeferenced Images for more information.
Insert Geometries
Use the geometry buttons to insert geometries into your plot. When these tools are in use, the Snap To buttons in the Plot sidebar become available to allow you to easily align your geometry with features of your plot.
-
 Polylines
 -
 Squares
 -
 Rectangles
 -
 Circle
 -
 Ellipse
Create New Frame
 Select the Create Frame tool to create a
new frame.
To add a frame:
-
Click once in the workspace to anchor one corner of the frame.
-
Drag the diagonal corner until the frame is the desired size and shape.
| If you have data loaded before you create a new frame, you can attach the existing dataset to the new frame by changing the plot type. |
Status Line
The status line appears along the bottom of the Tecplot 360 window to provide a progress bar and other information when Tecplot 360 computes lengthy calculations. Other "hints," such as coordinates and tips for using the currently-selected tool, also appear here.
Tecplot 360 Workspace
In the Tecplot 360 workspace, you can create sketches and plots. You create each sketch or plot within a frame. Each visible measure of the workspace is called a page. The current state of the workspace, including the sizing and positioning of frames, the number and contents of pages, the location of the data files used by each frame, and all current attributes for all frames, makes up a layout. By default, the workspace displays a representation of where the paper plots are drawn, as well as a reference grid and rulers. The frame most recently selected is called the active frame.
You can include multiple pages in your layout, each of which can contain multiple frames. Use the Pages Sidebar (open it from the View menu if it’s not visible) to create and manage pages.
Getting Help
Tecplot 360 features a fully integrated Help system. Detailed help is accessible by:
-
Selecting from the menu.
-
Clicking the button in any dialog.
The dialog supports text search, has hypertext links, and provides detailed information on all menus and dialogs.
You may also send an e-mail to support@tecplot.com with your questions.