Mesh Layer and Edge Layer
When working with two or three-dimensional field plots, Tecplot 360 allows you to interactively add or subtract any combination of plot layers. These layers can be applied to any set of zones in the active data set. This chapter discusses the Mesh Layer and the Edge Layer.
Mesh Layer
Toggle-on "Mesh" in the Plot sidebar to add a mesh layer to your plot. The mesh plot layer displays the lines connecting neighboring data points within a zone. For I-ordered data, the mesh is a single line connecting all of the points in order of increasing I-index. For IJ-ordered data, the mesh consists of two families of lines connecting adjacent data points of increasing I-index and increasing J-index. For IJK-ordered data, the mesh consists of three families of lines, one connecting points of increasing I-index, one connecting points of increasing J-index, and one connecting points of increasing K-index. For finite element zones, the mesh is a plot of every edge of all of the elements that are defined by the connectivity list for the node points. See Data Structure for an in-depth description of ordered (IJK) and finite element data structures.
Mesh Layer Modification

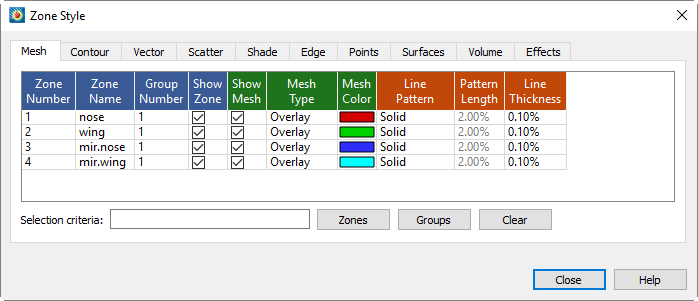
Once you have loaded your data, you can modify your mesh plot attributes using the Mesh page of the dialog (accessed via the Plot sidebar or ). As discussed in Field Plot Modification and the Zone Style Dialog, the changes made using the first four (blue) columns apply to the entire plot, while changes in the other columns apply to the active plot layer.
| In order for the changes made on the Mesh page to be visible in your plot, the Mesh layer must be turned on. You can turn on the Mesh layer using the checkbox in the Plot sidebar. |
- Show Mesh
-
Checkbox that determines whether the mesh is visible for each active zone.
- Mesh Type
-
Right-click to choose wire frame, overlay, or hidden line. See Mesh Types below.
- Mesh Color
-
Right-click to choose the mesh color using the Color Chooser.
- Line Pattern
-
Right-click to choose the line pattern for the mesh.
- Pattern Length
-
Right-click to choose the pattern length in percentage of frame height. You may choose a preset pattern length or enter your own.
- Line Thickness
-
Right-click to choose the mesh line thickness. You may choose a predefined setting or enter your own.
| For information on using the controls at the bottom of the Zone Style dialog to select zones by name, see the description of these at the end of Field Plot Modification and the Zone Style Dialog. |
Mesh Types
Tecplot 360 has three distinct mesh types:
- Wire Frame
-
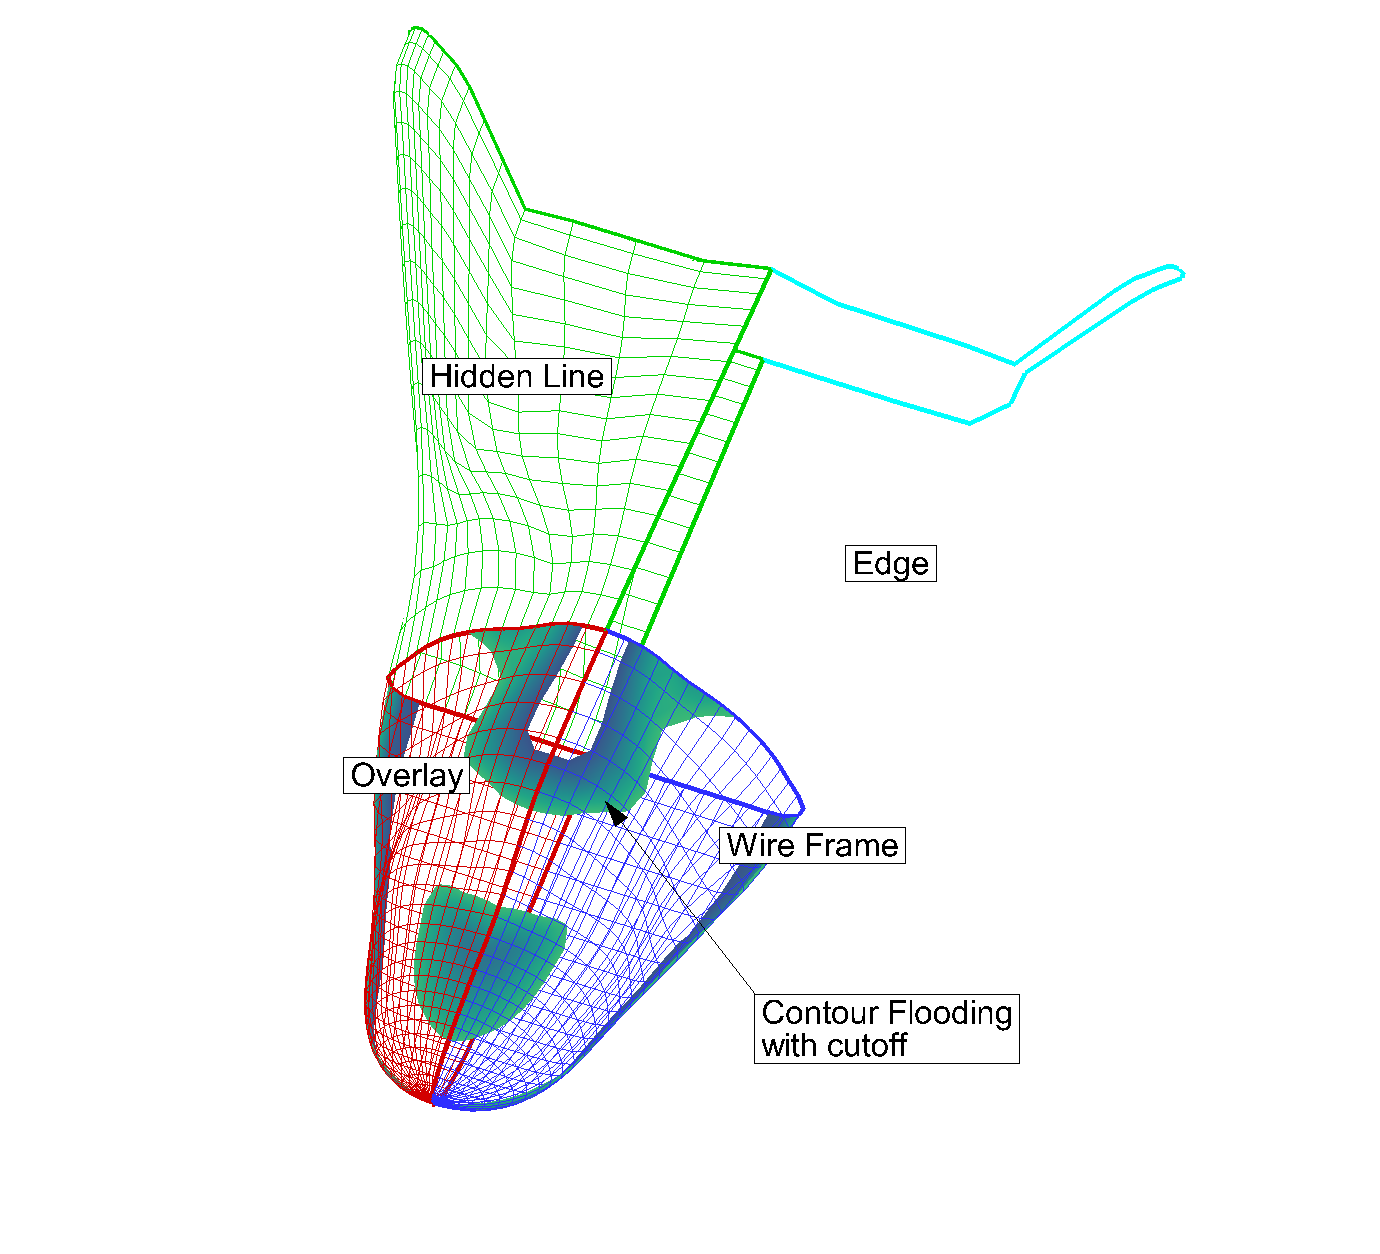
Wire frame meshes are drawn below any other zone layers on the same zone. In 3D Cartesian plots, no hidden lines are removed. For 3D volume zones (finite element volume or IJK-ordered), the full 3D mesh (consisting of all the connecting lines between data points) is not generally drawn because the sheer number of lines would make it confusing. The mesh drawn will depend upon your choice of "Surfaces to Plot" on the Surfaces page of the dialog. See Surfaces for further details. By default, only the mesh on exposed cell faces is shown.
- Overlay
-
Similar to Wire Frame, mesh lines are drawn over all other zone layers except for vectors and scatter symbols. In 3D Cartesian plots, the area behind the cells of the plot is still visible (unless another plot type such as contour flooding prevents this). As with Wire Frame, the visibility of the mesh is dependent upon your choice of "Surfaces to Plot" on the Surfaces page of the dialog. See Surfaces for further details.
- Hidden Line
-
Similar to Overlay, except hidden lines are removed from behind the mesh. In effect, the cells (elements) of the mesh are opaque. Surfaces and lines that are hidden behind another surface are removed from the plot. For 3D volume zones, using this plot type obscures everything inside the zone. If you choose this option for 3D volume zones, then choosing to plot every surface (using the Surfaces page of the dialog) has the same effect as plotting only exposed cell faces, but is much slower.
| The opaque surfaces created by Hidden Line are not affected by the Lighting Zone effect (there is no light source shading). However, it is affected by translucency. |
Figure 1 shows the available mesh plot types, along with the effects of choosing Overlay and Wire Frame in combination with contour flooding.

Edge Layer
An edge plot layer displays the connections of the outer lines (IJ-ordered zones), finite element surface zones, or planes (IJK-ordered zones). The Edge layer allows you to display the edges (creases and borders) of your data. Zone edges exist only for ordered zones or 2D finite element zones. Three-dimensional finite element zones do not have boundaries.
Edge Layer Modification
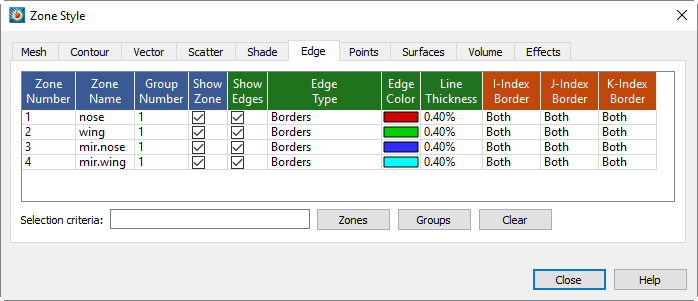
You can control the following attributes from the Edge page of the dialog:

| In order for the changes made on the Edge page to be visible in your plot, the Edge layer must be turned on. You can turn on the Edge layer using the checkbox in the Plot sidebar. |
- Show Edges
-
Checkbox that determines whether the edges are visible for each active zone.
- Edge Type
-
Right-click to choose borders and/or creases. See Edge Types below.
- Edge Color
-
Right-click to choose the edge color using the Color Chooser.
- Line Thickness
-
Right-click to choose the edge line thickness. You may choose a predefined setting or enter your own.
- Index Borders
-
Right-click to choose whether to show the corresponding index border: None, Min Only, Max Only, or Both (Min and Max).
| For information on using the controls at the bottom of the Zone Style dialog to select zones by name, see the description of these at the end of Field Plot Modification and the Zone Style Dialog. |
Edge Types
There are two types of edges in Tecplot 360: creases and borders. An edge border is the boundary of a zone. An edge crease appears when the inside angle between two cells is less than a user-defined limit. The inside angle can range from 0-180 degrees (where 180 degrees indicates coplanar surfaces). The default inside angle for determining an edge crease is 135 degrees. You can change the crease angle by going to .
| For 2D plots, only edge borders are available, and for FE-volume zones, only edge creases are available. |
You can change the Edge Type using the Edge Type column on the Edge page of the dialog.
Edge Display
For IJ-ordered zones, the available edges are the lines I=1, I=IMax, J=1, and J=JMax.
When the Surfaces to Plot option is set to "Boundary Cell Faces", "Exposed Cell Faces", or "Every Surface" for IJK-ordered zones, the edges of the surface areas form a "box" that contains the data. Surfaces to Plot can be set on the Surfaces page of the dialog.
When the Surfaces to Plot option on the Surfaces page of the dialog is set to one of the planes options, such as I, J, or K-planes, for IJK-ordered zones the edges are the edges of each plane (I, J, or K-plane). By default, all available edges are drawn when the Edge layer is active. You can specify which of the available edges are plotted using the dialog.