Translucency and Lighting
You can enhance the shade and contour zone layers in 3D plots using Translucency and Lighting Effects (referred to collectively as the "3D zone effects"). The 3D zone effects for streamtraces, slices, and iso-surfaces can be activated using their respective dialogs (accessed via the menu or the Plot sidebar).
| For changes related to lighting or translucency to be visible, the desired effect must be toggled-on in the Show Effects section of the Plot sidebar. |
The Effects page of the dialog, which controls translucency and lighting effects, is shown below.
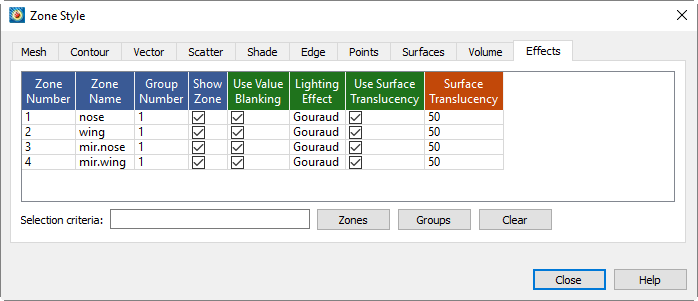
| For information on using the controls at the bottom of the Zone Style dialog to select zones by name, see the description of these at the end of Field Plot Modification and the Zone Style Dialog. |
Translucency
Turn on the translucency zone effect by toggling-on "translucency" in the Show Effects region of the Plot sidebar. When a zone is translucent, you may view objects inside or behind the zone. You can control the translucency of a zone using the Surface Translucency attribute in the Effects page of the dialog. The level of translucency may be set to a value between 1 (nearly solid) and 99 (nearly invisible). There are nine pre-set percentages ranging from 10 to 90. You may also use the "Enter" option to define a percentage of your own. An example of a translucent plot is shown in Figure 1.
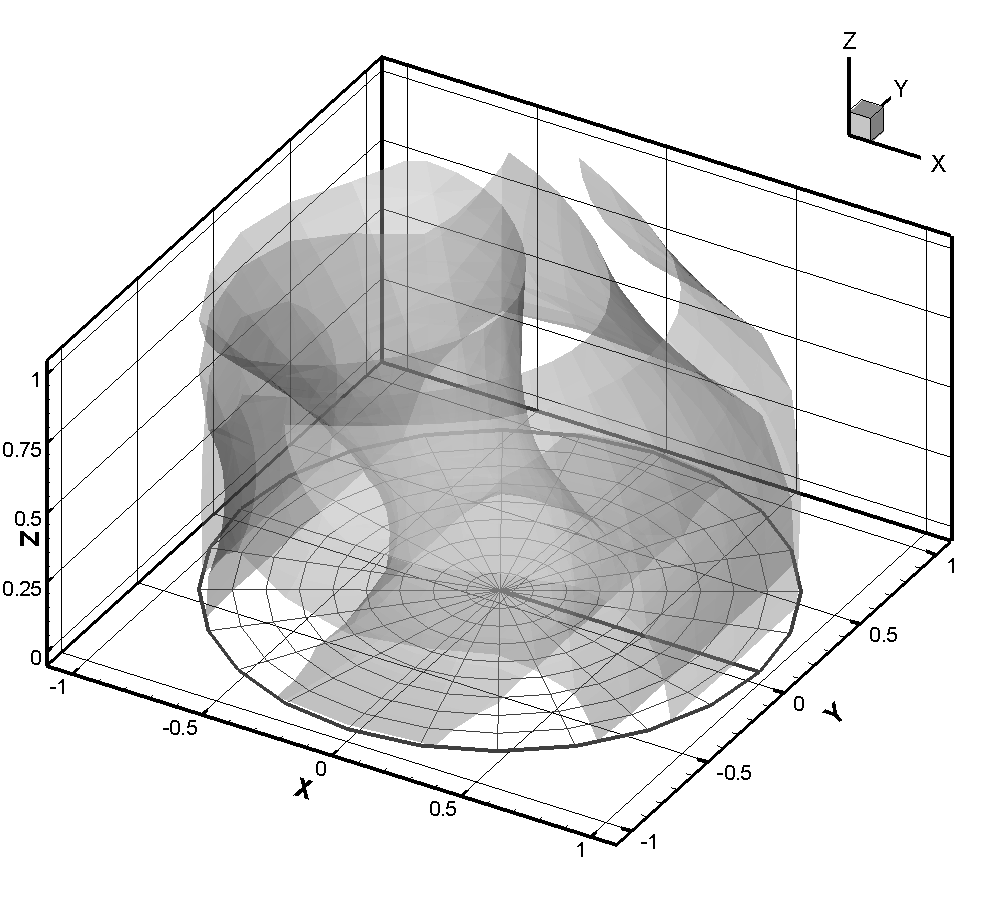
All surfaces in 3D Cartesian plots may be made translucent. A different translucency may be assigned to individual zones, and may also be assigned to derived objects such as slices, streamtrace ribbons or rods, and iso-surfaces. Use the Effects page of the dialog to change translucency settings for zones.
| The Translucency toggle-switch on the Plot sidebar applies only to zones, not to slices, streamtraces, or iso-surfaces. Translucency for those objects is controlled through their respective dialogs. |
| Translucency will only appear on your screen or in exported bitmap images. Translucent objects appear opaque in printouts and in exported vector images. See Hard Limits for more details. |
Blanking
The Use Value Blanking column on the Effects page of the Zone Style dialog enables you to constrain the display of each zone - that is, instruct whether each zone should obey or ignore any blanking settings present in the plot. To constrain a zone to obey value blanking, select the zone, toggle-on the Use Value Blanking checkbox. To learn more about blanking, see Blanking.
Lighting Effects
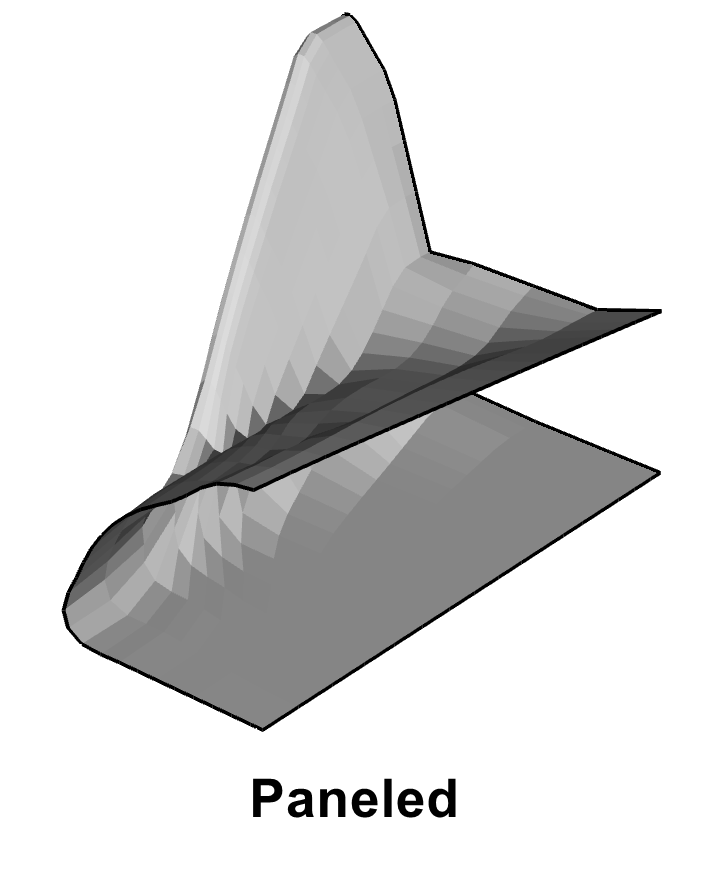
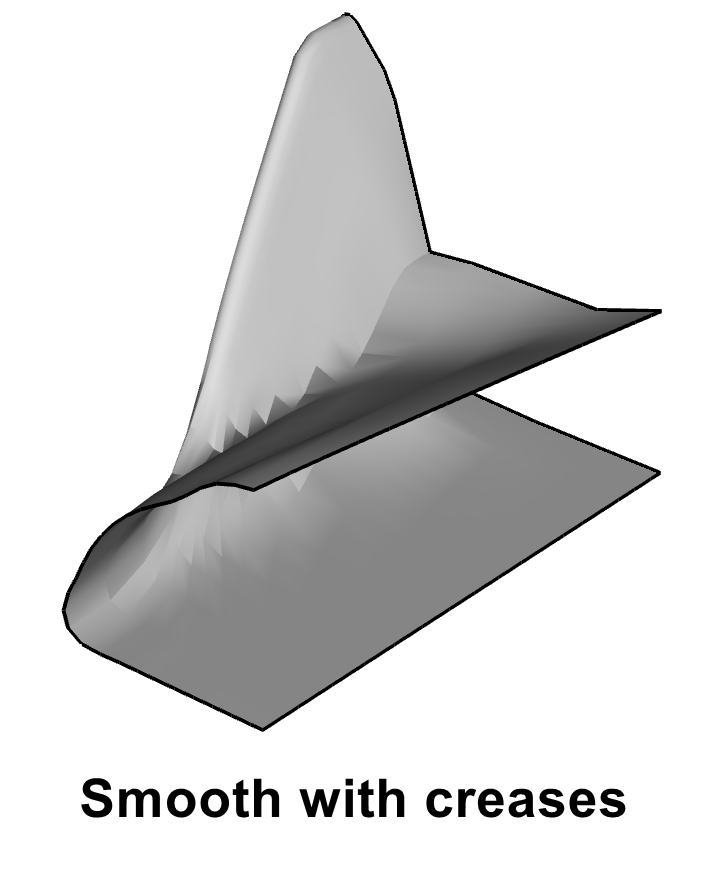
There are three types of lighting effects: Paneled, Smooth, and Smooth with creases. Right click in the Lighting Effect column of the Effects page to choose either Paneled, Smooth, or Smooth with creases for the selected zone(s).
- Paneled
-
Within each cell, the color assigned by shading or contour flooding is further tinted with a constant value across the cell based on the orientation of the cell relative to the 3D light source.
- Smooth
-
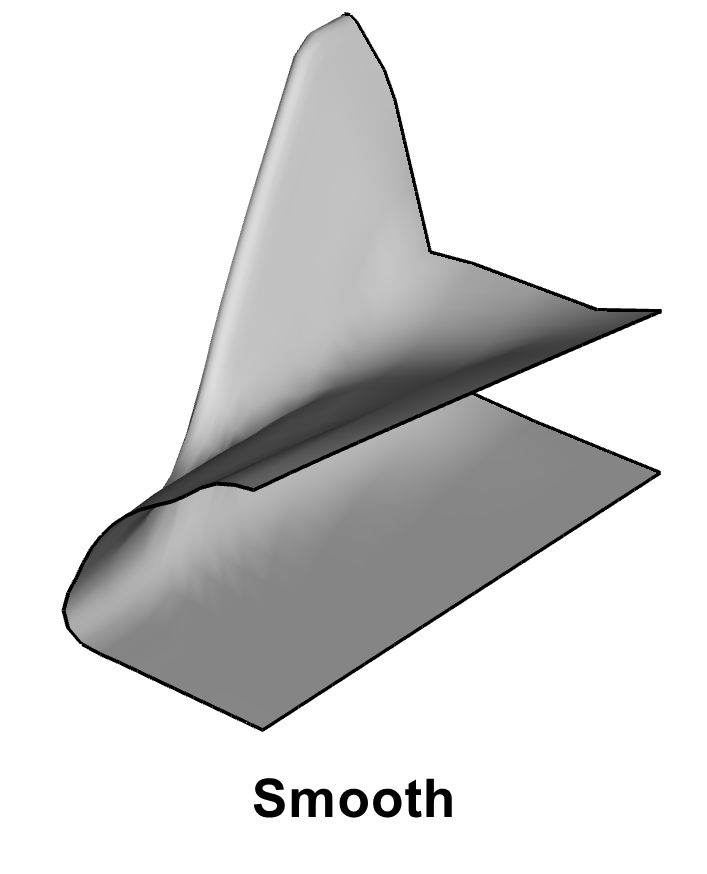
This plot type offers smoother, more continuous shading than Paneled shading. Smooth shading is not continuous across zone boundaries unless face neighbors are specified in the data.[1]
- Smooth with creases
-
Similar to Smooth shading but performs extra work to compute the angle between each cell edge and compares it to the minimum crease angle specified in the dialog. Cell edges with angles exceeding the minimum crease angle are rendered without smooth shading across those edges. This helps to bring out more details in the model.
If IJK-ordered data with Surfaces to Plot is set to Exposed Cell Faces, faces exposed by blanking will revert to Paneled shading.
Figure 2 shows these three shaded plot types
|
|
|
Three-dimensional Light Source
The light source is a point of light infinitely far from the drawing area. You can open
the dialog (shown below) by selecting the button ( ) next to Lighting
effect toggle the Plot sidebar, or by selecting "Light Source" from the
menu.
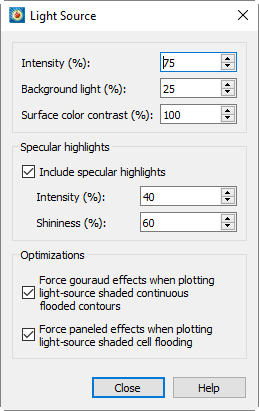
The dialog has the following options:
- Intensity (%)
-
Controls the amount of lighting effect produced by the directional light source. An intensity of 100 produces the maximum contrast between lit and unlit areas, and fully lit areas use the full surface color. Lesser values produce less contrast between lit and unlit areas, and fully lit areas use darker colors. An intensity of zero means the light source produces no contrast between lit and unlit areas, and all areas are black.
- Background Light (%)
-
Controls the amount of lighting effect applied to all objects regardless of the light source position. A background light of zero means that areas unlit by the directional light source receive no lighting at all and are entirely black, while areas lit by the directional light source get only the effect of that light. Larger values produce more lighting effect in areas not lit by the directional light source, making these areas show some of the surface color. A background light of 100 means that all areas are lit by the maximum amount, and areas unlit by the directional light source use the full surface color
| Intensity and Background Light are cumulative; they can add up to more than 100 and result in colors lightened beyond the base surface color. For example, reds will become pink and grays will become white. |
- Surface Color Contrast (%)
-
Controls the contrast of the color of the light source shaded surfaces before applying lighting effects. A surface color contrast of 100 means that light source shaded surfaces use the full surface color for applying lighting effects. Lesser values mean that the surface color is blended with progressively more white, making light source shaded surface colors lighter. A surface color contrast of zero means that colors are pure white before applying lighting effects (the plot will only be shades of gray).
- Include Specular Highlights
-
Turns on/off specular highlight for all light-source shaded objects in the plot, adding the semblance of reflected light to 3D shaded or flooded objects.
- Intensity (%)
-
Controls intensity of specular highlights (that is, the amount of reflected light, which controls the amount of whiteness at the peak of the highlight).
- Shininess
-
Controls shininess of specular highlight (that is, roughly the size and spread of specular highlight).
- Lighting Optimizations
-
Some combinations of lighting type and plot style may result in very slow redrawing of plots. Tecplot 360 provides lighting optimizations to avoid such conditions and instead draws a similar, but less computationally-intensive plot. These optimizations are on by default. Turn them off if you need to see the exact effects you have specified.
Moving the Light Source
You may move the light source interactively by clicking the  sun button next to the lighting effect toggle in the Plot sidebar. With the light
source tool active, click or drag in the workspace to position the light source in 3D
space. Choose another tool from the toolbar or sidebar to exit this mode.