Iso-Surfaces
An iso-surface displays a constant value of the contour variable as a
surface on your plot. Iso-surfaces require that the data set contains
volume zones (IJK-ordered, brick, tetrahedral, or polyhedral zones). You
can modify iso-surfaces in the dialog,
which you can access by selecting the
 button next to the Iso-surfaces toggle in the Plot sidebar. Or you can
open the dialog by selecting
"Iso-Surfaces" from the menu. Finally, you may
right-click an iso-surface in your plot and use the context menu and
toolbar to make quick changes to its settings.

The context toolbar appears above the context menu when you right-click an iso-surface. This toolbar allows you to turn on or off the grid, contour, shade, and translucency layers for the selected iso-surface(s). Additionally, you may adjust frequently-used style settings for each layer using the drop-down menu to the right of each, for example selecting a color for the grid (or choosing a variable by which to color it).
| To view changes made in the dialog in your plot, you must have "Iso-surfaces" toggled on in the Plot sidebar. |
Iso-Surface Groups
You can work with up to eight different iso-surface groups in Tecplot 360. Zone layers or other objects that reference the same group for
an attribute show the same plot style for that attribute. Each
iso-surface group has its own settings for the attributes set in the
dialog. Refer to the following sections
for details on each attribute. Choose the desired group number from 1-8
at the top of the dialog, then toggle-on the "Show Group n"
checkbox to include the corresponding iso-surface group in your plot.
| If you have added iso-surfaces to your plot, but cannot see them, go to the Volume page of the dialog and verify that Show Iso-surfaces is set to "Yes". Refer to Derived Volume Object Plotting for details. ls. |
Iso-Surface Definition
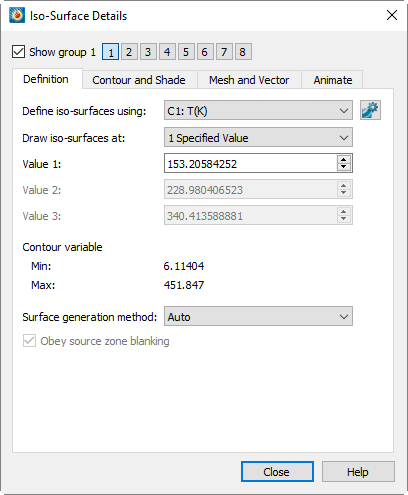
Use the Definition page of the to control Tecplot 360’s rendering of iso-surfaces. Tecplot 360 applies the attributes set on this page (and on every page of the dialog) to the Iso-Surface group selected at the top of the dialog next to the Show Group toggle.

The Definition page of the dialog includes the following controls:
- Show Group n
-
Select this check box to display iso-surfaces, where n can be 1-8.
- Define Iso-Surfaces using
-
Use this drop-down menu to select the desired contour group. Use the nearby
 button to display the
dialog, where you can define
contour groups. (See Contour & Multi-Coloring Details.)
 - Draw Iso-Surfaces at
-
Use this drop-down menu to have Tecplot 360 draw iso-surfaces at:
- Contour Group Levels
-
Go to the dialog (accessed with the
 button) to alter the Contour Levels. Refer to
Contour Levels and Color for details.
 - At Specified Value(s)
-
Specify up to three values of the contour variable at which to draw iso-surfaces.
- Contour Variable Min/Max
-
Indicates the minimum and maximum values of the contour variable. When the contour variable is calculated from subzone data, one or more of the values displayed may be estimates, which is indicated by next to the affected values.
- Surface Generation Method
-
Determines how the surface is generated.
-
Auto selects one of the surface generation algorithms best suited for the zones participating in the iso-surface generation. "All Polygons" is used if one or more of the participating zones is polytope, otherwise iso-surfaces use "All Triangles" unless the iso-surface is defined by a coordinate variable in which case "Allow Quads" is used.
-
Allow Quads can produce quads or triangles, and the resulting surface more closely resembles the shape of the volume cells from the source zone. Since the quads are not arbitrarily divided into triangles, no biases are introduced, and the resulting surface may appear smoother. This method is preferred when the source zone is FE-Brick or IJK-Ordered and the surface is aligned with the source cells.
-
All Triangles is an advanced algorithm that can handle complex saddle issues and guarantees that there will be no holes in the final surface. As the surface is composed entirely of triangles, it can be delivered more efficiently to the graphics hardware.
-
All Polygons is similar to the "All triangles" method except that all interior faces generated as a result of triangulation that are not part of the original mesh are eliminated. This preserves the original mesh of the source zones on the resulting iso-surface.
-
- Obey Source Zone Blanking
-
When active, iso-surfaces are generated for non-blanked regions only. When inactive, iso-surfaces are generated for blanked and unblanked regions. unblanked regions.
Iso-Surface Contour and Shade
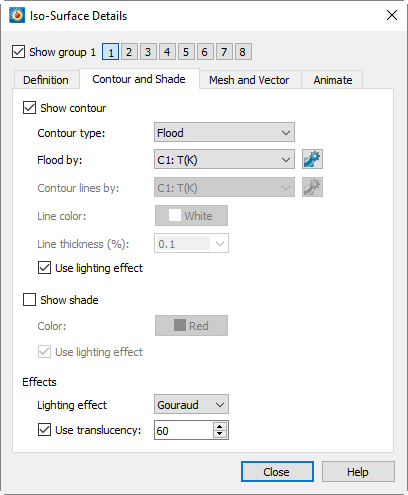
The Contour and Shade page of the dialog controls the contour and shade style settings for all iso-surfaces. (These styles act independently of the style assigned to zones by the dialog.) Tecplot 360 applies the attributes set on this page (and every page of the dialog) to the Iso-Surface group selected at the top of the dialog next to the Show Group toggle.

The Contour and Shade page of the dialog includes the following controls:
- Show Contour
-
Toggle-on "Show Contour" to display contours on iso-surfaces.
- Contour Type
-
Select the contour type from the drop-down. Lines, Flood, Lines and Flood, Average Cell Flood, and Primary Value Flood are available.
- Flood by
-
If you chose contour flooding, select the contour group by which to flood the contours, or select RGB flooding. Use the nearby
 button to bring up the dialog, where
you can define contour groups. (See Contour & Multi-Coloring Details.)
 - Contour Lines by
-
If you chose contour lines, select the contour group by which to draw lines. Use the nearby
 button to display the dialog to define
contour groups.
 - Line Color
-
If you chose contour lines, click Line Color to select a line color in the Color Chooser.
- Line Thickness
-
If you chose contour lines, select a contour line thickness from the drop-down menu, or enter your own number in the text field.
- Use Lighting Effect
-
Toggle-on to enable the lighting effect selected in the Light effect drop-down menu.
- Show Shade
-
Toggle-on to display shading on iso-surfaces.
- Color
-
Select a shade color using the Color Chooser.
- Use Lighting Effect
-
Toggle-on to enable the lighting effect selected in the Light effect drop-down menu.
- Effects
-
- Lighting Effect
-
Select between Paneled, Smooth, or Smooth with creases shading.
- Use Translucency
-
Toggle-on to enable the surface translucency text field, where you may set the surface translucency from 1 (nearly opaque) to 99 (nearly transparent). ly transparent).
Iso-Surface Mesh and Vector
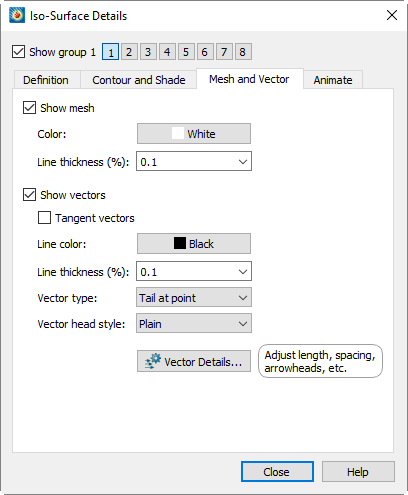
The Mesh and Vector page of the dialog controls the mesh and vector style settings for all iso-surfaces. (These styles act independently of the style assigned to zones by the dialog.) Tecplot 360 applies the attributes set on this page (and every page of the dialog) to the Iso-Surface group selected at the top of the dialog next to the Show Group toggle.

The Mesh and Vector page of the dialog includes the following controls:
- Show Mesh
-
Toggle-on "Show Mesh" to display the mesh on iso-surfaces.
- Color
-
Select a mesh color in the Color Chooser.
- Line Thickness
-
Select a mesh line thickness from the drop-down menu, or enter a number in the text field.
- Show Vectors
-
Toggle-on "Show vectors" to display the vectors on iso-surfaces.
- Tangent Vectors
-
Select to use tangent vectors for your iso-surfaces. See Vector Plot Modification for more information.
- Line Color
-
Choose the line color from the Color Chooser. Multi-color will color vectors based on the contour group variable. If no contour variable is set for the selected contour group, the dialog will appear.
- Line Thickness
-
Specify line thickness as a percentage of the frame height. You may enter a value in the text field, or choose one of the values in the drop-down.
- Vector Type
-
Use this drop-down to set the vector type for your iso-surfaces. Choose from Tail at Point, Head at Point, Anchor at Midpoint, and Head Only.
- Vector Head Style
-
Use this drop-down to set the vector head style for your iso-surfaces. Choose from Plain, Filled, and Hollow.
- Vector Details…
-
Opens the Vector Details dialog to adjust Vector length, spacing, arrowheads, etc. c.
Iso-Surface Animation
Refer to Iso-surfaces Animation.
Iso-Surface Extraction
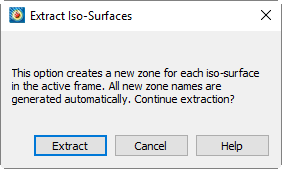
Normally, iso-surfaces are derived from the dataset "on the fly" and do not add any data to the dataset. To extract existing iso-surfaces to Tecplot zones, allowing you to retain them even if the contour variable is changed, select from the menu.

When you click Extract, one new iso-surface zone is created for each iso-surface visible in your plot. All of the variables in the dataset are interpolated from the 3D volume zones to the data points of the iso-surfaces.
Iso-surface zones are FE-surface quadrilateral element-type zones, regardless of the original 3D volume zone types. The mesh of the iso-surfaces is derived from the mesh of the original zones so that, in regions where the original mesh was coarse, the iso-surface mesh is coarse, and where the original mesh was fine, the iso-surface mesh is fine.
| After creating the new iso-surface zones, it is often a good idea to turn off or reconfigure the current settings for iso-surfaces because the new zones will occupy the same physical space as the original iso-surfaces. |