Shade Layer
Although most commonly used with 3D surfaces, shade plots can also be used to flood 2D plots with solid colors, or to light source shade the exterior of 3D volume plots. In 3D plots, zone effects (translucency and lighting) cause color variation (shading) throughout the zone(s). Shading can also help you discern the shape of the plot.
Toggle-on "Shade" in the Plot sidebar to add shading to your plot. Use the Shade page of the dialog to customize shading. Refer to Translucency for information on translucency and lighting zone effects.
| Shade plots require IJ or IJK-ordered, or finite element data. I-ordered, or irregular data cannot be used to create shade plots. |
Shade Layer Modifiction
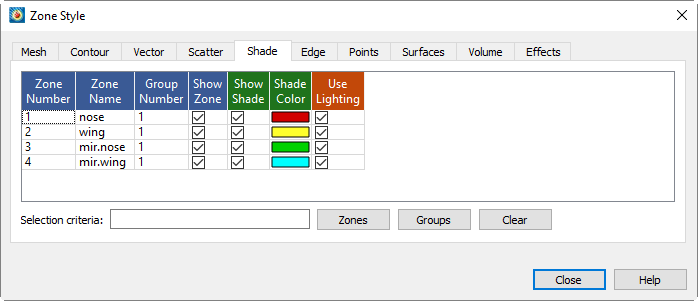
You can modify your shading attributes using the Shade page of the dialog (accessed via the Plot sidebar or ).
| In order for the changes made on the Shade page to be visible in your plot, the Shade layer must be turned on in the Plot sidebar. |
You can control any of the following attributes from the Shade page of the dialog:

- Show Shade
-
Turns the shade layer on or off for each active zone.
- Shade Color
-
Right-click to select the shade color using the Color Chooser. In 2D Cartesian plots, only solid zone flooding is available (i.e. no lighting effects).
- Use Lighting
-
(3D only) Turns the lighting zone effect off or on. When "no" is selected, the shade color is used to uniformly color the zone. Refer to Translucency for information on translucency and lighting zone effects.
| For information on using the controls at the bottom of the Zone Style dialog to select zones by name, see the description of these at the end of Field Plot Modification and the Zone Style Dialog. |