Contour Layer
Contour plots can be used to show the variation of one variable across the data field. To add a contour layer to your plot, toggle-on "Contour" in the Plot sidebar.
| Contour plots can only be plotted with organized data, such as IJ-ordered, IJK-ordered, or FE-data. Refer to Working with Unorganized Datasets for information on organizing your dataset. |
Additional options can be set on the Contour & Multi-Coloring Details (accessed via
 to the right of Contour in the Plot sidebar or
) and the Contour page of the
dialog.
to the right of Contour in the Plot sidebar or
) and the Contour page of the
dialog.
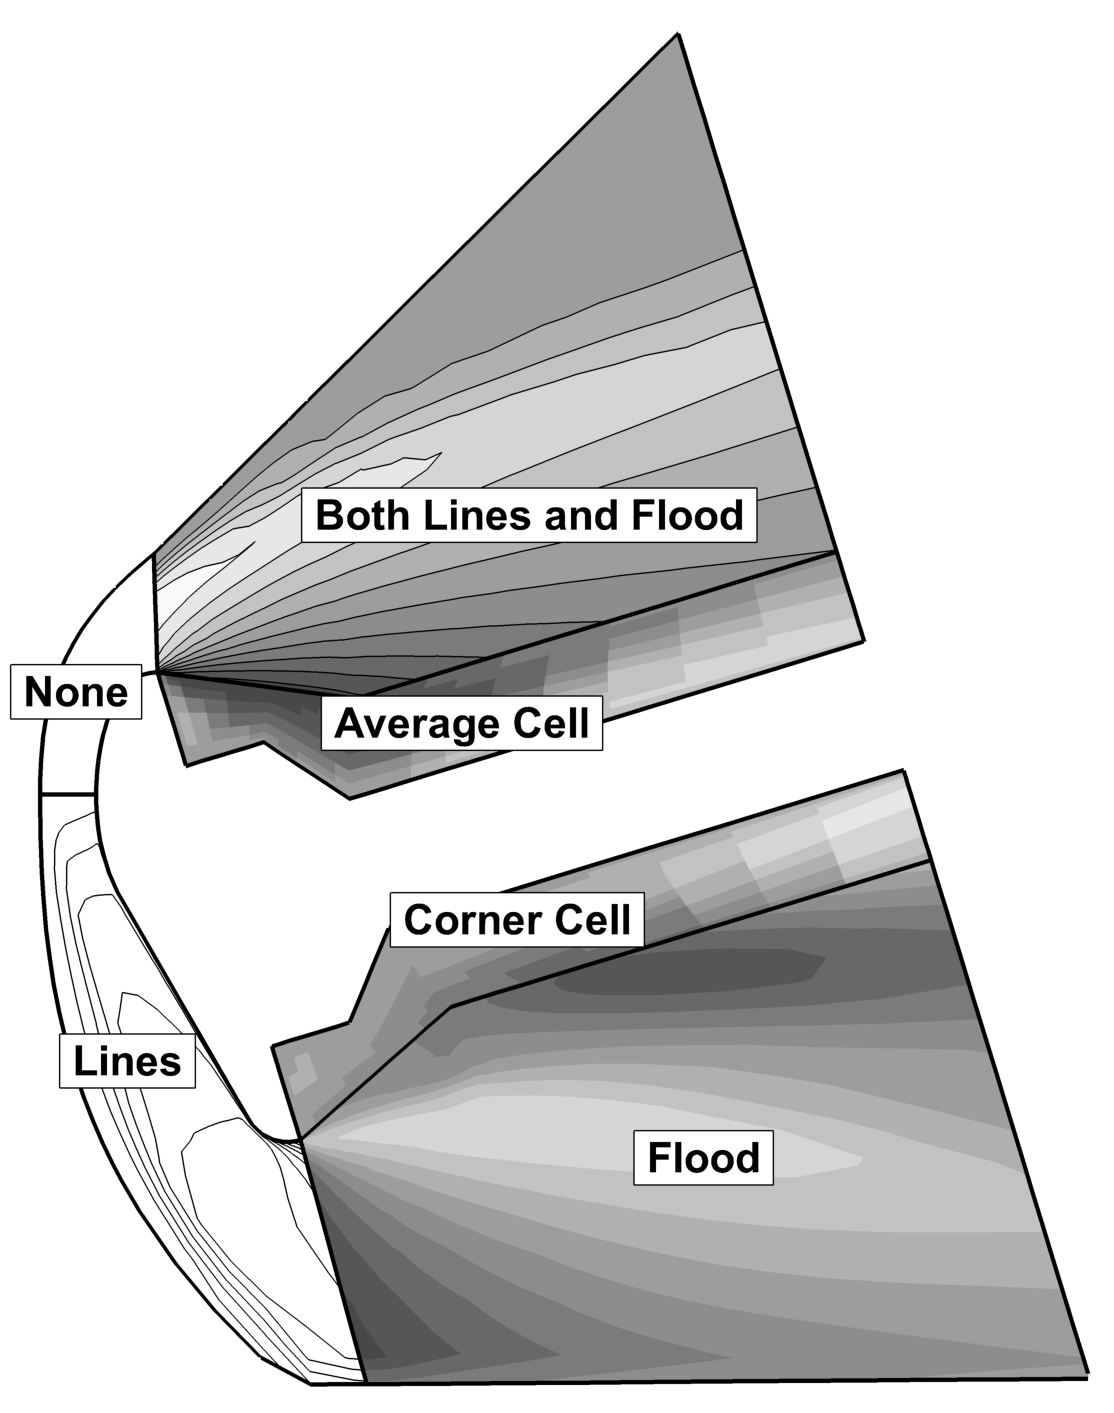
An example of each contour plot type is shown in Figure 1.
| Contour plots for streamtraces, iso-surfaces, and slices are controlled by their respective details dialogs and are not discussed here. (Refer to Rod/Ribbon Page, Iso-Surface Contour and Shade and Contour Page, respectively.) |
Contour Layer Modification
You can modify the following attributes of your contour plot using the Contour page of the dialog.
| In order for the changes made on the Contour page to be visible in your plot, the Contour layer must be active. You can turn on the Contour layer in the Plot sidebar. |
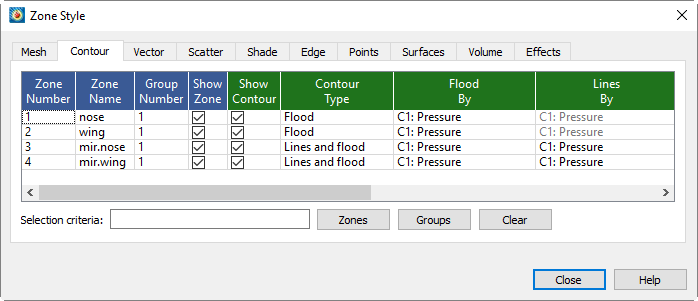
- Show Contour
-
Toggle-on to show the contour for the selected zone(s).
- Contour Type
-
Right-click to choose the contour plot type:
- Lines
-
Draws lines of constant value of the specified contour variable.
- Flood
-
Floods regions between contour lines with colors from a color map.
The distribution of colors used for contour flooding may be banded or continuous. When banded distribution is used for flooding, a solid color is used between contour levels. If continuous color distribution is used, the flood color will vary linearly in all directions. See Contour & Multi-Coloring Details for details.
- Both Lines and Flood
-
Combines the above two options.
- Average Cell Flood
-
Floods cells or finite elements with colors from a color map according to the average value of the contour variable over the data points bounding the cell. If the variables are located at the nodes, the values at the nodes are averaged. If the variables are cell-centered, the cell-centered values are averaged to the nodes and the nodes are then averaged.
Go to to determine whether the variables are nodal or cell-centered.
- Primary Value Flood
-
Floods cells or finite elements with colors from a color map according to the primary value of the contour variable for each cell. If the variable is cell centered, the primary value is the value assigned to the cell. If the variable is node located, the primary value comes from the lowest index node in the cell.
If the variables are located at the nodes, the value of the lowest indexed node in the cell is used. When plotting IJK-ordered, FE-brick or FE-tetra cells, each face is considered independently of the other faces. You may get different colors on the different faces of the same cell.
If the variables are cell-centered, the cell-centered value is used directly. When plotting I, J, or K-planes in 3D, the cell on the positive side of the plane supplies the value, except in the case of the last plane, where the cell on the negative side supplies the value.
Go to to determine whether the variables are nodal or cell-centered.
- Flood By
-
Right-click to select either a contour group (C1, C2, C3, C4, C5, C6, C7, or C8) or assign variables to the RGB color map. For contour groups, the associated variable is shown in this column and the menu next to the group number. See Contour Groups and RGB Coloring for more information. Applicable only when the contour type includes a flood.
- Lines By
-
Right-click to select which contour group identifies the contour lines (the variable associated with each contour group is also shown). Applicable only when the contour type includes lines.
- Line Color
-
Right-click to choose the contour line color using the Color Chooser.
- Line Pattern
-
Right-click to choose the line pattern for the mesh.
- Pattern Length
-
Right-click to choose the line pattern length as a percentage of frame height. You may choose a preset pattern length or enter your own.
- Line Thickness
-
Right-click to choose the contour line thickness. You may choose a predefined setting or enter your own.
- Line Color
-
Coose the contour line color.
- Use Lighting (3D only)
-
Turn on or off the lighting effects. See Translucency for more information on lighting effects.
Options such as contour labels, contour legends, and special settings for contour bands or contour lines are set by the selected contour group (see Contour Groups).
| For information on using the controls at the bottom of the Zone Style dialog to select zones by name, see the description of these at the end of Field Plot Modification and the Zone Style Dialog. |
Contour & Multi-Coloring Details
Opening the dialog from or from the Plot sidebar lets you specify:
Contour Groups
The dialog is shown below. This dialog is divided into five pages. The controls at the top for choosing a contour group and variable are available regardless of what page of the dialog is displayed.
- Variable
-
Assign a variable from your dataset to the active Contour Group (1, 2, 3, 4, 5, 6, 7, or 8). The variable selected here will be contoured subject to the controls in the dialog.
- 1, 2, 3, 4, 5, 6, 7, 8
-
Use the
1,2,3,4,5,6,7, and8buttons to specify attributes for a specific contour group. Each contour group has its own settings for the contour attributes established in the dialog.
The Contour Group Variables (1-8) can be used to color contour, mesh, scatter, or vector zone layers, as specified in the Color Chooser dialog and the Flood By and Lines By columns on the Contour page of the dialog.
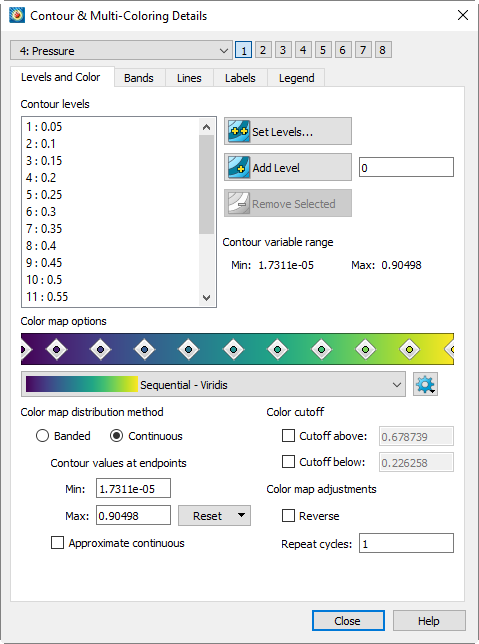
Contour Levels and Color
A contour level is a value at which contour lines are drawn, or for banded contour flooding, the border between different colors of flooding. Adjust contour levels using the Levels and Color page of the dialog (accessed via the Plot sidebar or the menu, or from the Contour Page of the Slice Details dialog).
From the Levels and Color page of the dialog, you can add, subtract, and rearrange contour levels using the top part of the dialog. The bottom part of the dialog allows you to choose or modify the color map to be used for coloring the contour variable.
The minimum and maximum value of the contour value is also displayed here. When the contour variable is calculated from subzone data, one or more of the values displayed may be estimates, which is indicated by (est) next to the affected values.
Contour Level Addition
You can add new levels in one of three ways:
-
Enter a value in the text field in the Levels and Color page of the dialog and click to propagate it to the Levels list on the left.
-
Add a new range of contour levels to the existing set by clicking , then using the dialog as described in New Contour Level Specification.
-
Choose
 from the Toolbar, then click at any location in the contour plot where you
would like to add a new contour level. Tecplot 360 adds a new contour level that goes
through the specified point. By holding down the mouse button you can drag and
interactively position the new contour level until you release the button.
from the Toolbar, then click at any location in the contour plot where you
would like to add a new contour level. Tecplot 360 adds a new contour level that goes
through the specified point. By holding down the mouse button you can drag and
interactively position the new contour level until you release the button.
Contour Level Removal
You can remove contour levels by:
-
Selecting one or more contour levels on the Levels and Color page of the dialog, then clicking .
-
Selecting
 from the Toolbar, then clicking any contour line in your contour plot.
Tecplot 360 deletes the specified contour level, or the nearest contour level to the
specified point.
from the Toolbar, then clicking any contour line in your contour plot.
Tecplot 360 deletes the specified contour level, or the nearest contour level to the
specified point.
Contour Level Adjustment
You can interactively adjust a contour level with the tool from the Toolbar. Hold down
the Control key, then click-and-drag the contour level you want to adjust. Move the
contour to the desired location and release the mouse button. The new value of the
contour level can be viewed on the Levels and Color page of the dialog.
New Contour Level Specification
You may specify a new set of contour levels by clicking the button on the Levels and Color page of the dialog. This button calls up the dialog.
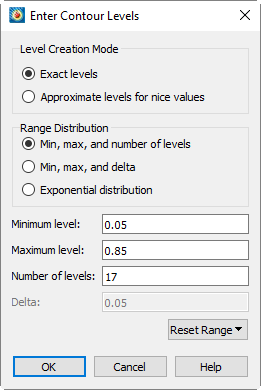
You can create contour levels in two ways:
- Exact levels
-
Specify the levels exactly using one of three methods.
- Min, Max, and Number of Levels (default)
-
Enter a minimum and maximum level value, together with the number of levels to be distributed equally throughout the range.
The Reset Range drop-down menu, available with this method, allows you to reset the Min and Max values to the contour variable’s minimum and maximum, optionally excluding the effects of blanking.
- Min, Max, and Delta
-
Enter a minimum and maximum level value together with a delta (step-size between levels).
- Exponential Distribution
-
Enter a minimum and maximum level value together with the number of levels to be distributed exponentially throughout the range.
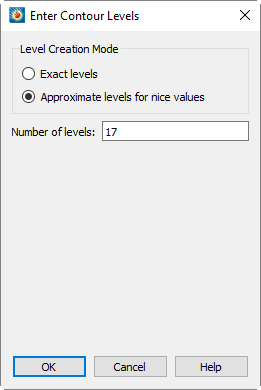
- Approximate levels
-
Enter the number of contour levels you want and let Tecplot 360 choose their values. The values chosen will be "nice" levels based on the values of the current contour variable.
Contour Coloring
You can choose a built-in color map, edit an existing color map, or create a new color map in the Levels and Contour page.
| The "Wild" colormap is generated anew each time it is selected. Do not expect the same contour coloring across different sessions or datasets. |
The built-in color maps cannot be changed. When you begin to modify a built-in color map by moving, adding, or removing control points, the built-in color map is automatically and immediately copied to a custom color map. The copy is given a name ending with the word "modified" and a number, and it is this copy to which further changes apply. Custom color maps can be edited, renamed, or deleted using the gear icon next to the color map menu.
You can create a new color map, then, by first choosing a built-in color map that is close to the color map you want to create (if none is particularly close, any will do) and beginning to modify it. You can then give it a proper name by clicking the gear icon and choosing Rename Custom Color Map.
Custom color maps are automatically saved with layouts. You can also use them in other plots by using the export and import functions on the gear menu.
- Color Map Control Points
-
You can control how colors are distributed across the color map here.

- Adjust a control point
-
Drag the diamond-shaped control points horizontally to control the intervals between them. The color gradations in the color map will be stretched or compressed as necessary as you move the control points.
- Create a new control point
-
Right-click a part of the color map where there is not yet a control point, then choose Add Control Point to create a control point there. The control point’s left and right colors will initially be set to the colors in effect at the clicked location.
- Change the control point colors
-
Right-click a control point to change its left (primary) or right (secondary) color by choosing Set Control Point Color, then choosing the color to be set from the submenu. The Color Chooser appears to let you choose the color to be used. The colormap will consist of a gradient of color between one control point’s right color and the next control point’s left color. (The first and last control points have only right and left colors, respectively.)
- Delete a control point
-
Right-click a control point and choose Remove Control Point to delete it.
- Color Map
-
Select the color map to use for contour coloring. The default is "Sequential - Viridis", a perceptually linear color map from blue to yellow.
Click the gear menu to the right of the Color Map menu to rename or delete a color map, or to import or export custom color maps.
- Exporting Custom Color Maps
-
Saves all custom color maps as a .map file. These can be imported to other projects to maintain consistency.
- Import Color Maps
-
Opens a browser window to import a .map file.
Custom color maps may also be created by using the $!CREATECOLORMAP command in a
macro, configuration, layout, map, or stylesheet file.
| When exporting, all the color maps that aren’t one of Tecplot’s original set of 45 build-in, immutable, color maps are saved into one .map file. |
A short example for loading custom color maps is shown below. Custom color maps may
also be loaded via the $!INCLUDEMACRO command. The $!GLOBALCONTOUR command in the
script below assigns a color map to one of the eight contour layers. For more
information see the Scripting Guide
$!INCLUDEMACRO "|MACROFILEPATH|/Macaw.map"
$!GLOBALCONTOUR 1 COLORMAPNAME = 'Sequential - Macaw'
$!GLOBALCONTOUR 2 COLORMAPNAME = 'Sequential - Macaw'
$!GLOBALCONTOUR 3 COLORMAPNAME = 'Sequential - Macaw'
$!GLOBALCONTOUR 4 COLORMAPNAME = 'Sequential - Macaw'
$!GLOBALCONTOUR 5 COLORMAPNAME = 'Sequential - Macaw'
$!GLOBALCONTOUR 6 COLORMAPNAME = 'Sequential - Macaw'
$!GLOBALCONTOUR 7 COLORMAPNAME = 'Sequential - Macaw'
$!GLOBALCONTOUR 8 COLORMAPNAME = 'Sequential - Macaw'
For Tecplot 360 2017 R3 and later, the $!CREATECOLORMAP macro command is allowed
in the configuration file. This allows users to define their own color maps and select
the default for each contour group. See the Scripting Guide for more information.
|
- Color Distribution Methods
-
- Banded
-
A solid color is assigned for all values within the band between two levels. (See Contour Bands.)
- Continuous
-
The color distribution assigns linearly varying colors to all multi-colored objects or contour flooded regions. You can vary the default assignment of colors by entering a "Min" or "Max" value for Color Map Endpoints. You may reset the endpoints to the contour variable’s min/max (considering the effects of blanking), the contour variable’s min/max excluding the effects of blanking, or to the contour level’s min/max using the menu to the right of these fields.
- Approximate Continuous
-
Causes each cell to be flooded using interpolation between the RGB values at each node. When the transition from a color at one node to another node crosses over the boundary between control points in the color spectrum, approximate flooding may produce colors not in the spectrum. Leaving this option unchecked is slower, but more accurate.
- Color Cutoff
-
Lets you specify a range within which contour flooding and multi-colored objects (such as scatter symbols) are displayed.
- Color Map Adjustments
-
The following optional adjustments are applied to the color map generated by the above settings.
- Reversed Color Map
-
You can reverse the color map by toggling on "Reverse". Two plots, one with the color map going in the default direction and one with the color map reversed, are shown in Figure 2.
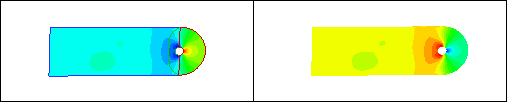 Figure 2. Left: Flooded contour plot with default settings. Right: Flooded contour plot with a reversed colormap.
- Repeat Cycles
-
You may choose to cycle the color map. This is useful if you have data where there is a great deal of activity in multiple ranges of the contour variable, and you want to cycle through all colors in each region. A plot with the color map cycled twice is shown in Figure 3.
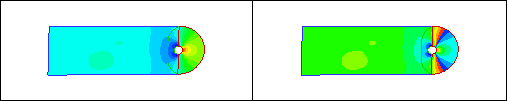 Figure 3. Left: Flooded contour plot with default settings. Right: Flooded contour plot with the color map cycled two times.
Rename Color Map
The Rename Color Map dialog allows you to enter a new name for a user-defined color map. This name will appear throughout Tecplot 360.
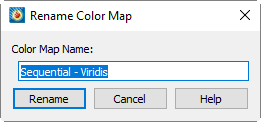
You may not give a custom color map the same name as a built-in color map.
| When renaming a color map, spaces will be removed from the beginning and end of the new name. |
Contour Bands
When Coloring Distribution for a group is set to "Banded" (via the Levels and Color page of the dialog), you may customize the color bands on the Bands page of the dialog.
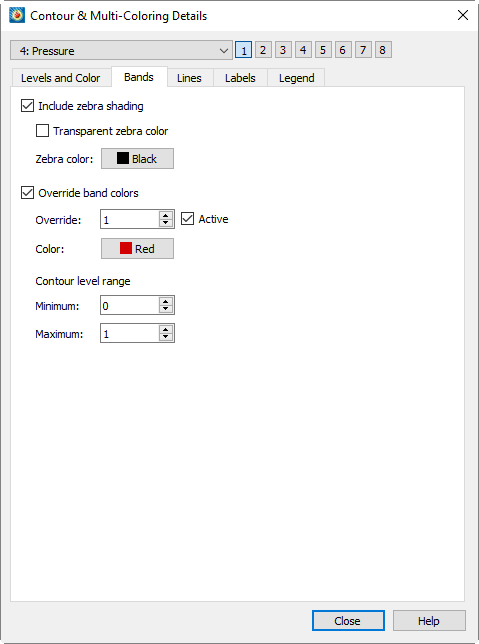
The Bands page of the dialog has the following options:
- Include Zebra Shading
-
This effect colors every other band with a specific color (or no color at all).
- Override Band Colors
-
Specific contour bands can be assigned a unique basic color. This is useful for forcing a particular region to use blue, for example, to designate an area of water. You can define up to 16 color overrides.
- Override
-
Specifies which override is being edited.
- Active
-
Toggle this checkbox to turn the override on or off.
- Color
-
Select the color for the override using the Color Chooser.
- Minimum, Maximum
-
Choose the range which will be overridden to the specified color.
Contour Lines
The contour line settings determine how contour lines are drawn for all zones in the active frame’s dataset. The settings are established on the Lines page of the dialog.
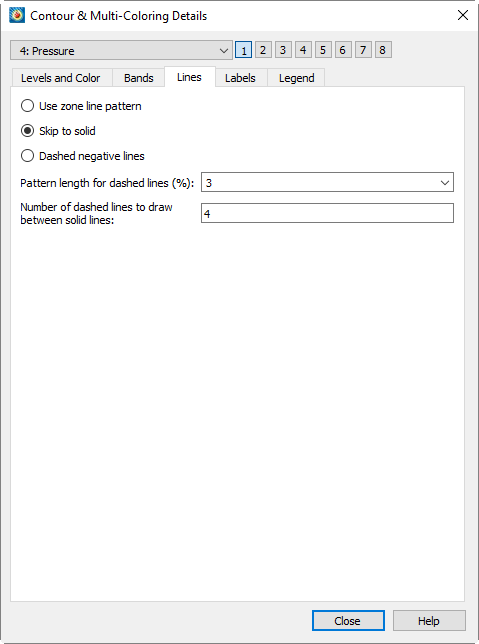
- Use Zone Line Pattern
-
For each zone, draw the contour lines using the line pattern and pattern length specified in the Contour page of the dialog.
If you are adding contour lines to polyhedral zones, the patterns will not be continuous from one cell to the next. The pattern will restart at every cell boundary.
- Skip to Solid
-
Draw dashed lines between each pair of solid lines, where is an integer you enter in the text field Number of Dashed Lines to Draw between Solid Lines.
- Dashed Negative Lines
-
Draw lines of positive contour variable value as solid lines and lines of negative contour variable value as dashed lines.
Contour Labels
Contour labels are labels that identify particular contour levels either by number or by value. You can place contour labels interactively, or have Tecplot 360 create them for you automatically. You can also have Tecplot 360 create and save a set of contour labels automatically, then interactively add contour labels to this saved set.
| The contour plot type must be lines or lines and flood in order to use Contour labels. |
Contour labels may be configured in the Labels page of the dialog or with the Add Contour Label mouse mode tool from the Toolbar. You can modify the following options using the Labels page of the dialog.
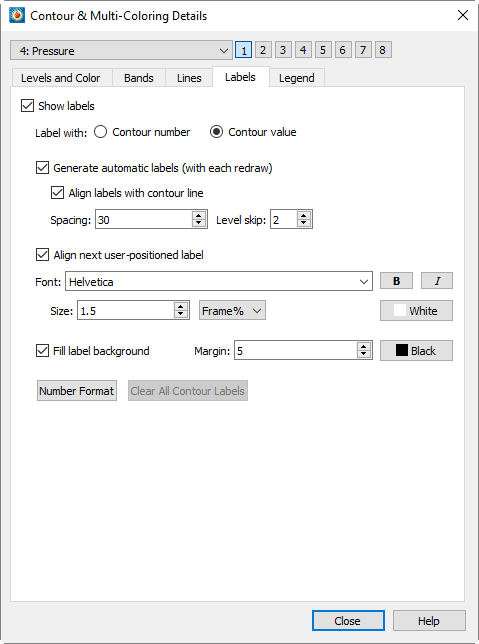
- Show Labels
-
Toggle-on "Show Labels" to include contour labels in your plot. You can then label the contour levels by selecting either or .
- Label Format
-
Use the midsection of the dialog to customize label color, font, and fill settings. (See Font Folders and Fallback for more information on how fonts work with Tecplot 360.)
- Generate Automatic Labels (with each Redraw)
-
At each Redraw, Tecplot 360 creates a new set of contour labels. At any time, you can deselect the "Generate Automatic Labels" (with each Redraw) check box, and Tecplot 360 retains the last set of labels generated.
- Align Labels with Contour Line
-
Use the Spacing field to specify the spacing of the contour labels along the contour line, as a percentage of the frame. Use the Level Skip field to specify a skip value between the contour levels to be labeled.
- Align Next User-Positioned Label
-
If the "Align Next User-Positioned Label" is selected, the next label is aligned with the contour line. Otherwise, the label is written with normal, upright text.
- Number Format
-
Use the button to specify the number formatting of the Contour labels. See Specify Number Format for more details.
- Clear All Contour Labels
-
When "Generate Automatic Labels" is deselected, you can click this button to erase the current set of contour labels.
Contour Legend
To include a contour legend, select the Legend page of the dialog for the appropriate contour group.
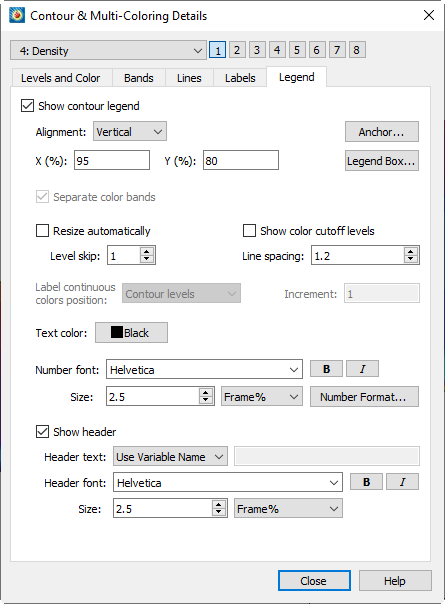
The following options are available:
- Show Contour Legend
-
Select this option to show the contour legend on your plot.
- Alignment
-
Select Vertical or Horizontal.
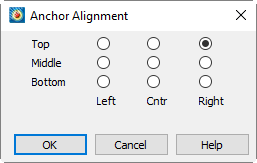
- Anchor
-
Specify which part of the legend is anchored in the selected position using the Anchor Alignment dialog.
- Position
-
X (%) and Y (%) as percentages of the frame width and height. (You can also move the legend interactively.)
- Legend Box
-
Displays the Legend Box dialog to adjust the appearance of the box around the legend, or turn it off entirely.
- Separate Color Bands
-
Select this check box to separate the color bands in the legend with black lines. Use this option to visually separate similar colors. If this box is not selected, similar adjacent colors may tend to blur together.
- Resize Automatically
-
Automatically skips some levels to create a reasonably sized legend.
- Include Color Cutoff Levels
-
Color bands and labels for levels affected by Color Cutoff are shown in the legend.
- Label Continuous Colors Position
-
If you have selected "Continuous Color Distribution" on the Levels and Color page of the dialog, you have three options for placement of labels on the legend:
- Contour Levels
-
This option places one label for each contour level. See Contour Levels and Color.
- Specified Increment
-
Enter a value in the Increment text field.
- Color Map Divisions
-
Places one label for each control point on the color map.
- Level Skip
-
Enter the number of levels between numbers on the legend. This also affects the number of levels between contour labels on the plot. Skipping levels on the contour legend compresses the color bar (if one appears); it does not change the spacing between text entries on the legend.
- Line Spacing
-
Enter the spacing between contour legend numbers. This does not change the number of entries in the legend, so a large value here creates a large legend. Use Level Skip to reduce the number of entries in the legend.
- Text Color
-
Affects the color of all text in the legend.
- Number Format
-
Adjust the format of numbers in the legend. See Specify Number Format for more details on numeric formatting
- Number Font
-
Choose the font used for numbers in the legend, including size and variety (boldface or italic). See Font Folders and Fallback for more information on how fonts work with Tecplot 360.
- Show Header
-
Toggle-on to display the contour legend header text.
- Header Text
-
Allows selection of content displayed in the legend header.
- Use Variable Name
-
The legend header will display the variable name assigned to the contour group.
- Use Text
-
The legend header will display text entered into the text field next to the options widget. The text can contain dynamic text (See Dynamic Text for information on dynamic text) and formatted using tags (See Text Details for information text formatting tags).
- Use LaTeX
-
The legend header will display a processed LaTeX expression. See LaTeX Expressions for information on LaTeX formatting.
- Header Format
-
Adjust the font and height for the legend header or the legend labels, including font size and variety (boldface or italic). (See Font Folders and Fallback for more information on how fonts work with Tecplot 360.)
Not all fonts have Bold and/or Italic variants. For fonts that do not have these styles, the and/or buttons may have no effect.
Anchor Alignment
The dialog allows you to specify the anchor point, or fixed point, of the object. As the box grows or shrinks, the anchor location is fixed while the rest of the box adjusts to accommodate the new size. There are nine possible anchor points, corresponding to the left, right, and center positions on the headline, midline, and baseline of the box.
Legend Box
The Legend Box dialog appears when you click the Legend Box button in the Legend page of the Contour Details dialog.
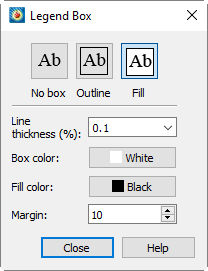
- Box Type
-
Choose (left to right) No Box, Outline, or Fill. If you choose Outline or Fill, the following options control the appearance of the box.
- Line Thickness
-
Specify the line thickness as a percentage of frame height.
- Box Color
-
Choose a color for the legend box outline.
- Fill Color
-
Choose a color for the legend box fill (Fill mode only).
- Margin
-
Specify the margin between the legend text and legend box as a percentage of the text height.
Extract Contour Lines
Normally, contour lines are derived from the dataset "on the fly" and do not add any data to the dataset. To extract existing contour lines to Tecplot zones, allowing you to retain them even if the contour details are changed, go to . Your data will be altered by the creation and naming of new zones.
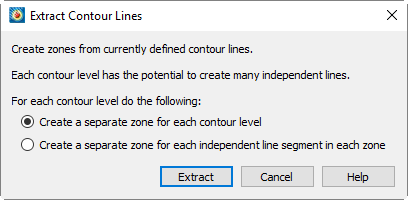
Using the dialog, you have the following options:
- Create a separate zone for each contour level
-
A new zone will be created for each contour line plotted. The number of new zones will equal the number of contour levels. The created zones are FE-line segment type zones.
- Create a separate zone for each independent line segment in each zone
-
With this option you may create many more zones than there are contour levels. New I-ordered line segment zones are created in each source zone for each topologically independent contour line.
After generating the zones, we recommend you activate the Mesh Layer when plotting the new zones.