Scatter Layer
Scatter plots are plots of symbols at the data points in a field. The symbols may be sized according to the values of a specified variable, colored by the values of the contour variable, or may be uniformly sized or colored. Unlike contour plots, scatter plots do not require any mesh structure connecting the points, this allows you to make scatter plots of irregular data.
To add a scatter layer to your plot, activate the "Scatter" toggle in the Plot sidebar. You can modify your Scatter plot using the Scatter page of the dialog and the submenu of the menu.
Scatter Plot Modification
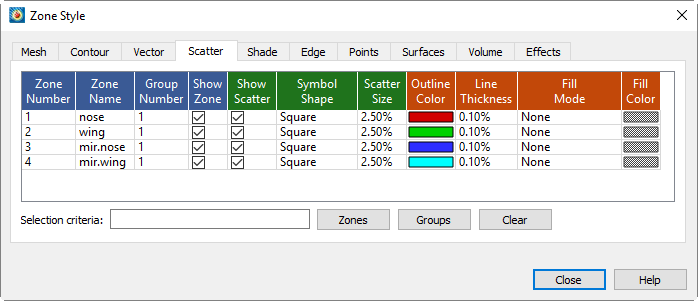
Once you have loaded your data, you can modify your scatter plot attributes using the Scatter page of the dialog. You can control any of the following attributes for a zone or group of zones from the Scatter page of the dialog.
| For information on using the controls at the bottom of the Zone Style dialog to select zones by name, see the description of these at the end of Field Plot Modification and the Zone Style Dialog. |

| In order for the changes made on the Scatter page to be visible in your plot, the Scatter layer must be turned on in the Plot sidebar. |
- Show Scatter
-
Right-click to choose whether or not to show the scatter layer for the highlighted zone(s).
- Symbol Shape
-
Right-click to choose one of the following symbol shapes:
-
Square (default)
-
Delta
-
Gradient
-
Right Triangle
-
Left Triangle
-
Diamond
-
Circle
-
Plus
-
Point
-
Cube (rendered as a square in 2D)
-
Sphere (rendered as a circle in 2D)
-
Octahedron (rendered as a diamond in 2D)
-
Character - Use a specified ASCII character from a selected font (as specified in the Enter ASCII Character dialog). See also Text.
3D scatter symbols should only be used if your dataset is on the order of thousands of points. If your dataset is large (e.g. millions of points), try using 2D scatter symbols instead for better interactive performance. -
- Scatter Size
-
Right-click to select the symbol size either by a constant percentage of the frame width or from a variable in the dataset. For constant size, you may choose a preset size or enter one of your own. (See Scatter Size/Font for complete instructions for sizing scatter symbols by variable.)
- Outline Color
-
Right-click to choose a color from the Color Chooser. Besides a constant color, you can also choose:
- Multi
-
Each symbol is colored according to the value of the selected contour variable at that data point. Choose a contour group at the bottom of the Color Chooser dialog.
- RGB
-
Each symbol is colored according to the values at that data point for the variables assigned to RGB. Click the button at the bottom of the Color Chooser dialog.
- Line Thickness
-
Right-click to choose the thickness of the scatter outlines for each highlighted zone(s), either a preset from the menu or by entering your own value.
- Fill Mode
-
The 3D symbol shapes, Cube, Sphere, and Octahedron are filled with the line color, but the other shapes have other fill modes available. Right-click to choose:
- None (default)
-
Unfilled symbols.
- Use Specific Color
-
Uses the color shown in the Fill Color column.
- Use Line Color
-
Matches outline color.
- Use Background Color
-
Matches frame color.
- Fill Color
-
Right-click to select a fill color using the Color Chooser.
| Spheres, Cubes, and Octahedrons are always light-source shaded. Spheres are smooth shaded, and Cubes and Octahedrons are facet shaded. Cube edges are aligned with X, Y, and Z-axes. Octahedrons are oriented so one vertex points in the Z-direction and one vertex points in the X-direction. For best appearance of 3D shapes, adjust the Light Source to use Specular Highlighting. Scatter Size and Line Thickness are not available for the point symbol. Points are always one pixel in size. |
| If your data consists of a dense mesh of points, a scatter plot may be too crowded to be of much use. You can "thin" the scatter plot by plotting only a certain subset of the data points with the Index Skip attribute from the Points page of the dialog. The Point scatter symbol allows for quick viewing and panning in 3D plots. It is also a useful tool for identifying features in volume zones. |
Scatter Size/Font
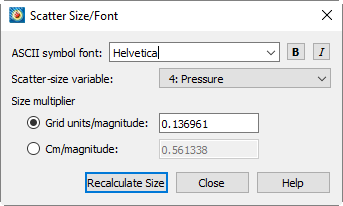
Use the dialog (accessed via in 2D/3D or in line plot modes) to choose the base font used for ASCII character symbols and the scatter-size variabjle used to scale scatter symbols. This dialog is also available by right-clicking a scatter size in the Scatter page of the Zone Style dialog and choosing . The dialog is shown below:

The following options are available:
- ASCII Symbol Font
-
Select a font from the drop-down and optionally a bold and/or italic style. (See Font Folders and Fallback for more information on how fonts work with Tecplot 360.) For XY and Polar line plots, this is the only option available.
| Not all fonts have Bold and/or Italic variants. For fonts that do not have these styles, the B and/or I buttons may have no effect. |
- Scatter-size Variable
-
Select a variable from the drop-down of the dataset’s variables. If the Scatter Size field is set to "Size by Variable" on the Scatter page of the dialog, this variable is used to calculate the scatter symbol size at each data point. The actual size of each symbol is determined by multiplying the value of the variable at each point by the Size Multiplier. If the Scatter Size field is not set to "Size by Variable", this field has no effect.
- Size Multiplier
-
Enter the scale factor that multiplies the values of the Scatter-size Variable to size the scatter symbols. If the Scatter Size field on the dialog is not set to "Size by Variable", this field has no effect. The Size Multiplier multiplied by the scatter variable value gives the size of the scatter symbol at a point, in units, specified by the following option buttons:
- Grid Units/Magnitude
-
Select this to express the Size Multiplier in terms of grid units per unit of variable magnitude.
- Cm/Magnitude
-
Select this to express the Size Multiplier in terms of screen centimeters per unit of variable magnitude.
- Recalculate Size
-
Select to reset the Size Multiplier to Tecplot 360’s initial value.
Scatter Legends
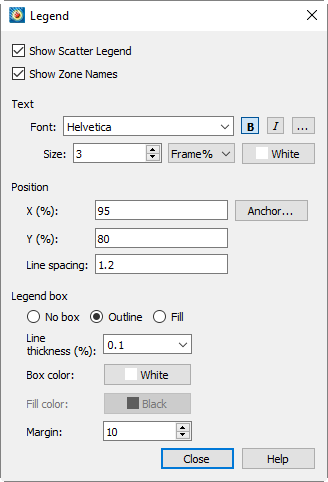
To include the scatter legend, select "Scatter Legend" from the sub-menu of the menu. Select the following options in the dialog.

- Show Scatter Legend
-
Toggle-on to include a scatter legend in the plot.
- Show Zone Names
-
Toggle-on to include zone names in the legend.
- Text
-
Format the text for the legend by choosing a color and font, and specifying the text height. (See Font Folders and Fallback for more information on how fonts work with Tecplot 360.) Click the (…) button to display the Select Font dialog.
- Position
-
Specify the location of the anchor point of the legend by entering values in the X (%) and Y (%) text fields. Enter X as a percentage of the frame width and Y as a percentage of the frame height.
- Legend Box
-
Select the type of box to draw around the legend (No Box, Outline, or Fill). If you choose Outline or Fill, format the box using the following controls:
- Line Thickness
-
Specify the line thickness as a percentage of frame height.
- Box Color
-
Choose a color for the legend box outline.
- Fill Color
-
Choose a color for the legend box fill (Fill mode only).
- Margin
-
Specify the margin between the legend text and legend box as a percentage of the text height.