Customization
This chapter discusses how custom files are loaded on startup, how to manually open those files via the command line, the customizations that can be made by editing the Tecplot 360 configuration file, and customizations that can be made using the menu.
Custom Files loaded on Startup
On startup, Tecplot 360 will load certain configuration files. These files are editable and can be placed in different locations depending on preference. The different files types are as follows:
-
tecplot.add (Add-on Loading)
-
tecplot.cfg (Configuration Files)
-
tecplot.fnt (Custom Character and Symbol Definition)
-
tecplot.mcr (Quick Macro Panel)
-
tecplot_latex.mcr (LaTeX Expressions)
-
variable_aliases.txt (Creating and Using a Variable Alias File)
When Tecplot 360 first launches, it looks for the above tecplot* files in the following locations, in the order listed below. Tecplot* specifies any of the above filenames.
-
The file tecplot* specified on the command line. (See Loading custom files via the Command Line.)
-
The file tecplot* in the current working directory.
-
The file tecplot* in your home directory when using -h flag on the command to set the home directory.
-
The file tecplot* in the Users home directory. On Mac and Linux, the tecplot* file must be preceded by a period in the users home directory. For example, .tecplot.add.
-
The file tecplot* in the Tecplot 360 installation directory.
The first file found in the above search order is used; others are ignored even if they exist. To see what tecplot* files are being loaded, in 360 go to (on Mac, ) and look for the files in the Runtime environment.
Loading custom files via the Command Line
You can specify a different custom file by adding an option flag in front of the custom file name to the command line when launching Tecplot 360.
The following command starts Tecplot 360 and installs the custom file specified at startup.
tec360 -flag tecplot*
Where -flag is the flag of the certain file you want to load. Refer to the table below for the correct flag to be used.
-addonfile filename |
Supply a custom list of addons via the tecplot.add file. |
-c cfgfile |
Use cfgfile for the configuration instead of the default configuration file, tecplot.cfg. |
-f fontfile |
Use fontfile instead of the default font file, tecplot.fnt. |
-p scriptfile |
Use scriptfile like tecplot_latex.mcr instead of the default, tecplot_latex.mcr. |
-qm quickpanelfile |
Place the macro functions in quickpanelfile in the Quick Macro Panel, instead of using the macros from the default file, tecplot.mcr. |
To see an example of any of these files, open the file in the your Tecplot 360 installation.
Configuration Files
A Tecplot 360 configuration file is a special type of macro file that Tecplot 360 reads on start up. Use customized configuration files to override any or all of Tecplot 360’s factory default settings.
| You can create a configuration file from scratch using any plain text editor, or by editing a copy of an existing configuration file. |
| A configuration file should include only those options for which you want to override defaults. |
See Custom Files loaded on Startup for information on how it is loaded.
Editing Configuration File
You are not limited to merely customizing those settings that appear in
an existing configuration file. Most settings that can be modified by
the $!Field, $!LineMap,or $!Interface macro commands
can be changed in the configuration file directly. The
$!LIMITS macro command can be used in the configuration
file only.
The simplest way to do this is to create a layout or macro with the settings you want, then copy and paste the appropriate commands into your configuration file. See the Scripting Guide for complete details on macro commands.
SetValue Commands
SetValue Commands are macro commands used to specify the value of a given plot attribute. You may add SetValue commands to your tecplot.cfg file to override any of Tecplot 360’s default settings. For example, suppose you want your 2D axes to appear cyan. You can add this preference to your configuration file as follows:
-
Using the Tecplot 360 interface, create a 2D plot with cyan axes while either recording your steps as a macro, or else save the resulting plot as a Tecplot layout.
-
Edit the resulting macro or layout, scanning for the lines that set the 2D axis colors. The following example shows the commands that specify the X- and Y-axis details in a layout of a 2D plot with cyan axes:
$!TWODAXIS XDETAIL{RANGEMIN = -3} $!TWODAXIS XDETAIL{RANGEMAX = 15} $!TWODAXIS XDETAIL{GRIDLINES{SHOW=YES}} $!TWODAXIS XDETAIL{AUTOGRID=NO} $!TWODAXIS XDETAIL{GRSPACING = 5} $!TWODAXIS XDETAIL{GRIDLINES{COLOR = CYAN}} $!TWODAXIS YDETAIL{GRIDLINES{SHOW = YES}} $!TWODAXIS YDETAIL{GRIDLINES{COLOR = CYAN}} -
Discard everything but the lines that actually set the color:
$!TWODAXIS XDETAIL{GRIDLINES{COLOR = CYAN}} $!TWODAXIS YDETAIL{GRIDLINES{COLOR = CYAN}} -
Paste the resulting lines into your configuration file.
Plot Default Setting - FIELDMAP and LINEMAP
A single $!FIELDMAP command can be included to set plot defaults. The
zone cannot be specified in the configuration file, and the command is
not effective for values set dynamically by Tecplot 360, such as Mesh
Color. In the example below, the default contour type is Flood, scatter
symbol shape is Delta, and scatter size is 1.8.
$!FIELDMAP CONTOUR{CONTOURTYPE = FLOOD}
$!FIELDLAYERS SHOWSCATTER = YES
$!FIELDMAP SCATTER{SYMBOLSHAPE{GEOMSHAPE = DEL}}
$!FIELDMAP SCATTER{FRAMESIZE = 1.8}
In the same way as above, a single $!LINEMAP command can be
added for line mapping defaults. In the example below, XY and Polar Line
mappings will have a dashed line pattern, and symbols will be filled
circles.
$!LINEMAP LINES{LINEPATTERN = DASHED}
$!LINEPLOTLAYERS SHOWSYMBOLS = YES
$!LINEMAP SYMBOLS{SYMBOLSHAPE{GEOMSHAPE = CIRCLE}}
$!LINEMAP SYMBOLS{FILLMODE = USELINECOLOR}
Override Automatic View→Fit
When loading a 3D plot, Tecplot 360 automatically fits the plot to
the frame. To revert to the old Tecplot 360 behavior, which used a
fixed zoom factor, remove the # from the following line
in your tecplot.cfg file:
#$!FrameSetup Initial3DScale = 0.7
Interface Configuration
The many members of the $!INTERFACE macro help you
configure Tecplot 360’s user interface and graphics drawing
capabilities. Although some of these commands can be executed in any
macro, the best place to put these is in the Tecplot 360
configuration file: tecplot.cfg. Below are a few examples.
Refer to the Scripting Guide for a complete listing.
General Interface Configuration Options
$!INTERFACE followed by:
- MOUSEACTIONS {MIDDLEBUTTON {SIMPLEDRAG=ZOOMDATA}}
-
Specify the action of the middle mouse button click and drag. Several other options for the middle and right mouse buttons are listed in the Scripting Guide. These commands can only be executed in the Tecplot 360 configuration file.
- USESTROKEFONTSONSCREEN = (YES, NO)
-
If set to
YES, all text drawn in the work area will be drawn using Tecplot 360’s internal stroke fonts. If set toNO, the native True Type fonts will be used instead. - USESTROKEFONTSFOR3DTEXT = (YES, NO)
-
If set to
YES, all 3D text drawn in the work area will be drawn using Tecplot 360’s internal stroke fonts. 3D text consists of ASCII scatter symbols and node and cell labels when the active plot type is 3D Cartesian. For 3D text, this setting overrides the setting ofUSESTROKEFONTSONSCREEN. If set toNO, TrueType fonts will be used instead.
Vulkan-Specific Configuration Options
Several options are available to further tune Tecplot 360 to operate
with the Vulkan capabilities of your platform. To assign values to these
parameters you must use the $!INTERFACE VULKANCONFIG command. A
complete list of these options is given in the Scripting Guide.
$!INTERFACE VULKANCONFIG followed by:
- {GPUNUMBER = <integer>}
-
Select the GPU device to be used. If more than one GPU device is available, the desired GPU device is selected by by supplying -1 or the GPU offset. The default setting is -1, indicating that Tecplot 360 chooses. GPU numbers range from 0 to <numdevices>-1. After dismissing Tecplot 360’s Welcome screen, look for "Vulkan info" in the "Runtime" section of Tecplot 360’s Help "About Tecplot 360 EX" dialog for a list of available GPU’s from which to choose.
- {MAXIMAGEFILTERMAGNIFICATION = <double>}
-
Sets the maximum magnification by non-texture resize filter before textures are used. This keeps Tecplot 360 from creating textures which are too large. Setting this above three is not recommended. Setting below 1.0 will result in the use of a faster texture algorithm.or a list of available GPU’s from which to choose.
- {ONSCREENDEVICE {MAXMULTISAMPLES = <integer>}}
-
Sets the number of desired multi-samples used for on-screen rendering. The range of values are powers of 2 between 0 and 64. If a value of 0 or 1 is supplied, no multi-sampling is performed. Larger values of multi-sampling produce smoother lines but require more GPU memory. The default value is 4. Not all GPUs can support the requested amount. If the requested number is not available, or not a power of 2, Tecplot will choose the closet smaller power of 2 value available.
- {ONSCREENDEVICE {DELIVERNORMALSFORPANELSHADING = <integer>}}
-
Instructs Tecplot 360 to compute and deliver face normals when panel (aka flat) shading for on-screen or rendering. By default this value is set to Yes, instructing Tecplot 360 to always delivers face normals. Setting this value to No consumes less GPU memory and renders faster but can produce artifacts when zoomed in very close to the model.
- {ONSCREENDEVICE {OITSETTINGS {FRAGMENTBUFFERSIZE = <integer>}}}
-
Sets the maximum fragment buffer size in megabytes allocated on the GPU for on-screen rendering of transparent plots. Larger values produce more accurate transparent plots, especially if there are many overlapping transparent layers that consume the entire viewing area. The range of values is 1 through 4096 inclusive. The default value is 2048 on macOS and 512 on Windows and Linux.
- {ONSCREENDEVICE {OITSETTINGS {MINSORTEDFRAGMENTCOUNT = <integer>}}}
- {ONSCREENDEVICE {OITSETTINGS {MAXSORTEDFRAGMENTCOUNT = <integer>}}}
-
Sets the minimum and maximum number of fragments that are sorted for each pixel for on-screen rendering of transparent plots. The range of values is 1 to 1024 inclusive. The minimum value is used for performing interactive view changes and the maximum value is used for the last rendered frame after the interactive view change is complete. This provides better performance during interactive view changes and higher quality static images, particularly when there are many overlapping transparent layers. The default values for the minimum and maximum are 128 and 1024 respectively.
- {OFFSCREENDEVICE {MAXMULTISAMPLES = <integer> }}
- {OFFSCREENDEVICE {DELIVERNORMALSFORPANELSHADING = <boolean>}}
- {OFFSCREENDEVICE {OITSETTINGS {FRAGMENTBUFFERSIZE = <integer>}}}
- {OFFSCREENDEVICE {OITSETTINGS {MINSORTEDFRAGMENTCOUNT = <integer>}}}
- {OFFSCREENDEVICE {OITSETTINGS {MAXSORTEDFRAGMENTCOUNT = <integer>}}}
-
With the exception of the off-screen MinSortedFragmentCount, which has no meaning for off-screen rendering, the remaining options' default values and behaviors are identical to their on-screen equivalents but apply to off-screen image rendering.
Default Temporary Directory
Tecplot 360 writes out a number of temporary files. To tell Tecplot 360 where to place these files, put the following macro command in the tecplot.cfg file
$!FILECONFIG TEMPFILEPATH = "tempfilepath"
where tempfilepath is the new path. The default path is system dependent.
Performance Dialog
The factory settings in the dialog are designed for moderately-sized data and occasionally may need to be adjusted to optimize Tecplot 360’s rendering performance.
The dialog has the following options:
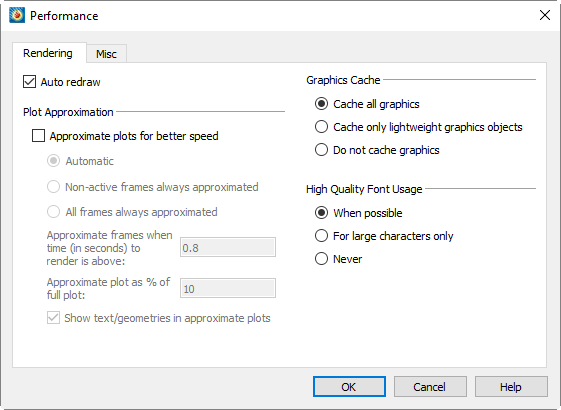
Rendering
- Auto Redraw
-
When selected, Tecplot 360 will automatically redraw the plot whenever style or data changes. Some users prefer to turn this option off while changing multiple style settings, and then manually pressing Tecplot 360’s [Redraw] button on the Plot sidebar to see the full plot.
| Auto-redraw can be interrupted with a mouse click or key press. |
- Enable Statistics Overlay
-
When selected, Tecplot 360 will show the frame rate (FPS) in Hz, the frame time in milliseconds to render the frame, and the GPU name. Note that FPS is limited to 60.
Load On Demand
With load-on-demand activated, Tecplot 360 generates plots faster and using less memory by only loading data that is needed for the plot. If changes to the plot style require additional variables to be loaded, Tecplot 360 will automatically load them, and if necessary, unload variables that are no longer used. Tecplot 360’s ability to automatically load and unload variables on demand allows you to examine data that is much larger than the physical or virtual memory of your computer.
| This setting does not affect reading data in Tecplot Subzone (.szplt) format, also known as SZL. SZL data is always loaded on demand, and in the smallest possible amount, which may be less than a full zone’s worth of a variable. |
For large datasets, only the zones and variables currently in use will be loaded. However, for small datasets, some other zones and variables may be loaded for you (based on the Memory Threshold).
- Unload Strategy
-
Specifies how to manage unloading variables and other load-on-demand resources.
- Auto Unload
-
This strategy attempts to keep Tecplot 360’s memory use within the defined Min and Max Memory Thresholds. Tecplot 360 uses these values to determine when and how much it should unload. This is the best option for exploring data as Tecplot 360 only unloads if and when the memory threshold has been exceeded; if the threshold is not exceeded, data loaded on-demand remains available in memory if you need it again.
- Minimize Memory Use
-
This strategy is used if more aggressive unloading of variables and other load-on-demand resources is required. This option is best suited for animating through a very large number of time steps, where each time step consumes a significant part of the computer’s available physical and virtual memory.
- Never Unload
-
This strategy disables the unloading capability of load-on-demand while still preserving the ability to load variables on demand.
Most users should select either the "Auto Unload" or "Minimize Memory Use" options. - Memory Threshold (%) [Auto Unload ONLY]
-
When Tecplot 360 uses at least the maximum percentage of the available physical and virtual memory, it will attempt to unload variables and other load-on-demand resources until the available physical and virtual memory is at or below the specified minimum percentage.
Variable Derivation
When Tecplot 360 needs to create a nodal variable from a cell centered variable, it uses a prescribed derivation method. Tecplot 360 provides two such derivation methods: fast and accurate.
- Fast (Linear)
-
When selected, Tecplot 360 uses simple averaging to derive a nodal variable from a cell centered one.
- Accurate (Laplacian)
-
When selected, Tecplot 360 uses Laplacian interpolation to derive a nodal variable from a cell centered variable.
Status Information
Use the following controls in the Status Line region of the dialog to customize what is displayed in the status line:
- Show Status Line
-
Turn this preference on/off to control the display of status messages.
If you are remotely displaying Tecplot 360 on an X terminal, updating the status line can slow down processing. If this is the case, turn off the Show Status Line control. - Show Continuous State Messages
-
Turn on this control to receive context-sensitive commentary in the status line.
- Show Continuous Running Coordinates
-
Turn on this control to display the coordinates of your mouse cursor in the status line.
- Show Tool Tips
-
Use this option to turn tool tips on or off.
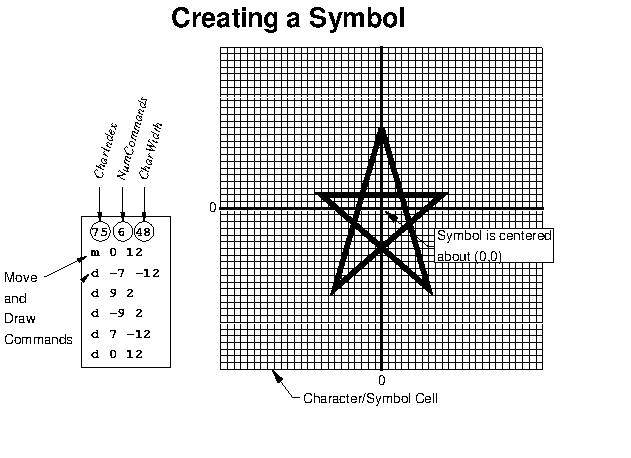
Custom Character and Symbol Definition
Generally, you will use TrueType fonts for displaying text on your
screen and for printing. However, you can configure Tecplot 360 to
use stroke fonts instead by adding the USESTROKEFONTSONSCREEN and
USESTROKEFONTSFOR3DTETXT macro commands to your configuration file (see
Interface Configuration).
Stroke fonts define characters to be displayed on the screen using a set of
straight lines (called strokes, naturally). Stroke fonts, if enabled, are also
used in exported images (however, vector printing and file formats may use
TrueType or PostScript fonts).
The stroke fonts are faster to draw than TrueType fonts, which can be important if you create plots with a lot of complex text. Another advantage of the stroke fonts is that you can redefine or modify the strokes that make up the characters, as they are stored in a plain text file called tecplot.fnt, which can be modified using an editor. For information on how to load a custom font file, see Custom Files loaded on Startup.
The Font File is structured as follows:
#!FF 4
CharCellHeight
Stroke command set for Helvetica Font
Stroke command set for Greek Font
Stroke command set for Math Font
Stroke command set for User-Defined Font
Stroke command set for Times Font
Stroke command set for Times Italic Font
Stroke command set for Courier Font
The file type and version are on the first line ("FF" refers to Font File). CharCellHeight is the interline spacing (the height of a capital M plus some vertical space) in the units of a two-dimensional coordinate system used to define the stroke-font characters. The baseline of the characters is at zero. Before Tecplot 360 uses the character definitions, they are normalized by the character cell height.
Following the character cell height, there are seven sets of stroke commands, one set for each font as shown above. Each stroke command set consists of definitions for the characters in the font. Each font has a base set of 96 characters (character indices 32 to 127). Some fonts also include an extended set of characters (character indices 160 to 255). The extended characters are needed to complete the character sets for most of the common European languages.
All seven stroke command sets must be present, and each must have at least one character defined. Each stroke command set begins with the definition for a space (character index 32). After that, characters within a stroke command set may be defined in any order. If a character is not defined in the Font File, it is drawn as a blank.
Each character in a stroke command set is defined as follows:
CharIndex NumCommands CharWidth
Command1
Command2
Command3
.
.
.
CommandNumCommands
CharIndex is the character index that ranges from 32 to 127 and 160 to 255 for each font (see Character Indices in Tecplot 360 for the matching of the character index to the English, Greek, Math, and standard User-Defined font characters). NumCommands is the number of stroke commands defining the character that follows. CharWidth is the character width, which determines the spacing of the characters.
A command may be in one of the following forms:
-
x y
-
x y
-
dx dy
-
dx dy
Where:
-
A command that begins with an
mis a move command. -
A command that begins with a
dis a draw command. -
Commands
mranddrare relative move and relative draw commands. -
The x and y are the absolute coordinates within the character cell.
-
The dx and dy are the relative coordinates with respect to the previous location (increments from the position attained by the previous command).
-
All coordinates are specified as integers.
Figure 1 shows an example of a character cell and the commands used to define the lowercase letter "y". The height of the character cell is 48.
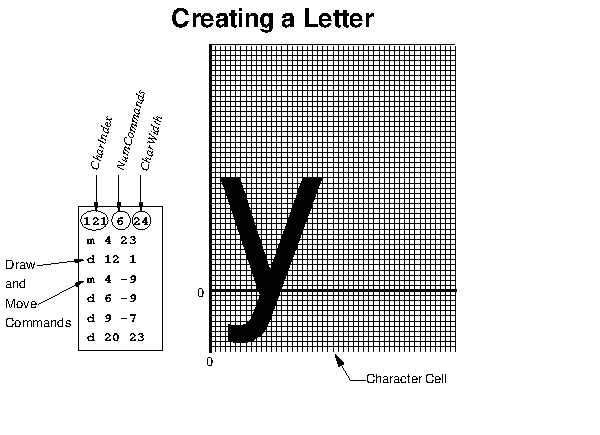
Figure 2 shows a symbol being defined. Symbols should generally be centered about (0, 0) so that they are drawn centered on the point they mark (an exception might be an arrow symbol or similar, where you want the arrow’s tip to indicate the marked point). The font file included with Tecplot 360 contains many User-Defined font stroke commands. Most of these are for creating extra plotting symbols, accessible when you use the Symbol Type "Other", enter an ASCII character, and specify the User-Defined font.