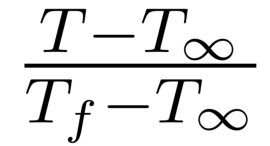
Text, Geometries and Images
You can enhance any plot, or create a drawing from scratch, using Tecplot 360’s text and drawing tools. Tecplot 360 provides tools for creating polylines, circles, ellipses, squares, rectangles, and text. You can also insert BMP, JPEG, or PNG images to enhance your plot.
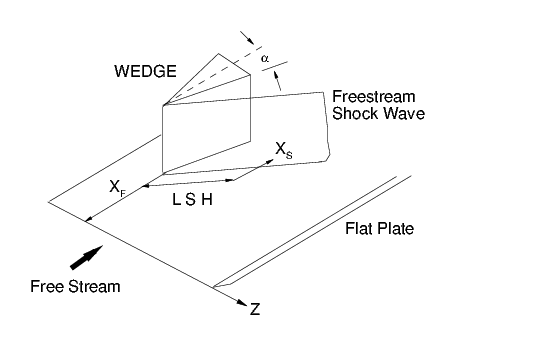
A plot that contains only these add-on elements and no plotted data is referred to as a sketch and can be created with the plot type. Figure 1 shows a sketch created with Tecplot 360 drawing tools.
Text
To add text to your plot or sketch, either select
the tool
 from the Toolbar
or from the . Click anywhere in
a frame to indicate the location of the text. Use the dialog to enter and modify text and its formatting. To create
additional text elements, you may click in the Tecplot 360 workspace
at the desired location of the next text element while the dialog is
open.
You can edit existing text by first choosing the Selector tool,
 then double-clicking the text element to open the dialog. Alternatively, right-click the text element and many of
the text attributes can be changed in the as
well as selecting .
Text Details
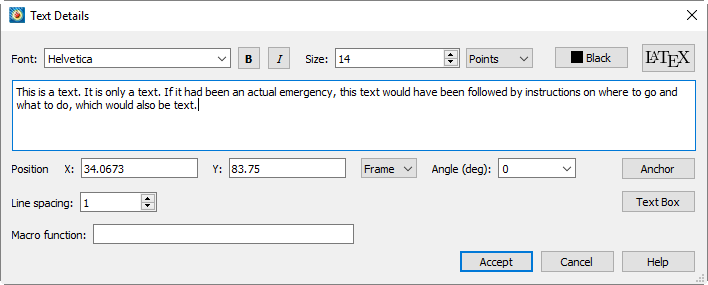
The dialog has the following options:
- Text Entry Field
-
Type the desired text in this box. Text will appear in your plot as you type.
You can embed , , and characters into English-font strings by enclosing them with text formatting tags, together with the keyboard characters. See Custom Character and Symbol Definition for more information on defining your own characters.
The text formatting tags and their effects are as follows (format tags are not case sensitive and may be either upper or lower case):
- <b>…</b>
-
Boldface
- <i>…</i>
-
Italic
- <verbatim>…</verbatim>
-
Verbatim
- <sub>…</sub>
-
Subscripts
- <sup>…</sup>
-
Superscripts
- <greek>…</greek>
-
Greek font.
- <math>…</math>
-
Math font.
- <userdef>…</userdef>
-
User-defined font.
- <helvetica>…</helvetica>
-
Helvetica font.
- <times>…</times>
-
Times font.
- <courier>…</courier>
-
Courier font.
Not all fonts have Bold and/or Italic variants. For fonts that do not have these styles, the <b> and/or <i> tags may have no effect.
Embedding and escaping special characters work only in English-font text; they have no effect in text created in , , or character sets.
You can produce subscripts or superscripts by enclosing any characters with <sub>…</sub> or <sup>…</sup>, respectively. Tecplot 360 has only one level of superscripts and subscripts; expressions requiring additional levels, such as , must be created by hand using multiple Tecplot 360 text strings. If you alternate subscripts and superscripts, Tecplot 360 positions the superscript directly above the subscript. Thus, the string a<sub>b</sub><sup>c</sup> produces . To produce consecutive superscripts, enclose all superscript characters in a single pair of tags. The string x<sup>(a+b)</sup> produces in your plot.
To insert a tag into text literally, precede the first angle bracket with a backslash ("\"). To insert a backslash in the text, just type two backslashes ("\\"). In ASCII input files, the number of backslashes must be doubled (two to precede a special character, four to create a backslash) because the Preplot program also requires a backslash to escape special characters.
| To produce more elaborate math expressions use latex expressions instead. See LaTeX Expressions. |
- Font
-
Select a font for the text. (See Font Folders and Fallback for more information on how fonts work with Tecplot 360.) You may click the
Band I buttons as shortcuts for selecting a bold, italic, or bold italic variation of the chosen font.Not all fonts have Bold and/or Italic variants. For fonts that do not have these styles, the Band/or I buttons may have no effect. - Size
-
Select a character height unit from the drop-down menu, then enter the size in the associated field:
- Points
-
Specify character height in points. One point is 1/72nd of an inch.
- Frame%
-
Specify character height as a percentage of frame height.
- Grid
-
Specify character height in grid units. (Available only when Position By is set to Grid.)
- X/Y Position
-
Choose the position of the text element’s anchor point (see Anchor button).
- Position by
-
Choose to position the text using the frame or grid coordinate system.
- Macro function
-
Enter the name of the macro function to be linked to this text object. See Linking Text and Geometries to Macros for more information. To run the linked macro function, hold down Control while right-clicking the text object in the workspace. (On Mac, hold down Command while right-clicking.)
- Color
-
Select a color for the text using the Color Chooser.
- Angle (deg)
-
Specify the orientation of the text relative to the axis. The angle is measured in degrees counter-clockwise from horizontal. Horizontal text is at zero degrees; vertical text is at 90 degrees. You can either enter an angle in degrees, or select from one of the preset angles in the drop-down.
- Line Spacing
-
Enter the line spacing when multiple lines of text are entered: 1 for single-spacing, 2 for double-spacing, etc. Fractional values are permitted.
- Text Box
-
Opens the Text Box dialog to specify the appearance of the box around the text (if any). See Text Box for more information.
- Anchor
-
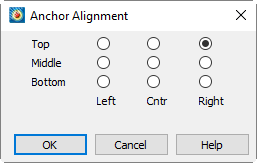
Choose how the text is aligned with the anchor point. As new text is added, the text expands away from the anchor point chosen in the Anchor Alignment dialog.
Font Folders and Fallback
Tecplot 360 supports TrueType (.ttf) and OpenType (.otf) fonts. Fonts installed in the standard folder for fonts on your operating system (for example, C:\Windows\Fonts on a Windows computer) appear in the font selection menu in the dialog and in other places where you choose a font.
If the fonts you want to use with Tecplot 360 are installed in other folders, or if your operating system does not have a default system location for fonts, you can edit the tecplot.cfg file in your Tecplot 360 installation directory, using Notepad or another text editor, to indicate the directories where the fonts you want to use are installed. Add a line like one of the following:
$!Interface FontPath = ' "/font/path" '
$!Interface FontPath = ' "C:\Windows\Fonts" "C:\More Fonts" '
$!Interface FontPath = ' "/first/path/" "/second/path" "/third/path" '
Replace the paths with the paths to the folders that contain the fonts you wish to use, taking special note of the single quote marks that wrap the entire list of folders and the double quotes around each folder’s path. You can use just one or several font folders. As shown in the second example, if you wish to use your computer’s standard fonts as well as fonts from other folders, you must manually specify the standard font folder along with the others.
If you open a layout that specifies a font that Tecplot 360 does not have access to on your system, the text "falls back" to Times. If the layout specifies a style you do not have (for example, a bold version of a font you have but which does not include a bold version on your system), the correct font is used, but the style (boldface, in this case) is not displayed.
It is possible to choose a font by typing its name directly into the font selection field in the dialog and other places where a font can be chosen, instead of choosing the desired font from the provided menu. If the font you specify in this way is not available to Tecplot 360 on your system, the text will appear as Times on your computer. However, the name you typed is recorded when you save a layout, and the text appears in the correct font if the layout is later opened on a computer on which the font is available.
Text Box
Use the dialog (accessed via the Text Box button in the dialog) to control the appearance of a box around the text. The following options are available:
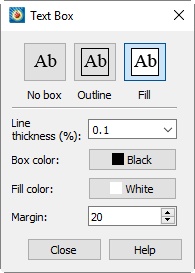
- None
-
Select this option to specify that no box is drawn around the text.
- Outline
-
Select this option to specify an outline box around the text. The box is not filled, so any underlying Tecplot 360 object can still be seen.
- Filled
-
Select this option to specify a filled box around the text. A filled box is opaque; if you place it over another Tecplot 360 object, the underlying object cannot be seen.
- Line Thickness (%)
-
Specifies the thickness of the text box as a percentage of the frame width.
- Box Color
-
Select the box outline color from the dialog.
- Fill Color
-
Select the box fill color from the dialog.
- Margin
-
Specify the margin as a percentage of the text character height.
Special Characters
Tecplot 360 supports Unicode text encoding. Your operating system should provide ways to enter Unicode text in non-English character sets, and any Unicode characters you can enter using these methods will display and print correctly in Tecplot 360.
If your system does not have the ability to enter Unicode text, characters in the ordinal range 160-255 provide support for most of the major European languages. The following table shows the characters in this range supported by Tecplot 360. Note that the two right-hand columns represent the extended European characters. Text formatting tags for Greek, Math, or User-defined characters work only with characters in the range 32-126 and is not available for the extended European characters. If your system is configured for European text entry, the European characters should appear and print automatically with no additional setup.
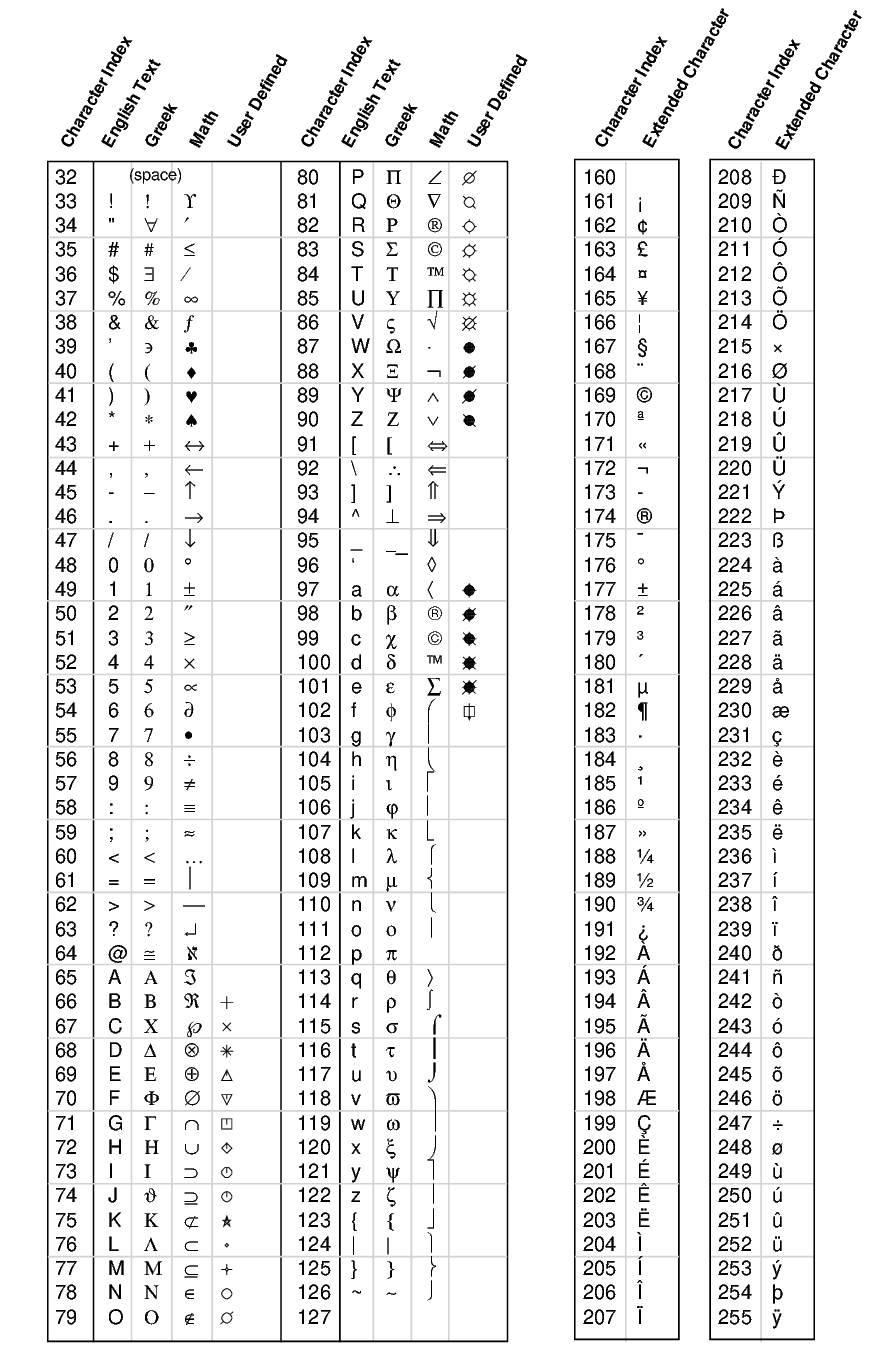
If your keyboard is not configured to produce a
specific character, you can generate it by including the sequence
nnn in your text, where nnn is from the
character index table found in the table. For example, if your keyboard
will not generate the é and you want to show the word "latté," enter:
latt\233Custom Characters
You can create symbols, characters, and even custom fonts for use in Tecplot 360. See Custom Character and Symbol Definition for further instructions.
Dynamic Text
You can add special placeholders, called dynamic text, that change with the data or the display environment. For example, you can add a date placeholder that Tecplot 360 will replace with the current date at each redraw. Similarly, you can add a zone name or variable name placeholder.
For placeholders that represent an attribute of a Tecplot 360 object of which Tecplot 360 supports multiple instances (such as a frame, a dataset, or a zone), the placeholder by default refers to the current or active instance: for example, to the active frame if the placeholder refers to an attribute of frames. If there is no obvious default or active instance, the placeholder by itself usually refers to the first instance.
For such placeholders, you may specify the desired instance of the
referenced type of object by enclosing an index in square brackets
immediately following the placeholder name. For example,
&(AUXZONE[3]:BC) refers to the zone auxiliary data named
BC in the third zone.
In most cases, the index may also be written as
ACTIVEOFFSET=n to specify the nth
active instance of an object type. For example,
&(ENDSLICEPOS[ACTIVEOFFSET=2]) refers to the end position
of the second active slice group.
For placeholders that represent the minimum or maximum value of a variable, the text is appended to the displayed value if it is an estimate calculated from variables in a subzone data file.
The complete list of placeholders is as follows:
| Variables | Notes |
|---|---|
&(AUXDATASET:name) |
The value of the named auxiliary data attached to the dataset. |
&(AUXFRAME:name) |
The value of the named auxiliary data attached to the frame. |
&(AUXPAGE:name) |
The value of the named auxiliary data attached to the page. |
&(AUXVAR[nnn]:name) |
The value of the named auxiliary data attached to variable nnn. |
&(AUXLINEMAP[Q]:name) |
The value of the named auxiliary data
attached to linemap Q, where Q, can be a simple integer n, in which case it
represents the nth linemap or Q can be the expression
|
&(AUXZONE[Q]:name) |
The value of the named auxiliary data
attached to linemap Q, where Q, can be a simple integer n, in which case it
represents the nth fieldmap or Q can be the expression
|
&(AXISMAXn) |
Maximum value of the current n-axis range, where n is one of: A[1], R, X, Y, or Z. |
&(AXISMINn) |
Minimum value of the current n-axis range, where n is one of: A[1], R, X, Y, or Z. |
&(BYTEORDERING) |
Displays the platform’s byte ordering (INTEL or MOTOROLA). |
&(DATE) |
The current date, in the format dd Mmm yyyy. |
&(DATASETFNAME[nnn]) |
Filename of the nnnth file associated with the current dataset. If nnn is omitted, then all dataset filenames are shown, separated by new lines. |
&(DATASETTITLE) |
The current dataset title. |
&(ENDSLICEPOS[Q]) |
The position of the ending slice plane.
If Q is an integer then that represents the nth slice group.
If Q is |
&(EXPORTISRECORDING) |
Returns "YES" if recording is active, otherwise returns "NO". |
&(FRAMENAME) |
The frame name. |
&(INBATCHMODE) |
Returns a value of 1 if the software is in batch mode, 0 if interactive. |
&(ISDATASETAVAILABLE) |
Returns a value of 1 if a dataset exists for the current frame, 0 if nonexistent. |
&(ISOSURFACELEVEL[nnn]) |
The value of the contour variable on the nnnth iso-surface for the first iso-surface group. |
&(ISOSURFACELEVEL[Q][nnn]) |
The value of the contour variable on the nnnth
iso-surface for the iso-surface group represented by Q.
If Q is an integer then that represents the nth isosurface group.
If Q is |
&(LAYOUTFNAME) |
The name of the current layout file. |
&(LOOP) |
Innermost loop counter. |
&(MACROFILEPATH) |
Path to the folder containing the most recently opened macro file. |
&(MAXn) |
Maximum value of the n variable, where n is one of: A[1], R, X, Y, or Z. For 2D or 3D Cartesian plots, the value is calculated from all active zones. For line plots, the value is calculated from the zone assigned to the first active linemap. |
&(MAXB) |
Maximum value of the blanking variable for the first active constraint. For 2D or 3D Cartesian plots, the value is calculated from the active zones. For line plots, the value is calculated from the zone assigned to the first active linemap. |
&(MAXC) |
Maximum value of the contour variable for contour group 1. For 2D or 3D Cartesian plots, the value is calculated from the active zones. For line plots, the value is calculated from the zone assigned to the first active linemap. |
&(MAXI), &(MAXJ), &(MAXK) |
[I, J, K]-dimension of the first active zone. For finite-element zones, MAXI is the number of nodes, MAXJ is the number of elements, and MAXK is the number of nodes per element (cell-based) or total number of faces (face-based) of the first active finite-element zone. |
&(MAXS) |
Maximum value of the scatter sizing variable of the active zones. |
&(MAXU), &(MAXV), &(MAXW) |
Maximum value of the variable assigned to the [X, Y, Z]-vector component of the active zones. |
&(MAXVAR[nnn]) |
Maximum value of variable nnn. |
&(MINn) |
Minimum value of the n variable, where n is one of: A[1], R, X, Y, or Z. For 2D or 3D Cartesian plots, the value is calculated from all active zones. For line plots, the value is calculated from the zone assigned to the first active linemap. |
&(MINB) |
Minimum value of the blanking variable of the first active blanking constraint. For 2D or 3D Cartesian plots, the value is calculated from all active zones. For line plots, the value is calculated from the zone assigned to the first active linemap. |
&(MINC) |
Minimum value of the contour variable of contour group 1. For 2D or 3D Cartesian plots, the value is calculated from all active zones. For line plots, the value is calculated from the zone assigned to the first active linemap. |
&(MINS) |
Minimum value of the scatter sizing variable for the active zones. |
&(MINU), &(MINV), &(MINW) |
Minimum value of the variable assigned to the [X, Y, Z]-vector component for the active zones. |
&(MINVAR[nnn]) |
Minimum value of variable nnn. |
&(NUMFRAMES) |
Number of frames. |
&(NUMPAGES) |
Number of pages. |
&(NUMPROCESSORSUSED) |
Number of processors used. This may be different than the total number on the machine because of the $!Limits MaxAvailableProcessors configuration file command, or because of a product limitation. |
&(NUMVARS) |
Number of variables in the current dataset. |
&(NUMXYMAPS) |
Number of XY-linemaps assigned to the current frame. |
&(NUMZONES) |
Number of zones in current dataset. |
&(OPSYS) |
Displays the current operating system. 1=Linux/Macintosh, 2=Windows. |
&(PAPERHEIGHT) |
The paper height (in inches). |
&(PAPERWIDTH) |
The paper width (in inches). |
&(PLATFORM) |
The platform type (e.g. LINUX or WINDOWS). |
&(PLOTTYPE) |
Plot type of the current frame: 0 for Sketch, 1 for XY Line, 2 for Cartesian 2D, 3 for Cartesian 3D, and 4 for Polar Line. |
&(PRIMARYSLICEPOS [Q]) |
The primary slice position.
If Q is an integer then that represents the nth slice group.
If Q is |
&(PRINTFNAME) |
The name of the current print file. |
&(SLICEPLANETYPE[Q]) |
The type of the slice plane (X, Y, Z, I, J or K-planes).
If Q is an integer then that represents the nth slice group.
If Q is |
&(SOLUTIONTIME) |
The current solution time. |
&(SOLUTIONTIME[Q]) |
Solution time of Q.
If Q is an integer nnn then this represents the solution time for zone nnn.
If Q is |
&(STARTSLICEPOS[Q]) |
The position of the starting slice plane.
If Q is an integer then that represents the nth slice group.
If Q is |
&(STRANDID[n]) |
The strandID of zone n. |
&(STREAMSTARTPOS[nnn]) |
Starting position (X, Y, Z) of the nnnth streamtrace. |
&(STREAMTYPE[nnn]) |
Type (Surface Line, Volume Line, Volume Ribbon, Volume Rod) of the nnnth streamtrace. |
&($string) |
The value of the system environment variable string. |
&(TECHOME) |
Path to the home directory. |
&(TECPLOTVERSION) |
Displays the version number. |
&(TIME) |
The current time, in the format hh:mm:ss. |
&(VARNAME[nnn]) |
The variable name of variable nnn. |
&(ZONEMESHCOLOR[Q]) |
Color of the mesh for zone represented by Q.
If Q is an integer nnn then this represents the mesh color for zone nnn.
If Q is |
&(ZONENAME[Q]) |
The name of the zone represented by Q.
If Q is an integer nnn then this represents the name of zone nnn.
If Q is |
The placeholders should be typed exactly as shown, although the index or offset parameters shown must be replaced with the actual index or offset you wish to use.
You can, of course, embed the dynamic text strings in text records in a Tecplot-format data file, as in the following example:
TEXT CS=FRAME HU=POINT T="&(DATE)"Environment Variables
System environment variables can be accessed directly from Tecplot 360 by using &($string), where string is the name
of the desired environment variable. Using environment variables within
Tecplot 360 can add another degree of flexibility by taking advantage
of your customized environment. If an environment variable is missing,
the environment variable name itself will appear on the screen. Note
that all environment variables are treated as text strings.
Formatting Numbers and Strings
If you want a dynamic text string to be formatted in a specific way, you may include C-style formatting strings in the macro variable specification.
The syntax for including a format string is:
&(DynamicTextString%formatstring)
The formatstring should be in the following format. Note that the flags, the width, and the precision are all optional; only the specifier is required. The square brackets [] are not a part of the format string.
[flags][width][.precision]specifierThe following are available as flags:
- |
Left-justify (default is right justification) |
+ |
Precede positive numbers with + sign (default is sign only for negative numbers) |
space |
A blank space will be written in place of the sign if the number is positive |
0 |
Left-pads numbers with zeroes to fill the specified width (rather than spaces) |
The width specifies the minimum number of characters to be printed. If the dynamic text string is shorter than this length, it is padded with spaces. The string is not truncated if it is longer than this length.
The precision specifies the following:
character strings |
The maximum number of characters to be printed. |
integer values |
The minimum number of digits printed; the number will be padded with leading zeroes to fulfill this requirement. |
floating-point values |
The number of digits to be printed after the decimal point. |
When no precision is specified, the default is 1. When printing a character string value in a fixed-width field, then, you will want to specify the same value for both the width and the precision to achieve the desired result (otherwise you will print a maximum of 1 character due to the default precision of 1).
The following letters may be used as the specifier:
s |
string of characters |
d |
signed integer |
e |
scientific notation with a lowercase "e" |
E |
scientific notation with an uppercase "E" |
f |
floating point |
g |
use %e or %f, whichever is shorter |
G |
use %E or %f, whichever is shorter |
u |
unsigned integer, written out in decimal format |
o |
unsigned integer, written out in octal format |
x |
unsigned integer, written out in hexadecimal (where a - f are lowercase) |
X |
unsigned integer, written out in hexadecimal (where A - F are uppercase) |
Example 1
To display the message Maximum contour value is: xxxxxx where
xxxxxx only has two digits to the right of the decimal place. You would use:
Maximum contour value is: &(MAXC%.2f)If |MAXC| currently has a value of 356.84206 then the resulting string would show:
Maximum contour value is: 356.84Example 2
If, in the above example, you wanted to use exponential format you could use:
Maximum contour value is: &(MAXC%12.6e)Here the result would be:
Maximum contour value is: 3.568421e+02Formatting Dates and Times
For dynamic text strings that represent a date and/or time, such as
&(SOLUTIONTIME), the following may be used:
yy |
Two-digit year ("09") |
yyyy |
Four-digit year ("2009") |
m |
Month number ("3", "12"), or minute if preceded by hours token |
mm |
Zero-padded two-digit month ("09") or minute if preceded by hour token |
mmm |
Abbreviated month ("Oct" for October) |
mmmm |
Full month ("October") |
mmmmmm |
Single-letter month ("O") |
d |
Day of month ("9", "10") |
dd |
Zero-padded two-digit day of month ("09") |
ddd |
Abbreviated day of week ("Sun" for Sunday) |
dddd |
Spelled-out day of week ("Sunday") |
ddddd |
Single-letter day of week ("S") |
h |
Hour ("7", "11") |
hh |
Zero-padded two-digit hour ("07") |
s |
Seconds ("5", "22") |
ss |
Zero-padded two-digit seconds ("04") |
.0, .00, .000 |
Milliseconds to 1, 2, or 3 digits |
am/pm, a/p |
AM/PM indicator. All times are 24-hour unless an AM/PM indicator is included in the format string, in which case 12-hour formatting is used. |
[d], [h], [m] |
Elapsed days, hours, or minutes. |
\- |
Escapes (removes the special meaning of) the following character. May be used if your format string includes static text containing any of the above tokens. |
Example:
Here is a date and time format string for a solution time:
"Recorded on &(SOLUTIONTIME%dddd dd-mmm-yyyy at hh:mm:ss am/pm)"The result would be similar to:
Recorded on Monday 14-Sep-2009 at 04:31:42 PM"LaTeX Expressions
LaTeX is a computer language designed for typesetting. The most popular use of LaTeX is math and Greek fonts for technical purposes. Use the option of the dialog (accessed via the LaTeX Box button in the dialog) to switch between normal and LaTeX text.
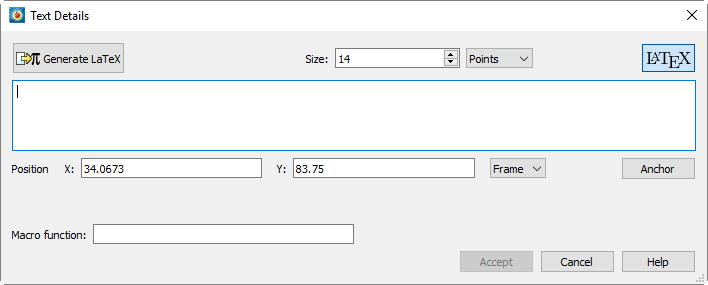
The following options are available:
- Generate LaTeX
-
Renders the LaTeX output based on the current text field.
- Size
-
Select a character height unit from the drop-down menu, then enter the size in the associated field. LaTeX size commands are still valid and will resize relative to the Size value:
- Points
-
Specify character height in points. One point is 1/72nd of an inch.
- Frame%
-
Specify character height as a percentage of frame height.
- Grid
-
Specify character height in grid units. (Available only when Position By is set to Grid.)
- LaTeX
-
Switches between regular and LaTeX output in the text field.
- X/Y Position
-
Choose the position of the text element’s anchor point (see Anchor button).
- Position by
-
Choose to position the text using the frame or grid coordinate system.
- Anchor
-
Choose how the text is aligned with the anchor point. As new text is added, the text expands away from the anchor point chosen in the Anchor Alignment dialog (See Text Details for a complete image of the Anchor Alignment dialog).
- Macro function
-
Enter the name of the macro function to be linked to this text object. See Linking Text and Geometries to Macros for more information. To run the linked macro function, hold down Control while right-clicking the text object in the workspace. (On Mac, hold down Command while right-clicking.).
A few requirements are needed before LaTeX outputs can be generated. In order to generate LaTeX outputs, see LaTeX Setup for more information on how to install recommended LaTeX engines.
LaTeX Examples
Example 1: Mathematical Symbols
LaTeX allows for easy configuration symbol production. The example below shows how to create simple vector and square root symbols:
$$\vec a =\sqrt 2$$The dollar signs denote the start of an equation. The output is shown below:
Example 2: Mathematical Formula
In LaTeX, syntax is crucial to produce a correct output. Each symbol has its own syntax. The formula for Kirchhoff’s current law, for example, is used like so:
Kirchhoff's current law\ldots
\begin{equation}
\sum_{k=1}^{n} I_k = 0 \; .
\end{equation}
Notice in Figure 3 below how the begin and end equations separate the equation from regular text. LaTeX changes paragraph spacing as well as symbols.

To prevent equation numbering, use the \begin{equation*}…\end{equation*} syntax.
|
Example 3: How to add summations in inline text versus display style
Note the difference in typsetting style between inline text style and display style equations.
\noindent
This is the inline text style:
$\lim_{n \to \infty} \sum_{k=1}^n \frac{1}{k^2} = \frac{\pi^2}{6}$.
\newline\noindent
And this is display style:
$$lim_{n \to \infty} \sum_{k=1}^n \frac{1}{k^2} = \frac{\pi^2}{6}$$
or
\begin{equation*} \lim_{n \to \infty} \sum_{k=1}^n \frac{1}{k^2} = \frac{\pi^2}{6}
\end{equation*}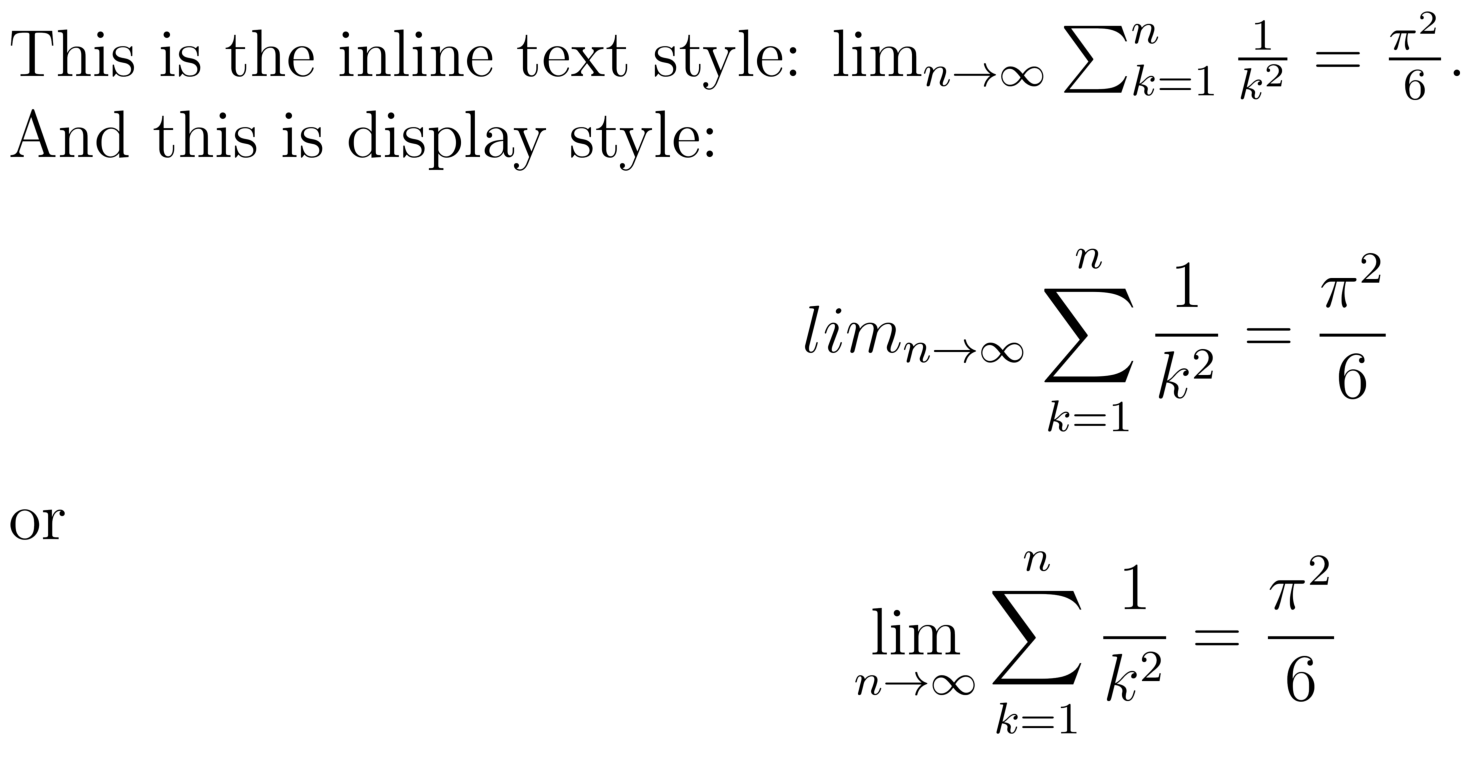
Example 4: Sizing and Accented Phrase
LaTeX allows for easy alphabetical accents. The following example shows the variety of accented phrases that can be accomplished by LaTeX typesetting. The phrase:
\huge ?`D\'onde est\'a el avi\'on? \\Is easily converted to non-English symbols. In LaTeX, these symbols are converted inline with other text allowing fluid transitions between both.

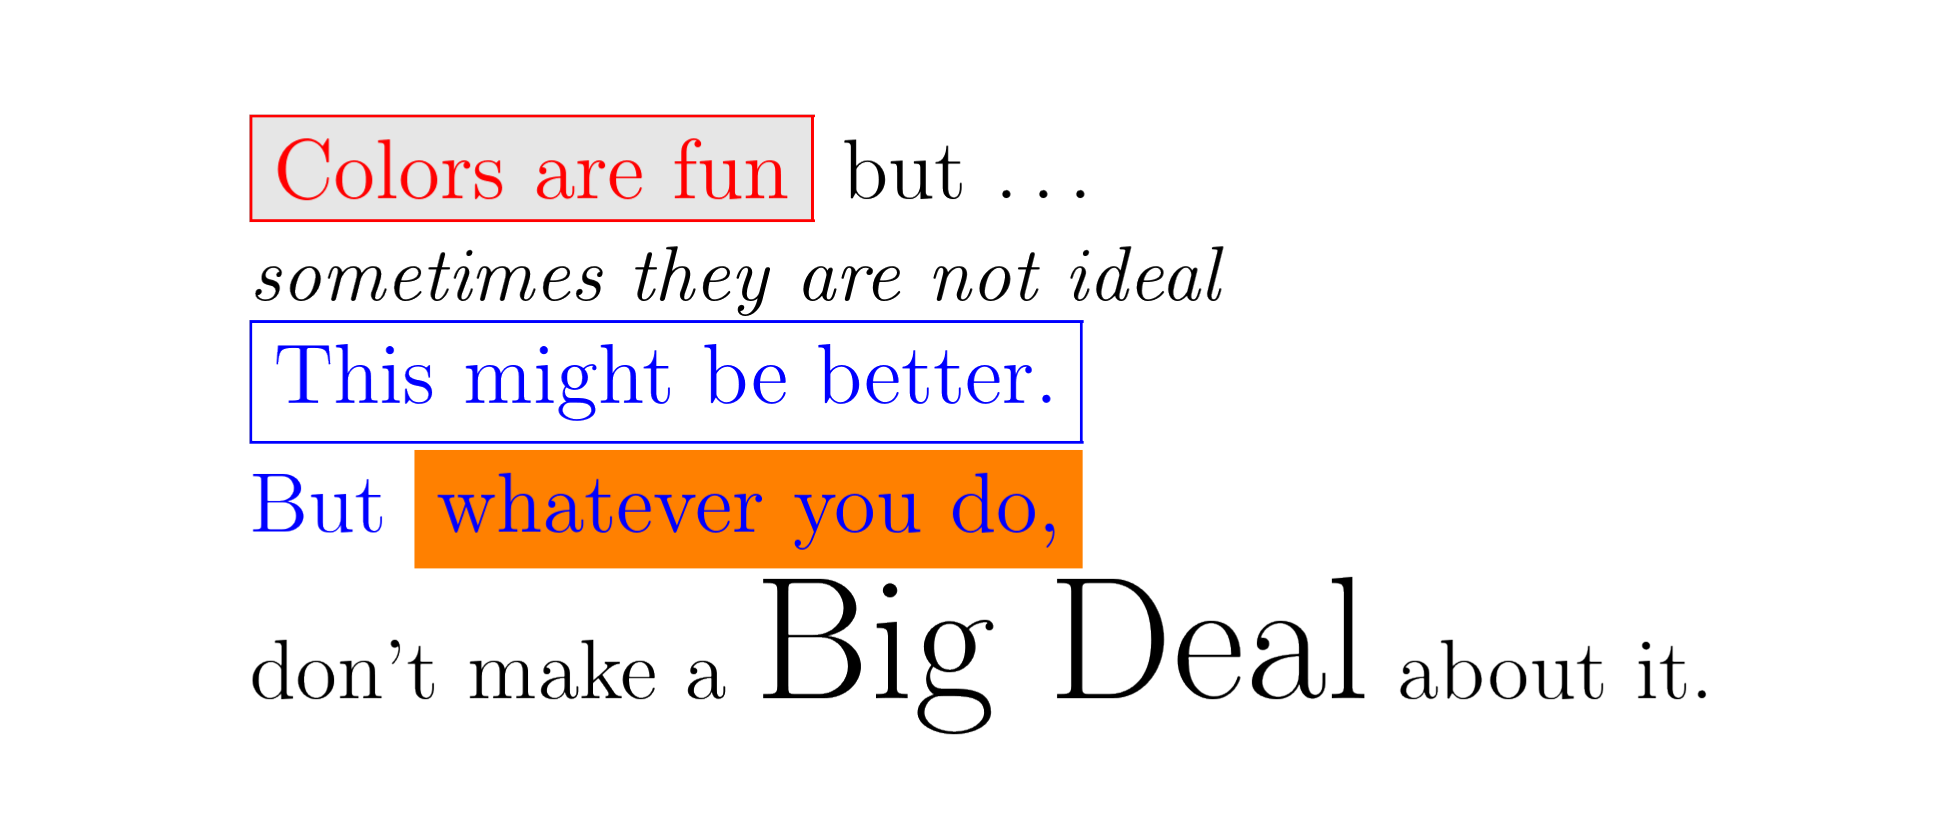
Example 4: Color, Sizing, and Text Boxes
LaTeX allows for easy customizability with certain keywords. Some keywords and formatting are dependent on packages that do not come preinstalled with your LaTeX engine. The following example uses the xcolor package to show custom formatting. To initialize xcolor in the preamble, add the following to the end of the preamble in the tecplot_latex.mcr file:
\usepackage{xcolor}Now your Tecplot 360 installation will be ready to use the xcolor package. Use the following phrases as an example for color, size, and text box formatting:
\fcolorbox{red}{gray!20}{\color{red} Colors are fun} but \ldots \\
\emph{\small sometimes they are not ideal} \\
{\color{blue}\framebox{This might be better.} \\
But \colorbox{orange}{whatever you do,} \\
\color{black}don't make a {\huge Big Deal} about it.
This example shows three different text boxes each with different
parameters. \fcolorbox allows for a colored frame as well as a
background. \framebox has a transparent background and takes the frame
color of whichever color is currently being used. \colorbox creates a
highlight in the color specified. The output is shown below:
Additional Examples
Example 5: Color with Equations
Example of LaTeX color with equations. See Example 4: Color, Sizing, and Text Boxes for information about xcolor package.
$\color{white}\overline{u^\prime v^\prime}$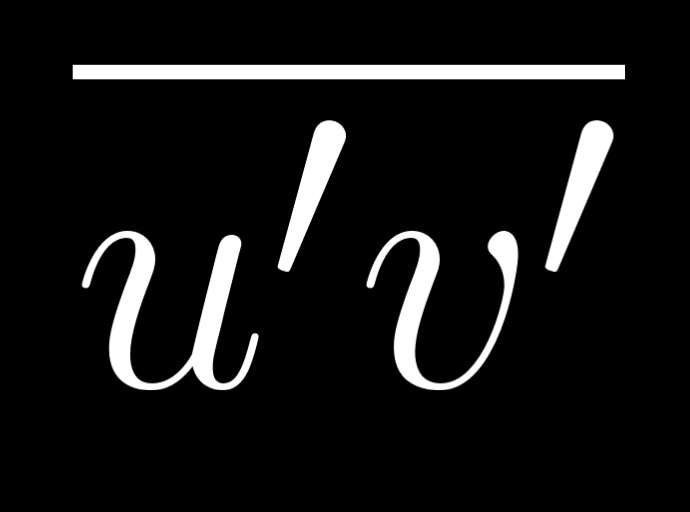
Example 8: Simple Inline Equation
\textbf{Normalized Mean Velocity, $\overline{W}/U_\infty$}
Additional LaTeX Resources
See this page for greek letter and math symbol syntax: www.overleaf.com/learn/latex/List_of_Greek_letters_and_math_symbols
For more examples on LaTeX use, syntax, or concepts check Tobias Oetiker’s PDF, The Not So Short Introduction to LaTeX.
Many frequently asked questions can also be found on the TeX StackExchange website: tex.stackexchange.com/
Geometries
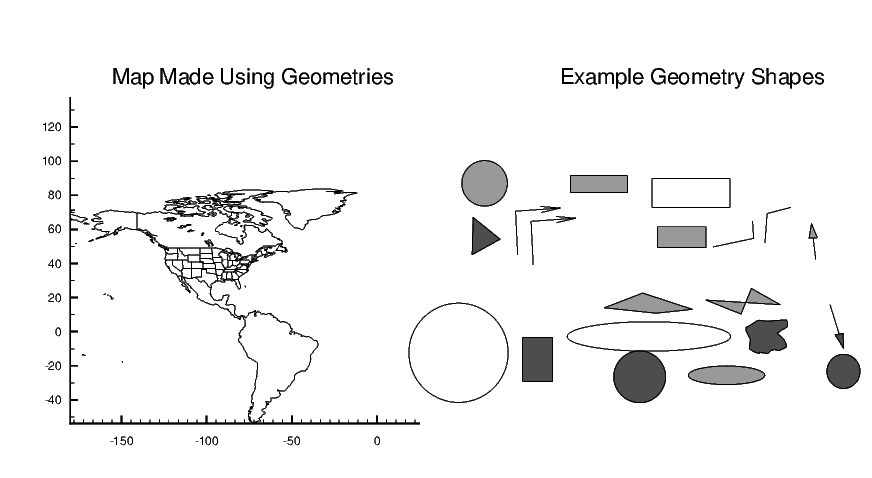
Geometries in Tecplot 360 are simply lines and shapes, including polylines (a set of line segments), circles, ellipses, rectangles, and squares. Images are also considered geometries. Character Indices in Tecplot 360 shows some examples of geometries.
Geometry Creation
Geometries are created by drawing them in a frame using tools from the Toolbar or the menu. (There is no tool for inserting an image; to insert an image, choose ).
Polyline
A polyline is a single geometry consisting of one
or more line segments. Add a polyline to your plot by using the
 button
from the Toolbar or by selecting . To draw the
polyline, move the mouse (without dragging) to the desired end point of
the first line segment, then click the left mouse button. Move the
pointer to the next end point, click, and so on. After placing the last
segment, double-click on the final end point, right-click, or press
Escape on your keyboard. To draw a horizontal or vertical line segment,
press the
 H or V keys, respectively, while
drawing the segment. After you place the segment’s end point, the
horizontal or vertical restriction is lifted. To lift the horizontal or
vertical line segment restriction without placing the end point, press
A on your keyboard. You can draw unconnected line segments
in a single polyline; press U on your keyboard to "lift
the pen." You can then move the pointer to the start of the next line
segment.
A |
Allow translation of polyline segments in all directions. |
H |
Restrict translation of current polyline segment to horizontal. |
U |
Pen up, while drawing polyline. |
V |
Restrict translation of current polyline segment to vertical. |
Circle
Add a circle to your plot by using the
 button from the Toolbar or by selecting . To
draw the circles, click at the desired center point of the circle; drag
the mouse until the circle is the desired radius, then release.
Ellipse
Add an ellipse to your plot by using the
 button from the Toolbar or by selecting . To
draw the ellipse, click at the desired center point of the ellipse; drag
the mouse until the ellipse is the desired size and shape, then release.
Square
Add a square to your plot, using the
 button from the Toolbar or by selecting . The
anchor point of the square is either the lower left-hand corner or the
upper right corner of the square. Drag the mouse to the right of the
anchor to create a square with the anchor at lower left; drag the mouse
to the left to create a square with the anchor at upper right. Release
when the square is the desired size.
Rectangle
Add a rectangle to your plot, using the
 button from the Toolbar or by selecting . To
draw the rectangle, drag the mouse until the rectangle is the desired
size and shape. In contrast to squares, rectangles can propagate in any
direction.
Images
Tecplot 360 can import images from JPEG, BMP, and PNG files. These images can be used as logos or as a backdrop to your plot. To add an image to your plot, choose and browse to the desired image file. When you insert an image, the image is initially centered in the frame at a preset size. It can be resized by dragging its handles (at the corners and at the midpoints of its edges) when it is selected.
Images cannot be included in data files. When you save a data file, even if you indicate that you wish to include geometries, any images in the plot are not saved.
In layout and style sheet files, the image is referenced from its original location. This reference can be a relative reference or an absolute (as with data files). See Layout Files, Layout Package Files, Stylesheets for details.
Images are included in layout package files.
Georeferenced Images
Georeferenced images can be added if they are paired with world files. Valid world files include .bmpw, .bpw, .jpgw, .jgw, .pgw, .pngw, .wld. When a world file is selected in the Insert Image File loader, it will automatically look for a corresponding image file of the same name.
World files supply information about the image’s coordinate system including the location, scale, and rotation of the image on a defined coordinate system. For more information about how each line in a world file represents the coordinate system, see this Wikipedia World File article.
Georeferenced Image Dialog
Displays information about the georeferenced image and allows the georeferenced image to be moved.
- File Name
-
Displays the path of the original georeferenced image file.
- Resolution
-
Displays the original resolution of the georeferenced image in pixels.
- Z Position
-
Enter the Z-coordinate of the anchor position of the georeferenced image.
- Z min
-
Displays the minimum value of the Z-coordinate.
- Z max
-
Displays the maximum value of the Z-coordinate.
- Show in all Frames with the Same Data
-
Toggle-on this option to display the geometry in all frames sharing the active frame’s dataset.
Geometry Details
Use the dialog to specify attributes of
polylines, circles, ellipses, squares, rectangles, and images. To access
the dialog, first choose the
 , then double-click the geometry or image, or right-click it and
choose Geometry Details or Image Details from the context menu. From the
the line and fill attributes can be changed
easier than selecting .
The following options are available for most types of geometries (the line-related options are not, however, available for images):
- Line Color
-
Select a color for the geometry from the Color Chooser.
- Line Pattern
-
Select the desired pattern (Solid, Dashed, Dotted, LongDash, or DashDotDot).
- Pattern Length (%)
-
Specify the length of the line pattern as a percentage of the frame width.
- Line Thickness (%)
-
Specify the thickness of the line as a percentage of the frame width.
- Fill with Color
-
Toggle-on to fill a circle, ellipse, square, rectangle or line segment polygon. Then select a color for the fill using the Color Chooser.
- Clipping
-
Clipping displays only the portion of an object that falls within a specified region of the plot. If you have specified your geometry position in the Frame coordinate system, the geometry will be clipped to the frame: any portion of the geometry that falls outside the frame is not displayed. For this reason, the clipping options are not available for geometries using frame coordinates.
If you have specified the Grid coordinate system, you can choose to clip your geometry to the frame or the viewport. The size of the viewport depends on the plot type as follows:
- 3D Cartesian
-
The viewport is the same as the frame, so viewport clipping is the same as frame clipping. This option is therefore unavailable in 3D Cartesian plots.
- 2D Cartesian/XY Line
-
The viewport is defined by the extents of the X and Y-axes. You can modify this with the page of the dialog.
- Polar Line/Sketch
-
By default, the viewport is the same as the frame. You can modify this with the page of the dialog.
- Draw Order
-
Geometries can be drawn either before the data, or after the data. If a geometry is drawn before the data, the plot layers, such as mesh, contour lines, etc. will be drawn on top of the geometry. If a geometry is drawn after the data, the geometry will be drawn last, obscuring the data.
| You can place text and geometries in any order you like. Tecplot 360 draws all geometries first, in the order in which they were placed, then all text. Use the and commands on the menu to reorder objects. |
- Attach to Zone/Map
-
Toggle-on to attach the geometry to a particular zone or mapping by entering the number of the zone or mapping. Geometries that are attached to an inactive or non-existent zone are not displayed.
- Show in all Frames with the Same Data
-
Toggle-on this option to display the geometry in all frames sharing the active frame’s dataset.
- Macro Function
-
Specify the name of the macro function to be linked to the geometry. See Linking Text and Geometries to Macros for more information. To run the linked macro function, hold down Control while right-clicking the geometry in the workspace. (On Mac, hold down Command while right-clicking.)
- Coordinate System
-
Specify the coordinate system for the geometry ( or ). When created, screen objects default to the grid coordinate system. Changing the coordinate system automatically converts position and size fields so that the geometry will remain in the same place at the same size in the current view.
- Frame
-
The geometry is always displayed at constant size and position when you zoom in or out of the plot.
- Grid
-
The geometry resizes and moves with the data grid. However, the geometry remains fixed when you rotate the plot. Changing the center of rotation may cause the geometry to move.
- X, Y
-
Enter the X and Y-coordinates of the anchor position of the geometry (in frame units if the coordinate system is frame; in grid units if the coordinate system is grid). This point is the center for a circle, the upper left corner for a rectangle, etc.
The following fields are specific to a single geometry type:
- Polyline
-
The Arrowhead Style options control the appearance of an arrowhead on the polyline.
- Attachment
-
Choose the end or ends of the polyline by selecting the appropriate check boxes.
- Style
-
Plain, filled, or hollow.
- Size(%)
-
Specify the size of the arrowhead as a percentage of frame height.
- Angle
-
Specify the angle the arrowhead makes with the polyline.
- Circle
-
Controls the radius and precision of approximation of the circle:
- Radius
-
Set the radius of the circle (in coordinate system units, or ).
- Number of Sides
-
Enter the number of polylines used to approximate the circle.
- Ellipse
-
Controls the shape and precision of approximation of the ellipse:
- Horizontal Axis
-
Set the horizontal axis of the ellipse (in coordinate system units, or ).
- Vertical Axis
-
Set the vertical axis of the ellipse (in coordinate system units- or ).
- Number of Sides
-
Enter the number of polylines used to approximate the ellipse.
- Square
-
Controls the size of the square:
- Size
-
Set the size of the square (in coordinate system units, or ).
- Rectangle
-
Controls the size and shape of the rectangle:
- Width
-
Set the width of the rectangle (in coordinate system units, or ).
- Height
-
Set the height of the rectangle (in coordinate system units, or ).
- Image
-
Displays information about the image and allows the resizing method to be set.
- File Name
-
Displays the path of the original image file.
- Resolution
-
Displays the original resolution of the image in pixels.
- Filter
-
The Resize filter determines how the image is resized to fit the screen. The following filters are available:
- Fast (textures) (default)
-
Tecplot 360 uses Vulkan textures to resize the image. This is the fastest option (given sufficient graphics space). However, the accuracy of the image may suffer, especially when reducing an image to a size much smaller than it was before.
- Pixelated
-
Choose this option when the image is much larger than its original size and you want to see the individual pixels. This option is slower than the Fast (textures) for increasing the size of images.
- Smooth
-
There are seven smooth options, all producing slightly different effects. These options are slower than the Fast (textures), but produce better effects for highly reduced images. In general, use the Smooth (Lanczos2) option unless you have specific image processing needs.
| The resize filter has no effect on vector-based output, only on the screen and for exported images. |
Three-dimensional Line Geometries
Three-dimensional line geometries cannot be created interactively; they must be created in a data file or using an add-on. In order to display 3D geometries, you must either include at least one zone in the data file with the 3D geometries or read the 3D geometries in, using the option, after having first read a dataset into the frame.
Linking Text and Geometries to Macros
Each text or geometry you create, or image you insert, can be linked to a macro function. This macro function is called when you hold down the Control key (Command key on Mac) and click the right mouse button on the text or geometry or image. Macro functions are specified with the Macro Function field in the dialog or in the dialog (accessed by selecting your object and right-clicking.
In order to be attached to a text or geometry object, the macro function must be a "retained" macro function. A macro function is "retained" via either of the following scenarios:
-
running a macro file that contains the required macro functions
-
including it in your tecplot.mcr file (which is run at startup, kmaking it a special case of the preceding scenario)
In both cases, the macro function is defined using the
$!MACROFUNCTION macro command. Refer to the Scripting Guide for additional information.
