Probing Plots
The tool  allows you to
select a location in your plot and view the values of all variables at
that location in the Probe sidebar. You can also view information about
the dataset itself while probing. With the dialog
(accessed via ), you can specify the location of
the probe as a set of spatial coordinates X, Y, and Z, one of the polar
coordinates Theta and R, or as a set of I, J, and K-indices. You select
one or more locations in the data field where information is to be
collected, and the resulting information is displayed in the
sidebar.
When you probe with the mouse, you can probe in either of two modes: or . In mode (accessed by a single mouse click) the value returned is the linearly interpolated value for the specified locations. In mode, accessed by Control-click, the value returned is the exact value at the closest data point in the field.
|
If Tecplot 360 appears to be unloading variables that you are trying to Probe, you may need to adjust your memory threshold in . Refer to Load On Demand for additional information. |
Field Plot Probing with the Mouse
The most direct method of probing is to use the tool
 .
Click at any
point in your plot to probe in mode, which
displays the Probe sidebar with information interpolated for that point.
Control-click at any location to probe in mode,
which will obtain probe information for the data point closest
to the crosshair cursor and display it in the Probe sidebar.
The following table shows the information returned for each type of probe action for field plots. (All mouse click operations are using the left mouse button.)
| Probe Action | Information Returned |
|---|---|
Click |
If the pointer is over a valid cell, the value returned is the interpolated field values from all nodes in the cell. 2D Cartesian plots - If multiple cells are candidates, the cell from the highest-numbered zone is used. 3D Cartesian plots - The closest cell in a zone, slice, iso-surface or streamtrace is selected. If multiple cells are candidates, the cell closest to the viewer is used, with priority given to surfaces drawn with mesh, flooded contours, or shading. Translucent zone surfaces are excluded from probing priority. |
Control-Click |
If the pointer is over a valid cell, the field value from the nearest node in the cell is returned. If multiple cells are candidates:
|
Shift-Control-Click |
Return the field values from the nearest point on the screen (ignoring surfaces, zone number or depth of the point). This is useful in 3D for probing on data points that are on the back side of a closed surface without having to rotate the object. In 2D this is useful for probing on data points for zones that may be underneath other zones because of the order in which they were drawn. |
Alt-Click (3D only) |
Same as Click except ignore zones while probing. (Probe only on streamtraces, iso-surfaces, or slices.) |
Alt-Control-Click |
Same as Control-Click except ignore zones while probing. (Probe only on streamtraces, iso-surfaces, or slices.) |
Alt-Control-Shift-Click |
Same as Shift-Control-Click except ignore zones while probing. (Probe only on streamtraces, iso-surfaces, or slices.) |
The probe results are displayed in the sidebar. To copy data from the Probe sidebar, select the range of cells to be copied by dragging (or by clicking a start position, then Shift-clicking an end position), then right-click and choose Copy from the context menu.
| Interpolate mode does not work for I-ordered data displayed in a 2D or 3D Cartesian plot; if you probe such data you will always get the error message "Point is outside of data field," because Tecplot 360 cannot interpolate without a field mesh structure. You should instead use the Nearest Point mode in such situations. |
Field Plot Probing by Specifying Coordinates and Indices
Use the dialog for precise control over your probe location, probing using I, J, and K-indices, or probing inside a 3D volume. You can launch the dialog from the menu.
Probe at Position
To probe at a specified location using spatial coordinates (in Interpolate mode), launch the dialog via the menu or the sidebar.
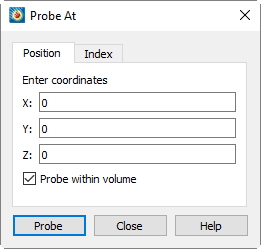
The page of the dialog has the following options:
- Enter Coordinates
-
Enter the X, Y, and Z-coordinates of the desired probe location.
- Probe Within Volume [DEFAULT]
-
If the zone you are probing is a 3D volume zone, toggle-on to ensure that the probe is performed at the indicated point. If you specify a position within a 3D volume zone and the is not selected, Tecplot 360 probes at the surface of the zone nearest to the user.
- Probe
-
Select the [Probe] button to perform the probe. The sidebar will display the interpolated values for the specified location.
| If the entered location is not within a cell, Tecplot 360 will return the closest surface to the entered location along the line-of-sight ray. |
Probe at Index
To probe at a specified location using dataset indices (in mode), launch the dialog (accessed via the menu or the Probe sidebar) and select the page (shown below).
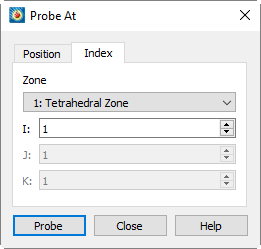
The page of the dialog has the following options:
- Mapping/Zone
-
Select the desired zone or mapping from the drop-down.
- I, J, K
-
Enter the I, J, and K-indices of the desired probe location. (For finite element and I-ordered data, you can enter only the I-index. For IJ-ordered data, you can enter both I- and J-indices. For IJK-ordered data, you can enter I, J, and K-indices.)
- Probe
-
Select the [Probe] button to perform the probe. The sidebar will display interpolated values for the specified location.
Probe Sidebar
You can view probed data in the sidebar, which appears automatically when probe results need to be displayed. It can also be opened from the Data menu.
The Probe sidebar initially appears docked on the right side of the workspace, but it can be docked to the left side as well, or combined with other sidebars. It may also be "torn off" from the workspace and dragged anywhere on any of your displays.
You can choose what the sidebar displays via the tabs along its side. (The tabs may appear on either the right or left side of the sidebar depending on where it is docked.) Available tabs are:
- Variable Values
-
Examine values of all variables at any selected location.
- Cell Center Values
-
Examine values of all variables at the center of the clicked-on cell.
- Zone and Cell Information
-
Report characteristics of any location in a data field. The characteristics reported include the indices of the selected cell or point, the zone number, the dimensions of the zone, and the type of zone (ordered or finite element).
- Face Neighbor
-
Examine neighboring cells of the clicked-on cell.
The display formatting of variable values can be selected in the or tabs. Select Integer, Float, Exponent, or Best Float from the Format drop-down menu. Floating-point precision can be specified in the Precision field when either the Float or Exponent format is selected. These options do not affect the actual data, only how it is displayed.
To copy data from the Probe sidebar, select the range of cells to be copied by dragging (or by clicking a start position, then Shift-clicking an end position), then right-click and choose Copy from the context menu.
Variable Values
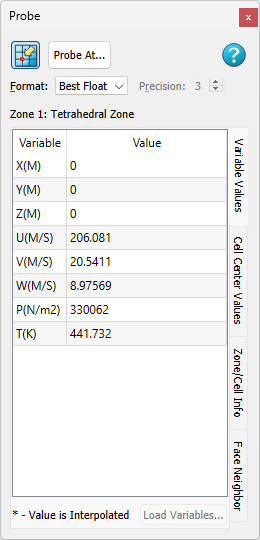
Choosing the tab in the sidebar lists every variable in the current dataset, together with its value at the specified probe point. The zone name and number and the current solution time (if the data set contains transient data) also appear.

The button opens the Probe At dialog (see Field Plot Probing by Specifying Coordinates and Indices). Click the Load Variables button to open the dialog and load any variables you wish to view when probing.
Cell Center Values
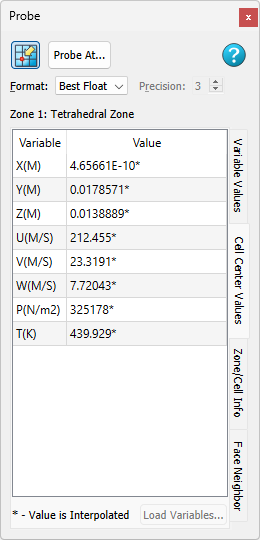
Choosing the tab in the sidebar lists the value of every variable in the current dataset at the center of the cell that was selected. The Zone name and number and the current solution time (if the data set contains transient data) are also displayed.
The button opens the Probe At dialog (see Field Plot Probing by Specifying Coordinates and Indices). Click the button to open the dialog and load any variables you wish to view when probing.
Zone and Cell Information
Choosing the tab in the sidebar lists the following information about any probed data point, regardless of the format of the data.
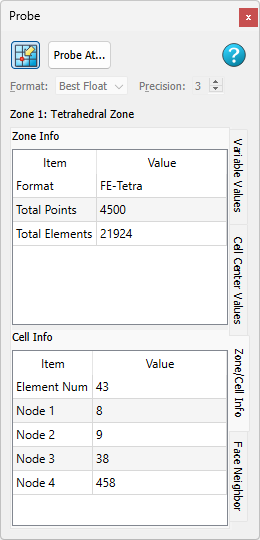
The following information appears:
-
The number and name of the probed zone.
-
The format of the zone, either ordered or one of the finite element formats (FE-Triangle, FE-Quad, FE-Tetra or FE-Brick).
-
The Current Solution time of the probed point.
For ordered zones, the following additional information is displayed:
-
I-Max - Maximum I-index of the zone.
-
J-Max - Maximum J-index of the zone.(J-Max is one for I-ordered data.)
-
K-Max - Maximum K-index of the zone. (K-Max is one for IJ-ordered data).
-
Plane - Shows the type of plane. I, J, or K displays the index of the point at the principal data point of the cell containing the probed point. (If the point is probed using Control-click for , the label reads "I,J or K-Index.")
-
Face Plane - The I, J, or K-plane that is probed.
-
Face Indices - The planes that are not mentioned in Face Plane, these are the other faces that are showing in 3D, or are the axes in 2D.
|
Index values are not displayed for subzone data sets (.szplt) since these values cannot currently be reliably determined with this file format. |
For cell-based finite element zones (FE-Triangle, FE-Quad, FE-Tetra or FE-Brick), the following additional information is displayed:
-
Total Pts - Total number of points in the zone.
-
Total Elems - Total number of elements (cells) in the zone.
-
Node Num - Number of the probed node. This field is filled in only if the point is probed using Control-click for Nearest Point.
-
Elem Num - Number of the probed element.
-
Node 1 - 8 - Number of the node defining Node 1-8 of the cell.
-
Node 4 - FE-Quad, FE-Tetra, and FE-Brick only.
-
Node 5-8 - FE-Brick only.
The button opens the Probe At dialog (see Field Plot Probing by Specifying Coordinates and Indices).
Face Neighbor
Choosing tab in the sidebar displays cells that neighbor the selected cell.
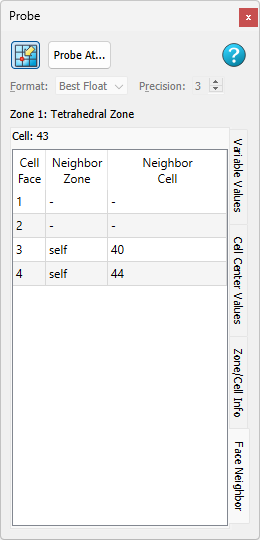
The button opens the Probe At dialog (see Field Plot Probing by Specifying Coordinates and Indices).
A cell is considered a neighbor if one of its faces shares all nodes in common with the selected cell, or if it is identified as a neighbor by face neighbor data in the dataset. The current solution time is also displayed.
For ordered (IJ or IJK) zones, cell numbers are defined by the index value of the first node
where, i, j, and k are the i, j, and k values for the location of the first node.
Because the number of nodes in each direction is one greater than the number of cells in that direction, there is no cell to correspond with the last point in each row. In the example below, there is no cell numbered "3", yet the first cell in the second row is numbered "4". As you define face neighbors, it may help you to think of a "ghost cell" at the end of each row (where I = MaxI) and at the end of each column in 3D (where J = MaxJ).
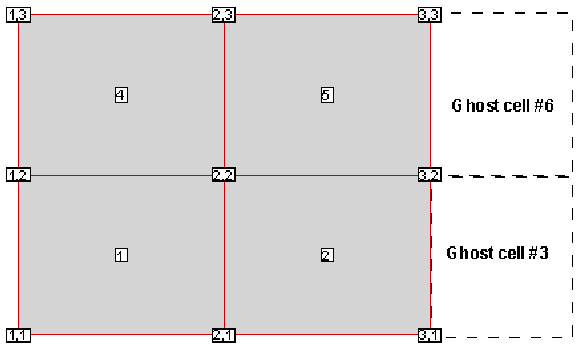
For FE zones, the cells are numbered in the order that they appear in the connectivity list. In the following example "7 8 19 11" is the cell number 2:
Example connectivity list of 3 cells:
2 4 8 19
7 8 19 11
1 2 4 5
Line Plot Probing with the Mouse
You may probe XY and Polar Line plots in much the same way you probe field plots. You can use the probe mouse mode to obtain interpolated variable values at any given location, or obtain exact values from a specified (X, Y) or (Theta, R) data point. When you probe an XY Line plot in the standard mode, Tecplot 360 displays a vertical or horizontal line, depending on whether you are probing along an X- or a Y-axis. When you probe a Polar Line plot, a radial line or a circle is displayed depending on whether you are probing along the Theta- or R-axis. In either case, the probe is performed along the displayed line (or circle).
To probe in interpolate mode: activate the probe tool and click anywhere on your plot. Axis variable values of all active mappings that lie along the probe line are interpolated and displayed in the Probe sidebar.
To probe in mode, activate the probe tool and Control-click anywhere on your plot. When you Control-click, Tecplot 360 displays the exact X and Y, or Theta and R-values of the data point closest to the location clicked.
Line Plot Probing in Interpolate Mode
mode is the standard probe mouse mode in line plots just as for field plots. For XY Line plots, you can probe along any of Tecplot 360’s five X-axes, or along any of Tecplot 360’s five Y-axes. By default, probing is performed along the X1 axis. For Polar Line, probing is done along the Theta-axis by default.
| In Polar Line plots, many combinations of Theta- and R-values can result in the same point on the screen. When using the mouse in Interpolate mode to probe along the Theta-axis, Tecplot 360 uses the Theta-value within the current Theta-axis range to determine the corresponding R-values reported in the Probe sidebar. This behavior may result in no probe information shown for a mapping that has Theta-values entirely outside the current Theta-axis range, even though the mapping crosses the probe line on the screen. (For example, probing along the Theta-axis in interpolate mode misses a mapping representing only Theta-values several cycles outside the current Theta-axis range.) Similarly, when using the mouse in Interpolate mode to probe along the R-axis, Tecplot 360 uses the R-value within the current R-axis range and may miss mappings that are shown on the plot but have R-values different from the R-axis range. |
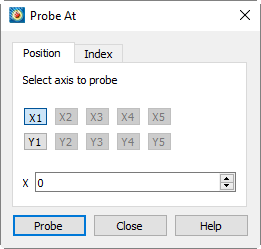
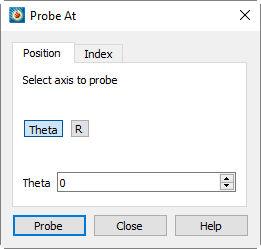
To enter the mode, choose Probe At from the Data menu. the dialogs for XY and Polar Line plots are shown below:
|
|
Select the button corresponding to the axis you want to probe along, then enter the position. Click to perform the probe.
The sidebar appears if it is not already visible, For interpolated values, the sidebar lists every active mapping and the interpolated value the opposing axis variable for that mapping. The value along the probed axis is listed at the bottom of the Probe sidebar.
In the sidebar, the probe value is dashed (---) if the probe is out of range for the mapping. The probe value is gray (inactive) if the mapping is not using the specific axis which you are probing (for example, you probe the X1 axis and the mapping uses the X2 axis). This will only happen in XY Line plots with multiple X or Y-axes.
By default, each mapping is shown on a single line, which allows display of about the first ten characters of the mapping name and seven significant digits of the variable value.
- X-Value, Y-value
-
X, Y-value of the nearest data point to the probe position.
- I, J, of K-Index
-
I, J or K-index of the nearest data point to the probe position.
- Map
-
Number and name of the nearest map to the probe position.
- Zone
-
Number and name of the nearest zone to the probe position.
- I, J, or K-Max
-
Maximum I, J or K-index of the current zone.
- X or Y-Axis
-
X or Y-axis associated with the current map.
|
Index values are not displayed for subzone data sets (.szplt) since these values cannot currently be reliably determined with this file format. |
Line Plot Probing in Nearest Point Mode
probe mode provides the exact X and Y or Theta and R-values of the data point closest on the screen to the probed location, together with information on the mapping and the zone to which the probed point belongs. If a data point is common to multiple mappings, the probe returns information on the highest numbered mapping. For example, if a data point is plotted as part of two mappings, numbered 1 and 2, the probe results are displayed for mapping 2.
To enter the mode select the tool,
 from the Toolbar and Control-click at the desired probe location. The
nearest point is calculated from the actual location of the cross-hair
and is independent of the axis you were probing along.
The following information about the nearest data point is displayed in the Probe sidebar:
-
X or Theta-value.
-
Y or R-value.
-
I, J, or K-index.
-
The number and name of the mapping associated with the data point.
-
The number and name of the zone referenced in the mapping.
-
The maximum I, J, and K-indices of the zone.
-
For XY Line plots, the X-axis and Y-axis associated with the mapping.
Data Editing
Using the tool, you can actually modify the coordinates of your data with the mouse. See Adjustor Tool for more information.
| If you attempt to double-click, but move the mouse between clicks, you may find that you have moved your data point. |