Blanking
Blanking allows you to exclude specific portions of zones from being plotted (in other words, selectively display certain cells or data points) based on variable values. In 3D, the result is analogous to a cutaway view.
Blanking settings apply only to the active frame, but Value Blanking settings for multiple frames may be synchronized using frame linking. Refer to Frame Linking for more information on linking. Blanking results for volume zones depend upon the Surfaces to Plot setting on the Surfaces page of the dialog (See Surfaces for more details).
In the following discussions, the term "cell" is used. In I-ordered datasets, a cell is the connection between two adjacent points. In IJ-ordered datasets, a cell is the quadrilateral area bounded by four neighboring data points. In IJK-ordered datasets, a cell is the six-faced (hexahedral) volume bounded by eight neighboring data points. For finite element datasets, a cell is equivalent to an element.
The forms of blanking are as follows:
- Value Blanking
-
Cells (or portions of cells) of selected zones or line plot mappings are excluded based on the value of the value blanking variable at the data point of each cell or at the point where each cell intersects a constraint boundary.
- IJK Blanking
-
Cells of one IJK-ordered zone are included or excluded based on the index values. (IJK-ordered zones only)
All types of blanking may be used in a single plot. They are cumulative: cells blanked from any of the options do not appear. Value Blanking and Depth Blanking affect selected zones of all types, while IJK Blanking affects a single IJK-ordered zone.
In general, all types of blanking affect all field layers, zones, and all other plot attributes except for edge layers. with the following exceptions:
| Type of Blanking | Attribute Not Blanked |
|---|---|
Value Blanking |
Edge Layer |
IJK Blanking |
1. Derived Objects can opt in or out of blanking. (See Blanking Settings for Derived Objects.)
|
Value Blanking
Value blanking allows you to selectively eliminate or trim cells (only) and elements from Line and 3D field plots. For each active constraint, you specify a value blanking variable, a constant value or another variable, and a conditional statement telling Tecplot 360 to blank that region in relation to the specified variable or constant.
Value Blanking for Field Plots
To include value blanking in your plot, go to the menu and select . The dialog has the following options:
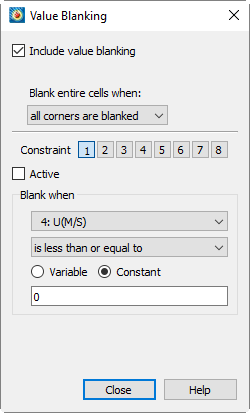
- Include Value Blanking
-
Toggle-on to include value blanking.
Note that it is possible to edit the settings in the Value Blanking dialog without actually activating blanking. This can make it faster to set up blanking since the plot won’t need to redraw after every change of settings.
- Blank entire cells when
-
Select one of the following blanking styles:
- All corners are blanked
-
Cells are removed from the plot if all of their data points satisfy one or more of the active blanking constraints.
- Any corner is blanked
-
Cells are removed from the plot if any of their data points satisfy one or more of the active blanking constraints.
- Primary value is blanked
-
Cells are removed from the plot based on the primary value for a cell. The primary value for the cell is dependent upon the zone type and the variable value location, as outlined in the following table.
Zone Type Value Location Source of Primary Value Ordered
Cell Centered
Cell value
Finite element
Cell Centered
Cell value
Ordered
Nodal
Lowest indexed corner in the cell
Finite element
Nodal
First node in the connectivity list for the cell
Refer to the Zone/Variable Info Page of the dialog to determine the Zone Type and Value Location.
- Constraint
-
You can establish up to eight value blanking constraints. Click a numbered button here to choose the constraint to be added or changed.
- Active
-
Toggle-on to activate the chosen constraint.
- Blank when
-
For each constraint, set the following parameters:
-
Select the variable to use for value blanking.
It is often convenient to create a new variable for use as the value blanking variable. This allows you to manipulate its values without changing any other part of the plot. You can create a new variable using the dialog (accessed via ). See Equation Syntax. -
Specify an operation to describe how the blanking variable will be compared to the constant or variable following it.
-
Choose to compare the blanking variable to either another variable or to a constant. If you are comparing to a variable, select the variable; if comparing to a constant, enter the constant.
-
- Show Constraint Boundary
-
Toggle-on to display a line that separates the region of your data that is blanked from the region which is not blanked. Set the appearance of this line using the following controls:
- Color
-
Select the color of the boundary in the Color Chooser.
- Line Pattern
-
Select the line pattern for the boundary.
- Pattern length
-
Select the length of the pattern as a percentage of frame height.
- Line thickness
-
Select the width of the boundary line as a percentage of frame height.
Value Blanking has no effect on edges of an ordered zone. If the edge is turned on, the edge of the entire zone (without value blanking) is plotted.
The following figure illustrates the various value blanking modes for plots.
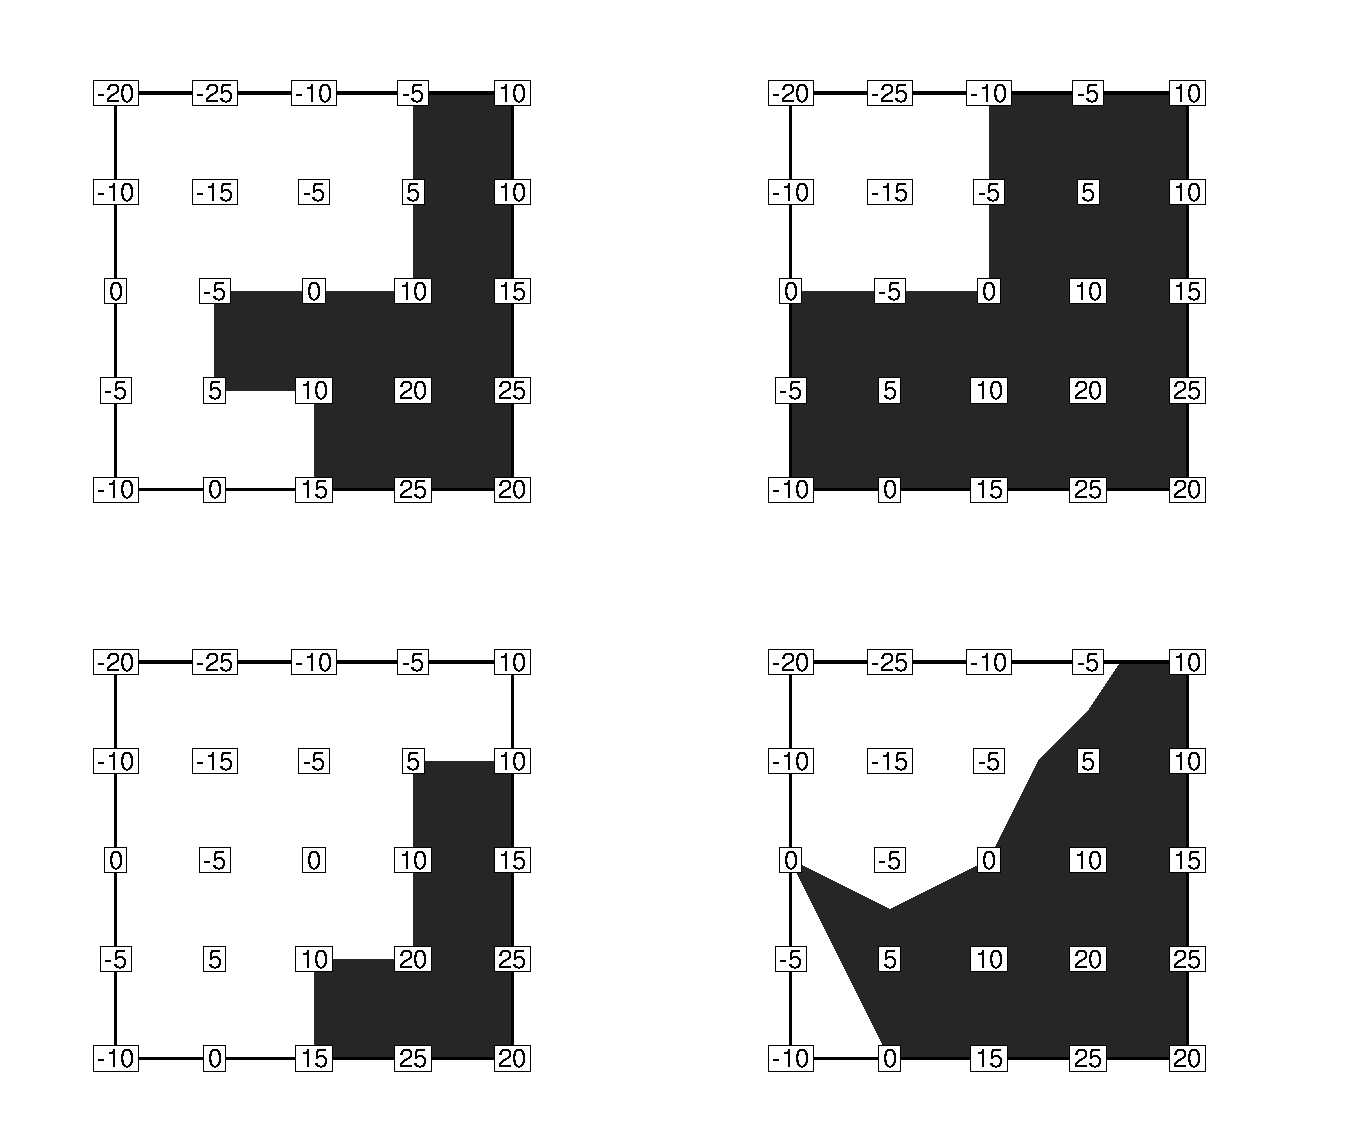
Value Blanking Settings for Individual Zones
Using the Effects page of the dialog (accessed via the menu or the Plot sidebar), you can turn value blanking on and off for individual zones. Simply highlight the zone(s), and toggle the checkbox in the Use Value Blanking column.
Value Blanking for Line Plots
For line plots, value blanking excludes data points from consideration in the resulting plot. The settings are the same as for Value Blanking for Field Plots, except that you cannot choose the behavior of blanking relative to cells, as this does not apply to line plots.
As alternatives or adjuncts to value blanking, you can use the Indices page of the dialog to limit index ranges per mapping. The Curves page can provide another form of blanking by allowing you to limit the range of the independent variable for individual mappings.
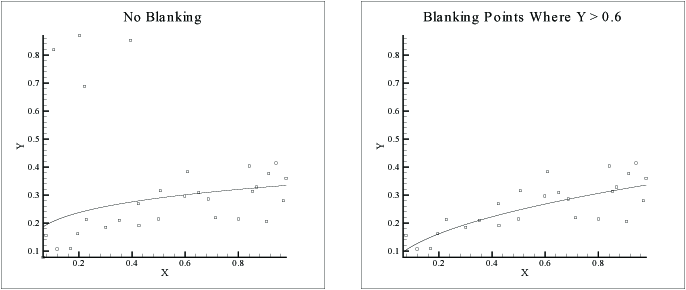
Figure 2 shows two plots. The original data for the plots contain some "bad" data points. The bad data points were identified as those with a Y-value greater than 0.6. The plot on the left uses all data points, including the bad data points, to draw a curve. The plot on the right has filtered out the bad data points by using value blanking, where all points are removed if Y → 0.6. Blanking does not necessarily have to be on the independent or dependent variable.
IJK Blanking
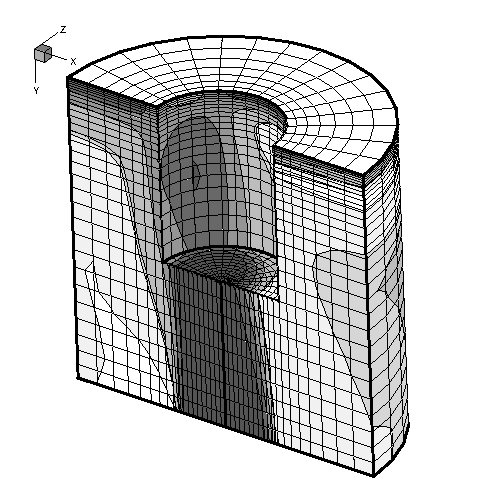
IJK Blanking is available for 2D and 3D ordered zones, in the 2D and 3D Cartesian plot types. IJK Blanking removes a selected portion of one IJK-ordered zone from the plot. This allows you to create cutaway plots: plots showing the exterior of some dataset with a section "cut away" to show the interior, such as the plot shown in Figure 3.
| To use IJK-blanking, you must have a 2D or 3D IJK-ordered zone, and the current plot type must be 2D or 3D Cartesian. Unlike Value Blanking, which operates on all zones within a single frame, IJK Blanking can only be used on a single zone within a frame. |
To use IJK-blanking, select from the menu.This option is available only when your data set has at least one IJK ordered zone.
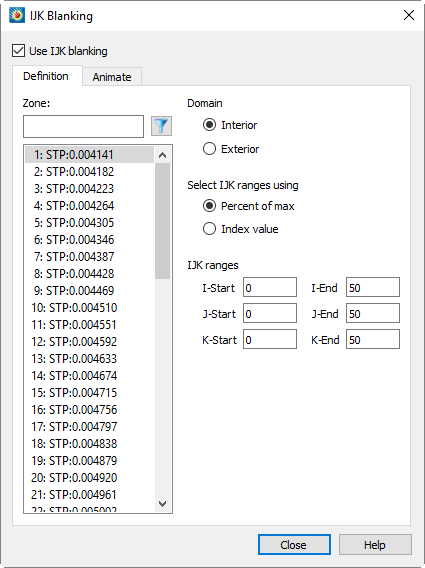
The checkbox at the top of this dialog turns IJK blanking on or off. The Definition page has the following options.
- Use IJK Blanking
-
Toggle-on to include IJK Blanking in your plot.
- Zone
-
Select the zone to which to apply IJK Blanking by clicking in the displayed list of IJK ordered zones. You may select only one zone.
If your data set has many zones, it is useful to filter the zone list. Type part of a zone name and press Enter (or click the filter button next to the zone name field) to display only the zones having a name containing the entered text.
- Domain
-
Specify the domain of the IJK Blanking by choosing one of the following options:
- Interior
-
Cells within the specified index ranges are blanked. Those outside are plotted. This creates a "hole" in the zone. The left side of Figure 4 shows an ordered zone with IJK Blanking with Interior domain.
- Exterior
-
Cells outside the specified index ranges are blanked. Those inside are plotted. Exterior plots a sub-zone of the zone. The right side of Figure 4 shows an ordered zone with IJK Blanking with Exterior domain.
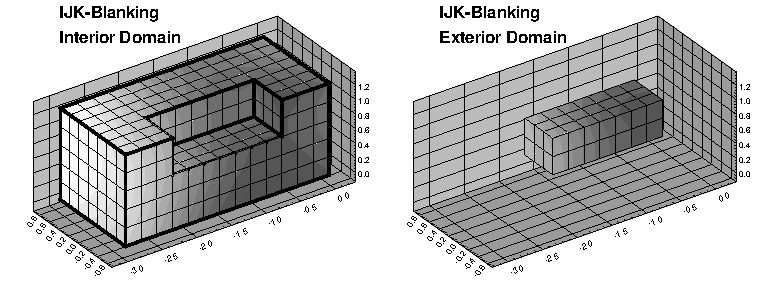 Figure 4. IJK Blanking with Interior domain (left) and Exterior domain (right).
 - Select IJK ranges using
-
Specify the format in which you will specify the index ranges by selecting one of the following option buttons:
- Index Value
-
Specify the I, J, and K-index ranges using absolute index values.
- Percent of Max
-
Specify the I, J, and K-index ranges as start and end percentages of the maximum index. For example, you could blank the middle third of a dataset by setting the start percentage to 33.3 and the end percentage to 66.6.
When you save a layout, macro, or stylesheet, the IJK Blanking index ranges are stored as the percentage of the maximum index regardless of how you chose to enter them. This way, one layout can easily be used for data sets containing zones of various sizes.
For information on using the Animation page, see IJK Blanking Animation.
Blanking Settings for Derived Objects
You can opt to turn blanking on or off for derived objects (iso-surfaces, streamtraces, or slices) in their respective dialogs.
- Iso-surfaces
-
The option is located on the Style page of the dialog (click the
 button to the right of Iso-Surfaces in the Plot sidebar). Refer to
Iso-Surface Contour and Shade for details.
 - Streamtraces
-
The option is located on the Integration page of the dialog (click the
 button to the right of Streamtraces in the Plot sidebar). Refer to
Integration Page for details.
 - Slices
-
The option is located on the Definition page of the dialog. Refer to Definition Page for details.