Tecplot 360 Utilities
The following utilities are included with the Tecplot 360 distribution:
-
Excel Add-In - Allows you to load Excel spreadsheet data directly into Tecplot 360 from inside Microsoft Excel.
-
LPK View - A utility to catalog, preview or unpack a layout package file into its component data and layout files.
-
Preplot - A utility to convert an ASCII data file into a Tecplot binary file.
-
Pltview - A utility to view the header information for a Tecplot binary file.
Excel Add-In
The provides a convenient way to load data directly from your Microsoft Excel spreadsheet into Tecplot 360. When loaded, it adds a Tecplot section to the Add-Ins ribbon, which contains a button that lets you open the highlighted region of the spreadsheet in Tecplot 360. (In older versions of Excel, previous to the ribbon user interface, this command appears on the Tools menu and as a button in the toolbar.)
| The Excel Add-In is available on Windows platforms only and requires Microsoft Excel be installed. Visual Basic for Applications, a component of Microsoft Office, must also be installed; if you receive an error about the workbook having lost its VBA project, make sure that Visual Basic for Applications is installed by using the Programs and Features dialog (Add/Remove Programs in older versions of Windows) to modify your Microsoft Office installation. Visual Basic for Applications can be found under the Office Shared Features heading in the Office installer. |
The Excel add-in features:
- Highlight and Plot
-
It’s easy to plot just a portion of your data. Click in the upper left cell of the region or highlight the entire region, and then click on the Tecplot button in the Add-Ins ribbon or toolbar or on the Tecplot option in Excel’s menu.
- Multiple Zones
-
The makes loading multiple zones much easier. Highlight the entire region and then click on the Tecplot button in the Add-Ins ribbon or toolbar or on the Tecplot option in Excel’s menu. If your zones are separated by blank rows or columns, the add-in will automatically detect them and load them into Tecplot 360.
- Formulas
-
The highlighted region of the spreadsheet can contain formulas, or can be created entirely with formulas.
The first time you use the Excel Add-In, you will be prompted to choose the Tecplot 360 executable to be launched from Excel. This will be the tec360.exe file in the bin folder of your Tecplot 360 installation. Your choice will be remembered and you will not be asked again unless the Excel Add-In cannot find the previously-chosen executable. A button in the Tecplot section of the Excel ribbon (or the Tools menu), Find Tecplot, will allow you to choose a different Tecplot 360 executable if you have upgraded or wish to use the Excel Add-In with more than one installed version of Tecplot 360.
A Read Me file, located in the Util/Excel directory, further describes installation and use of this add-in.
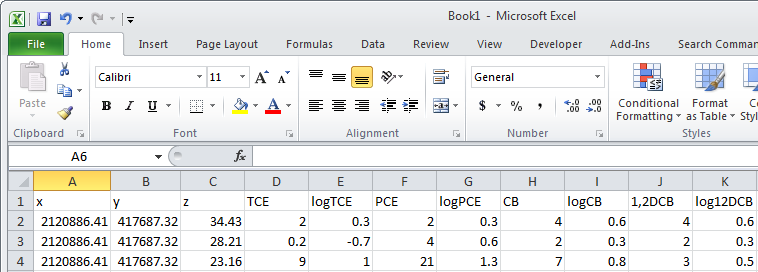
As an example, let’s say you have 3D data obtained by drilling a number of wells and measuring contaminant concentrations of various chemicals at different depths. Your data is in an Excel spreadsheet, and you want to load the data into Tecplot 360 to get a visual representation of the contamination. The data has nine variables and twenty-seven zones. A small part is shown in Figure 1.

| Make sure you have a blank row separating the zones in your Excel spreadsheet. |
Perform the following steps to import your data and visualize the contaminant plumes:
-
Starting with the top left-hand cell, highlight all twenty-seven zones and nine variables.
-
Click on Tecplot in Excel’s Add-Ins ribbon. The menu option launches Tecplot 360 with the selected data loaded.
-
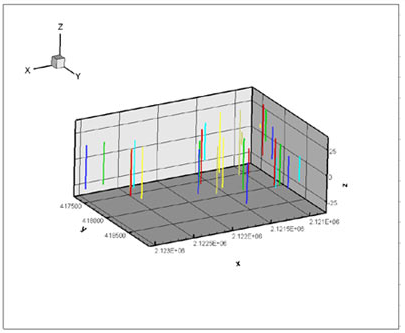
Switch to 3D Cartesian plot mode to see the location and measurement depths of the well samples. The resulting plot is shown in Figure 2.

Your wells have different depths, so the number of measurements are not the same for each well (there are only three measurements at well five).
LPK View
As a convenience a command line utility, lpkview, is provided to catalog and unpack layout packages. In its simplest form (when no options were included), the utility to unpack the preview image (if present), the layout, and all associated data files into the directory in which the utility was run.
For example:
lpkview myplot.lpkmight unpack the following files in the current directory:
myplot.png
myplot.lay
myplot_1.plt
myplot_2.plt
myplot_3.plt
Tecplot 360 determines the names for unpacked files when the package is created. Tecplot 360 eliminates name conflicts within the package by appending unique numbers to non-unique names. However, no attempt is made by lpkview to ensure that names are unique with other files located in the directory where the items are unpacked.
The utility’s syntax is as follows:
lpkview [[-t] | [-ild] | [[-c <preview command>] -p]] filenameBrackets ([]) surround optional parameters and the vertical
bar (|) separates one mutually exclusive set of options
from another. The options are described as follows:
-t |
Show table of contents. |
-i |
Extract image (for example, a Portable Network Graphics or .png format). |
-l |
Extract layout. |
-d |
Extract data. |
-c |
Specify preview command. The executable must be in a directory specified in the PATH or else a complete pathname. In the specified command, %s is substituted with the path of the temporary preview image exported by lpkview. (Mac/Linux only) |
-p |
Preview image using the command specified with -c. (Mac/Linux only) |
Option -t may not be used with any other options, and options -i, -l, and -d may not be used with options -c and -p. If no command line options are specified -i, -l, and -d are assumed by default.
Preplot
The Preplot executable included in the standard Tecplot 360 installation converts Tecplot format ASCII data files to binary data files. The following options are available:
-d |
Turn on debug echo. Use -d2, -d3, -d4 for more detailed debug information. |
-foreignplt |
Reverse the bytes of the output binary data file (generally not required). |
-iset [zone], [start], [end], [skip] |
Create the binary data file using only the specified range and skipping for the I-index. The zone parameter specifies which zone this option affects; if not specified, all zones are affected. The start parameter is the starting I-index; the default is one. The end parameter is the ending I-index; the default is the last index value. The skip parameter specifies the I-interval, that is, the distance between indices; one means every index is used, two means every other index, and so on. For example, -iset 1, 3, 7, 2 indicates that for zone 1 only I-index values of 3, 5, and 7 are used. Only one -iset option is allowed per zone. |
-jset [zone], [start], [end], [skip] |
Same as -iset above, except with respect to the J-index. |
-kset [zone], [start], [end], [skip] |
Same as -iset above, except with respect to the K-index. |
-zonelist start[:end[:skip]], … |
Specify the zones to process. You may supply more than one specification. By default Preplot processes all zones. |
Pltview
Pltview is a command line utility to examine the header information for binary Tecplot data files. It is included in your Tecplot 360 distribution and installed in the bin directory. To run pltview:
-
Launch the Command Prompt
-
Navigate to the bin directory of your Tecplot 360 installation.
-
in the command prompt, type:
pltview "fullpath/filename.plt"You must enter the full path for your file.
-
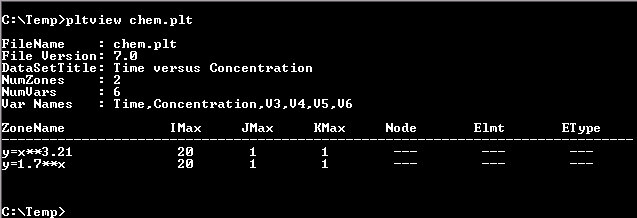
The command prompt will display:
-
File Name
-
File Version
-
File Type
-
Data Set Title
-
Number of Zones
-
Number of Variables
-
Variable Names
-
Auxiliary Data
-
I, J and K Max for each ordered zone
-
Total number of Nodes, Elements, Faces, as well as the element type, for each finite element zone
-
An example session using the pltview utility is shown here.
