Add-Ons
Add-ons are a way to extend the basic functionality of Tecplot 360. They are executable modules designed to perform specific tasks. A number of add-ons are available that load data in a variety of formats, allow advanced editing, or extend Tecplot 360’s capabilities.
Add-ons are external programs that attach themselves to Tecplot 360 and are accessed through the Tecplot 360 interface. When Tecplot 360 launches, it goes through various initialization phases, including the processing of the tecplot.cfg file, the loading of the Tecplot 360 stroke font file (tecplot.fnt), and the initialization of the graphics. After completing this, Tecplot 360 looks for add-ons.
Add-on Loading
You can load add-ons by several different methods: using the Drag-and-Drop Method, editing the Tecplot.add File, using the Specifying Add-Ons on the Command Line, or by Specifying a Secondary Add-On Load File.
| Add-ons created for versions of Tecplot 360 prior to Tecplot 360 2014 R1 will not work with Tecplot 360 2025 R2. |
Drag-and-Drop Method
The easiest method for loading an add-on for a single use is the drag-and-drop method. This method loads the add-on for the current session of Tecplot 360 (rather than every subsequent launch of Tecplot 360).
To use this method, find the library file of the add-on you wish to load in the bin subdirectory of your Tecplot 360 installation. Select the library, and, while holding down the mouse button, drag the library into the Tecplot 360 window. Then release the mouse button to "drop" the add-on into Tecplot 360. The add-on will be loaded and made available immediately.
This action will load the add-on only for the rest of the current Tecplot 360 session. The next time you close and reopen Tecplot 360, you will need to load the add-on again if you wish to in the new session.
Tecplot.add File
Every time Tecplot 360 launches, it reads a file called tecplot.add from the Tecplot 360 home directory and loads all add-ons indicated in that tecplot.add file.
The tecplot.add file contains multiple
$!LoadAddOn commands that load add-ons into Tecplot 360.
This special macro file accepts only $!LoadAddOn macro
commands, which require this syntax:
$!LoadAddOn "libname"
In this example, libname represents the name of an add-on’s shared object library file. The libname must be enclosed in quotes.
To unload an add-on (that is, to prevent Tecplot 360 from loading that add-on when launching), comment out the appropriate line in tecplot.add by adding a pound ("#") symbol in front of the load command. For example, the pound ("#") symbol at the beginning of the following line will prevent the Auxiliary Data Editor add-on (libname "tecutiltools_editauxdata") from loading:
# $!LoadAddOn "tecutiltools_editauxdata"
To load an add-on that does not load automatically, remove the pound
("#") symbol from in front of the $!LoadAddOn command that
includes the libname of the add-on you wish to load. If the
tecplot.add file does not list the libname of the add-on
you wish to load, add a $!LoadAddOn command followed by the
libname of that add-on.
For information on loading the tecplot.add file, see Custom Files loaded on Startup.
Libname
Special rules govern how the libname name is specified in the tecplot.add file. In all cases, the filename extension is omitted. If you assign libname to the basename of the shared object library, then Tecplot 360 will do the following:
- Linux
-
The shared library to load will come from the file specified by Install-Directory/lib/lib+basename.so.
- Windows
-
Tecplot 360 will search for the add-on basename.dll in the following directories (in this order):
-
The directory where the Tecplot 360 executable resides.
-
The Windows system directories.
-
The directories in your
PATHenvironment variable.
-
When using V7ActiveX style add-on libraries on Windows,
Tecplot 360 connects to the add-on via the libname entry in
the registry.
If an absolute path name is used in libname, then on Windows platforms, .dll is appended and on Mac and Linux platforms, .so is appended
Specifying Add-Ons on the Command Line
You can also instruct Tecplot 360 to load a particular add-on by including the following option when running Tecplot 360 from the command line:
-loadaddon <libname>
where <libname> is the full name (including path and extension) of an addon and
-loadaddon can be omitted if the filename given uses the standard library extension for
your operating system (.dll for windows and .so for Mac and
Linux).
You may also load more than one addon from the command line.
After add-ons are loaded, Tecplot 360 re-processes all command line arguments not processed earlier (for graphics and add-on initialization). This allows a data loader add-on to be used to load data specified on the command line.
Specifying a Secondary Add-On Load File
You may also instruct Tecplot 360 to load a different list of add-ons by naming a second add-on load file using one of the following methods:
-
Include
-addonfileaddonfilename on the command line. -
Set the environment variable
TECADDONFILE.
Both of these methods tell Tecplot 360 the name of an additional
add-on load file to process (which itself contains $!LoadAddon commands).
This secondary file will be processed after the main tecplot.add file.
Add-ons included in the Tecplot 360 distribution
Your Tecplot 360 installation includes the add-ons listed following (alphabetically) and described in Working with Add-ons. Some of these load automatically with your installation; others require you to load the add-on by uncommenting the appropriate line from your tecplot.add file (located in your Tecplot 360 home directory), or by any of the other methods described in Add-on Loading.
Working with Add-ons
The default Tecplot 360 installation includes the add-ons discussed in this section. To load or unload them, use the methods described in Add-on Loading.
Advanced Quick Edit
The Advanced Quick Edit add-on, with the libname tecutiltools_advqet, loads automatically, and causes the "Advanced Quick Edit Tool" to appear in the menu. This add-on allows you to make rapid changes to text and geometries selected in the active frame.
If this add-on is disabled and you would like to enable it,
uncomment the line $!LoadAddon "tecutiltools_advqet"
in your Tecplot.add File or use one of the other methods to load addons
described in Add-on Loading.
To use this add-on, select "Advanced Quick Edit Tool" in the menu to open the dialog.
Controls in the dialog are active only when you have one or more text and/or geometries selected. Some controls are specific to either text or geometries, while others apply to both. If the selected objects are a mix of text and geometries, the controls that apply only to geometries will affect the specific geometries you have selected. Similarly, controls that apply specifically to text will only affect text, even if the selected objects are a mix of text and geometries.
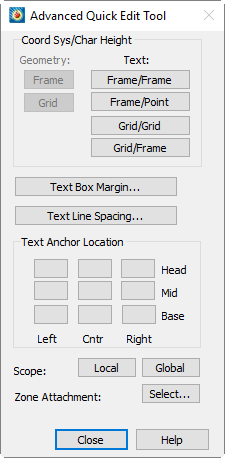
The dialog includes the following options:
- Geometry Coordinate System
-
Change selected geometries to the Frame or Grid coordinate system by selecting the appropriate button in the region of the dialog. Changing the coordinate system in this dialog will modify each geometry’s anchor position and size so that it appears visually unchanged in your plot.
- Text Coordinate System and Character Height Units
-
Change the position coordinate system and character height units of all selected text by selecting the appropriate button in the Coord Sys/Char Height region of the dialog. There are four valid combinations: [Frame/Frame], [Frame/Point], [Grid/Grid], and [Grid/Frame]. Changing a coordinate system in this dialog will modify each text object’s anchor position and character height so that it appears visually unchanged in your plot.
- Text Box Margin
-
Change the text box margin of all selected text with the [Text Box Margin] button.
- Text Line Spacing
-
Change the line spacing of all selected text by using the [Text Line Spacing] button.
- Text Anchor Location
-
Change the text anchor location for all selected text by selecting one of the nine possible anchor points from the button grid located in the Text Anchor Location region of the dialog.
- Text and Geometry
-
Change the scope of all selected text and geometries by selecting either [Local] or [Global] scope. Objects with local scope appear only in the frame in which they were originally created. If the objects are defined as having global scope they will appear in all "like" frames, that is, those frames using the same data set as the one in which the objects were originally created.
- Text and Geometry Zone or Map Attachment
-
Change the zone or map with which the selected text or geometries are associated by selecting Zone Attachment [Select]. This calls up the dialog. The dialog lists zone names or numbers when Tecplot 360 is in the 2D or 3D Cartesian or Sketch plot types, and mappings when Tecplot 360 is in the XY Line plot type. The "<Unattach Object>" entry dissociates each selected text or geometry from its zone or map.
Auxiliary Data Editor
The Auxiliary Data Editor add-on loads automatically with Tecplot 360. This add-on enables you to edit auxiliary data within Tecplot 360 and journal the results into the saved layout file.
If this add-on is disabled and you would like to enable it,
uncomment the line $!LoadAddon "tecutiltools_editauxdata"
in your Tecplot.add File or use one of the other methods to load addons described
in Add-on Loading.
| Auxiliary data are name-value pairs associated with a data set, frame, line map, page, variable, or zone, which Tecplot 360 stores as text strings. You can view all auxiliary data included in your layout in the dialog (by going to ). |
To use this add-on, select "Auxiliary Data" from the menu to open the dialog.
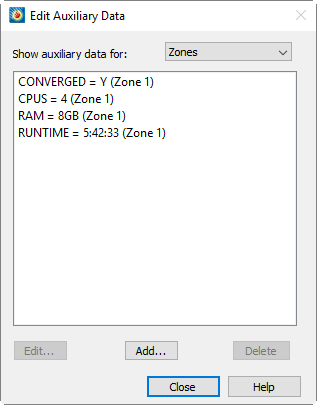
The dialog contains the following controls:
- Show auxiliary data
-
In the drop-down menu at the top of the dialog, select the level at which you wish to view, add or delete auxiliary data. Choose from Zones, Variables, Line Maps, Active Frame, Active Page, Data Set, Layout, or Everything.
- Auxiliary data box
-
In the box in the middle of the dialog, all auxiliary data for the selected level will display. You can select any item in this box to edit it or delete it, with the [Edit] button or [Delete] button, respectively.
- Add auxiliary data
-
With the [Add] button, you can add auxiliary data at any of the available locations (zone, variable, etc.).
- Edit auxiliary data
-
With the [Edit] button, you can edit any existing auxiliary data. First select the item you wish to edit in the Auxiliary data box, and then select the [Edit] button.
- Delete auxiliary data
-
Use the [Delete] button to delete any existing auxiliary data. Select the item you wish to delete in the Auxiliary data box, and then select the [Delete] button.
You can view auxiliary data on the Aux Data page of the dialog (accessible by going to ).
Tecplot 360 will journal all added or edited auxiliary data to layout and packaged layout files when you save your layout or packaged layout file after editing the auxiliary data.
Macro Commands
You can add auxiliary data using the $!EXTENDEDCOMMAND
macro, with the following syntax:
$!EXTENDEDCOMMAND
  COMMANDPROCESSORID = 'Aux Data Editor'
  COMMAND = '<operator> Name = <string> Value = <string> Location = <location> LocationIndex = <int>'
Where:
| Command Entity | Notes |
|---|---|
<operator> |
Choose one of |
Name = <string> |
For <string> use an alphabetic character followed by zero or additional alphanumeric characters and underscores (no spaces) |
Value = <string> |
Only used with the |
Location = <location> |
For <location> use one of: Zone, Var, Frame, Page, DataSet, LineMap, or Layout. |
LocationIndex = <int> |
For <int> provide the integer value representing which Zone, Var, Frame, or LineMap to which Tecplot 360 attaches the auxiliary data. If adding auxiliary data to a Page or DataSet, do not indicate a LocationIndex. |
Following is an example of a macro command adding an auxiliary data piece named "TestID" with the value of "Sequence 23, test 2" to the first zone.
$!EXTENDEDCOMMAND
  COMMANDPROCESSORID = 'Aux Data Editor'
  COMMAND = 'Add Name = TestID Value = "Sequence 23, test 2" Location = Zone LocationIndex = 1'
Adding Auxiliary Data
The dialog enables you to add auxiliary data at any of several levels. To reach this dialog, select the [Add] button in the dialog. Data added in the dialog will subsequently appear in the dialog, in the Auxiliary Data display box. The dialog has the following controls:
- Location
-
Choose the level at which to add the data from the Location drop-down menu. You can choose to add it at the zone, variable, line map, active frame, active page, layout, or dataset level.
- Number
-
When the Location indicates "Zone", "Variable", or "Line Map", the Number box will activate for you to specify the Zone Number, Variable Number, or Line Map number at which to add the auxiliary data.
- Name
-
Enter the name of your data in the Name box.
- Value
-
Enter the value of your data in the Value box.
Select the button in the dialog to finish adding a piece of auxiliary data to the selected location.
Create Multiple Frames
Use the Create Multiple Frames add-on to make a set of new frames with uniform size and spacing within the active frame.
If this add-on is disabled and you would like to enable it,
uncomment the line $!LoadAddon "tecutiltools_mulframe"
in your Tecplot.add File or use one of the other methods to load addons described
in Add-on Loading.
To use this add-on, select in the menu. This will open the dialog.
The dialog has the following options:
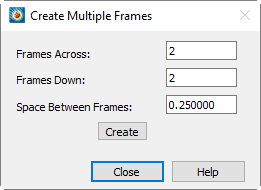
- Frames Across
-
Enter the number of frames to be displayed in each row of frames.
- Frames Down
-
Enter the number of rows of frames.
- Space Between Frames
-
Enter the amount of space to display between each frame in each direction, in paper ruler units.
Select the [Create] button to create the multiple frames as specified.
See Frame Creation for information on creating a single frame.
Extend Macro
The Extend Macro add-on, libname
"tecutilscript_extendmcr", extends the Tecplot macro language to include
additional commands.
If this add-on is disabled and you would like to enable it,
uncomment the line $!LoadAddon "tecutilscript_extendmcr"
in your Tecplot.add File or use one of the other methods to load addons described
in Add-on Loading.
You may use the Extend Macro add-on by adding the following function call to your macro file:
$!EXTENDEDCOMMAND COMMANDPROCESSORID='extendmcr' COMMAND='command option'
The commands supported by the add-on are listed in the following table
| When specifying a macro variable name in an Extend Macro command, you should not surround the variable name with vertical bars. For example, ZONENUM rather than |ZONENUM|. |
| Command | Notes |
|---|---|
QUERY.ZONENAMEBYNUM nnn VVV |
Get the string for zone nnn and assign to variable VVV. |
QUERY.VARNAMEBYNUM nnn VVV |
Get the string for variable nnn and assign to variable VVV |
QUERY.ZONENUMBYNAME "zonename" VVV |
Get the number of zone named zonename and assign to variable VVV |
QUERY.VARNUMBYASSIGNMENT assignment VVV |
Get the number of variable by assignment and assign to variable VVV. VVV may have any of the following values:
|
QUERY.DATASETTITLE VVV |
Get the string for the dataset title and assign to variable VVV |
STRING.LENGTH StrSource VVV |
Get the length of string |
STRING.FINDPATTERN StrSource StrPattern VVV |
Get the sub-string from |
STRING.SUBSTRING StrSource start end VVV |
Get the sub-string from |
QUERY.ACTIVEZONES VVV |
Get the set of active zones and put the result in VVV. |
QUERY.MAPNAMEBYNUM nnn VVV |
Returns a string (the name of the map) for map number nnn and places it in variable VVV. The active plot must be XY-Line or Polar-Line. |
QUERY.ISADDONLOADED commandprocessorid VVV |
Return "YES" in VVV if Add-on commandprocessorid is loaded, otherwise return "NO" |
QUERY.FILEEXISTS "filename" VVV |
If the file exists, VVV will be "YES" otherwise VVV will be "NO" |
QUERY.ISZONEACTIVE ZZZ VVV |
Test to see if zone ZZZ is active. If so, VVV is set to "YES"," otherwise it is set to "NO" |
QUERY.LINEMAPZONEASSIGNMENT nnn VVV |
Get the zone number assigned to line map nnn and put the result in VVV. |
QUERY.ACTIVELINEMAPS VVV |
Get the set of active line maps and put the result in VVV. |
QUERY.ISLINEMAPACTIVE nnn VVV |
Test to see if line map nnn is active. If so, VVV is set to "YES", otherwise it is set to "NO." VVV is set to "INVALID" if nnn ⇐0. |
FILE.APPENDSTRING "FileName" "String" |
Appends the given string to the indicated file, creating the file if necessary. FileName may be a relative path from Tecplot’s working directory or an absolute path. |
FILE.APPENDLASTERROR "FileName" |
Appends the last error message, if any, to the indicated file, creating the file if necessary. FileName may be a relative path from Tecplot’s working directory or an absolute path. If no Tecplot errors have occurred, this command will have no effect. |
If you have declared macro variables and would like to use them with the Extend Macro add-on, you can do so by surrounding the command call with single quotes and the macro variable with double-quotes.
For example:
$!VarSet |ZoneName| = "Unknown"
$!EXTENDEDCOMMAND
  COMMANDPROCESSORID = "extendmcr"
  Command = 'query.zonenamebynum 1 "ZoneName"'
$!RemoveVar |ZoneName|
Refer to the Scripting Guide for additional information on working with Tecplot 360’s macro language.
QUERY.DATASETTITLE
The following example, uses the QUERY.DATASETITLE command to place the
title of the dataset at a specific position on the plot.
$!VARSET |ZNUM| = "blank"

$!EXTENDEDCOMMAND COMMANDPROCESSORID='extendmcr'
  COMMAND='QUERY.DATASETTITLE ZNUM'

$!ATTACHTEXT
  XYPOS
  {
    X = 5
    Y = 90
  }

  TEXT = "Title is: |ZNUM|"
QUERY.VARNAMEBYNUM
The following example uses QUERY.VARNAMEBYNUM to place the name of variable 2 at a specific position on the plot.
$!VARSET |VNAME| = "X"

$!EXTENDEDCOMMAND COMMANDPROCESSORID = 'extendmcr'
  COMMAND='QUERY.VARNAMEBYNUM 2 VNAME'

$!ATTACHTEXT
  XYPOS
  {
    X = 5
    Y = 85
  }

  TEXT = "Var 2 is: |VNAME|"
QUERY.ZONENAMEBYNUM
The following example uses QUERY.ZONENAMEBYNUM to place the title of Zone 1 at a specific position on the plot.QUERY.ACTIVEZONES
$!VARSET |ZNAME| = "HELLO"

$!EXTENDEDCOMMAND COMMANDPROCESSORID = 'extendmcr'
  COMMAND='QUERY.ZONENAMEBYNUM 1 ZNAME'

$!ATTACHTEXT
  XYPOS
  {
    X = 5
    Y = 80
  }
  TEXT = "Zone is: |ZNAME|"
QUERY.ACTIVEZONES
The follow example uses QUERY.ACTIVEZONES to display a list of the active zones.
$!VARSET |ZNUMS| = "blank"

$!EXTENDEDCOMMAND COMMANDPROCESSORID='extendmcr'
  COMMAND='QUERY.ACTIVEZONES ZNUMS'

$!ATTACHTEXT
  XYPOS
  {
    X = 5
    Y = 70
  }
  TEXT = "Active zones are: |ZNUMS|"
Refer to the Scripting Guide for additional information on working with Tecplot 360’s macro language.
Extend Time Macro
The Extend Time Macro add-on simplifies the macro interface by allowing you to use a simple loop to query the number of solution times in the dataset and advance the time step. This differs from the native Tecplot macro language as it does not require that you know the solution time of your data.
This add-on uses a different algorithm than Tecplot 360 for sorting the solution times. Because Tecplot 360 combines time steps that are sufficiently close together, the number of time steps reported by this add-on may differ from the number of time steps reported by Tecplot 360.
If this add-on is disabled and you would like to enable it,
uncomment the line $!LoadAddon "tecutilscript_extendtimemcr"
in your Tecplot.add File or use one of the other methods to load addons described
in Add-on Loading.
Macro Processing
The Extend Time Macro add-on can be invoked from the macro language by using the following commands:
This command retrieves the number of time steps. This number is returned in the macro variable VVV.
$!EXTENDEDCOMMAND COMMANDPROCESSORID='extend time mcr'
  COMMAND='QUERY.NUMTIMESTEPS VVV'
This command sets the solution time at time step nnn. The acceptable value range number for nnn is: 1 - NumTimeSteps.
$!EXTENDEDCOMMAND COMMANDPROCESSORID='extend time mcr'
  COMMAND='SET.CURTIMESTEP nnn'
This command retrieves the solution time at time step nnn. This number is returned in the macro variable VVV.
$!EXTENDEDCOMMAND COMMANDPROCESSORID='extend time mcr'
  COMMAND='QUERY.TIMEATSTEP nnn VVV'
The following is a sample loop that uses the Extend Time Macro add-on:
$!EXTENDEDCOMMAND COMMANDPROCESSORID='extend time mcr'
  COMMAND='QUERY.NUMTIMESTEPS NUMTIMESTEPS'
$!LOOP |NUMTIMESTEPS|
  $!EXTENDEDCOMMAND COMMANDPROCESSORID='extend time mcr'
    COMMAND='SET.CURTIMESTEP |LOOP|'
  $!EXTENDEDCOMMAND COMMANDPROCESSORID='extend time mcr'
    COMMAND='QUERY.TIMEATSTEP |LOOP| CURTIME'
  $!PAUSE "Current time is: |CURTIME|"
$!ENDLOOP
See also: Extract Over Time, Solution Time and Strand Editor, Extend Macro, Time Series, and Time Aware.
Extract Over Time
The Extract Over Time add-on, extracts iso-surfaces, streamtraces, and points from polyline geometries in transient data. The resulting zones are assembled into a new strand with proper solution times set for each zone.
| To save a layout file, you must also save a data file when using this add-on. |
If this add-on is disabled and you would like to enable it,
uncomment the line $!LoadAddon "tecutiltools_extractovertime"
in your Tecplot.add File or use one of the other methods to load addons described
in Add-on Loading.
To use this add-on, go to and select one of the following menu options.
- Extract Slices Over Time
-
This option has moved to the Extract Slices dialog. See Extracting Slices to Zones. The macro, below, can still be used.
- Extract Polyline Over Time
-
Extracts a polyline geometry to a zone for each solution time. It allows you to define the number of points along the polyline to extract. It has the following requirements:
-
The frame must be in 2D or 3D.
-
Only a single polyline can be selected.
-
The data must be transient.
-
The polyline must be positioned over an existing zone.
-
- Extract Iso-Surfaces Over Time
-
Extracts an iso-surface to a zone for each solution time. It has the following requirements:
-
The frame must be in 3D.
-
The frame must contain one or more iso-surfaces.
-
The data must be transient.
-
- Extract Streamtraces Over Time
-
Extracts a set of streamtraces to a zone for each solution time. It has the following requirements:
-
The frame must be in 2D or 3D.
-
The frame contains one or more streamtraces
-
The data must be transient.
-
After extracting, the new strand is available and may be animated or saved to a file.
Macro Processing
The Extract Over Time add-on can be invoked from the macro language by using the following commands:
| Extract What | Command |
|---|---|
Slices |
$!EXTENDEDCOMMAND COMMANDPROCESSORID='Extract Over Time' COMMAND='ExtractSliceOverTime' |
Iso-Surfaces |
$!EXTENDEDCOMMAND COMMANDPROCESSORID='Extract Over Time' COMMAND='ExtractIsoSurfaceOverTime' |
Streamtraces |
$!EXTENDEDCOMMAND COMMANDPROCESSORID='Extract Over Time' COMMAND='ExtractStreamOverTime' |
Geometries |
$!EXTENDEDCOMMAND COMMANDPROCESSORID='Extract Over Time' COMMAND='ExtractGeomOverTime' |
See also: Extend Time Macro, Solution Time and Strand Editor, Extend Macro, Time Series, and Time Aware.
Extract Precise Line
The Extract Precise Line add-on (libname: tecutiltools_extractpreciseline) allows you to extract points along a line to a new zone or to a Tecplot ASCII data file. You specify the precise X, Y, and Z coordinates of the start and the end points of the line, along with the number of points along this line to extract.
To use the Extract Precise Line add-on, choose .
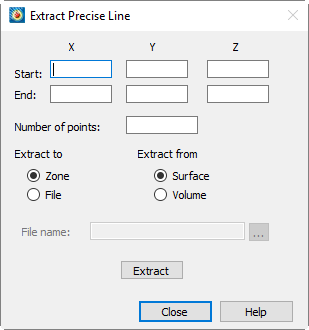
- Start, End X/Y/Z
-
Enter the X, Y, and Z coordinates of the start and end points of the line.
- Number of Points
-
The number of points between the start and end points to be extracted. (The start and end points themselves are always extracted and this number does not include them.)
- Extract To
-
Whether to extract to a zone or a file. If extracting to a file, you must also specify an output file path in the File Name field.
- Extract From
-
Choose whether to extract from the surface the line passes across or the volume it passes through.
When extracting from a surface in 3D, extraction is view-dependent: the specified line is projected from the plane of the screen onto the surface being extracted. Changing the view (e.g. rotating) will change the points extracted.
- File Name
-
The path of the file to extract to. You may type the path, paste it, or click the button to open the Write Tecplot ASCII File dialog and navigate interactively.
Click to perform the extraction.
Extract Blanked Zones
The Extract Blanked Zones add-on (libname: tecutiltools_extractblankedzones) allows you to extract subsets of existing zones based on the current blanking conditions. When activated, the Extract Blanked Zones capability will be available below the Data/Extract menu. To use simply set up blanking conditions (Value Blanking or IJK Blanking) and then choose the menu option. You may then select one or more zones to operate on. One new zone will be created for each zone selected (unless blanking dictates that all cells and points in the entire zone are blanked).
Special handling for FE surface and volume zones that contain orphaned nodes.
Orphaned nodes are nodes that are not connected to a cell in Finite-Element data. When value blanking is turned on interactively these nodes are also processed. If you elect to plot "All Nodes" in the "Points to Plot" column in the "Points" tab of the zone style dialog you can see the orphaned nodes.
When using the extract blanked zones capability, these nodes, for surface and volume FE data are not processed and thus they will not be part of the generated zone.
Special handling for "linear" zones (i.e. I-Ordered, J-Ordered, K-Ordered, or FE-Line Segment zones).
Linear zones are handled in a special manner whereby blanking is applied to points and not cells. If the current plot is 2D or 3D this also means ignoring the current value blanking "Cell Blanking Condition" setting (the option below the "Blank entire cells when" option in the dialog). Cells in FE Line Segment zones are only retained if both end points for the cell are not blanked. For I, J, and K-Ordered zones the resulting zone will continue to be the same "order" but keep in mind that all of the resulting data points are joined together thus resulting in new "cells" that skip over points that were blanked out. Points that are orphaned in linear FE-line segment zones, unlike Finite-Element surface zones, will be retained in the resulting blanked zone.
Cell-centered variables for I-ordered, J-ordered and K-ordered zones will be interpolated to the nodes before extracting the blanked regions. FE-line segment zones will retain the cell-centered values for cells that are not blanked.
Macro Processing
The Extract Blanked Zone add-on can be invoked from the macro language by using the following command:
$!EXTENDEDCOMMAND COMMANDPROCESSORID='EXTRACTBLANKEDZONES'
COMMAND='<commandoption>'
The command options are listed below:
| Command | Notes |
|---|---|
ZONES = <set> |
The ZONES option is the set of zones to operate on. |
Example:
Extract blanked zones from zones 1 and zones 5-9:
$!ExtendedCommand
  CommandProcessorID = 'EXTRACTBLANKEDZONES'
  Command = 'ZONES = [1,5-9]'
Key Frame Animator
With this add-on, you can easily animate a smooth progression through two or more specified views (key frames) and export them as an AVI, Flash, or Raster Metafile animation.
If this add-on is disabled and you would like to enable it,
uncomment the line $!LoadAddon "tecutiltools_keyframe"
in your Tecplot.add File or use one of the other methods to load addons described
in Add-on Loading.
To use this add-on, first create a layout and use the 3D Cartesian mode to view your plot. Then select "Key Frame Animation" in the menu to open the dialog.
| You must be in 3D Cartesian mode to use the Key Frame Animator add-on. |
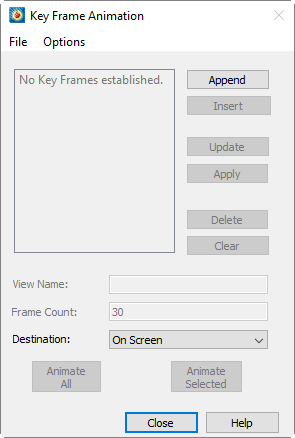
To create a key frame animation using this dialog, follow these general steps:
-
Rotate and/or zoom the plot to the initial view for the animation, and select the [Append] button in the dialog. If you wish, you may change the name of the view (key frame) by selecting the frame ("View 1") in the Key Frame box and editing the name in the View Name field of the dialog (for example, "End of Airfoil").
-
Rotate and/or zoom the plot to the next view you wish your animation to include, and select the [Append] button to add that view to the end of the animation. Or you can select the [Insert] button to insert a view above the selected one in the list. These key frames are snapshots of the view in Tecplot 360, so limit rotations to 180 degrees or less between key frames, or the animation may not rotate as you expect.
-
Continue to rotate and/or zoom and select [Append] or [Insert] to add additional key frames to your animation, if desired.
-
When finished adding key frames, select [Animate All] to perform a complete animation of your views, or [Animate Selected] to animate only the views selected in the Key Frame box. Tecplot 360 will interpolate all views in between your views to create an animation.
-
To export an animation, change the Destination from "On Screen" to "To File". Then select the [Animate All] or [Animate Selected] to open the dialog. You can choose to export the file as AVI, Flash, or Raster Metafile. Refer to Exporting Plots for details on exporting your file.
The dialog includes these controls:
- Append
-
The [Append] button adds the current view in the active frame to the list.
- Insert
-
Use the [Insert] button to insert the current view above the currently selected view in the key frame list.
- Update
-
The [Update] button replaces the view selected in the list with the current view in Tecplot 360. This also re-captures the current solution time.
- Apply
-
Use the [Apply] button to display the selected view as the current view of your plot.
- Delete
-
Select the [Delete] button to delete the selected key frame from the list.
- Clear
-
Use the [Clear] button will delete all key frames from the list.
- View Name
-
Use the View Name field to rename the view selected in the key frame list. By default, Tecplot 360 names the views as "View 1", "View 2", etc.
- Frame Count
-
The Frame Count box sets the number of frames drawn by Tecplot 360 between the selected view and the next view in the animation.
- Destination
-
In the Destination drop-down menu, choose whether to animate the key frames On Screen or To File.
- Animate All
-
Select [Animate All] to animate through all the key frames in the list.
- Animate Selected
-
Select [Animate Selected] to animate only the selected views. This allows you to refine a subset of animation without performing the complete animation.
Animation Customizations
The Key Frame Animator add-on includes additional capabilities in customized and menus at the top of the Key Frame Animation dialog. These menus give you the following additional options:
- File→Open/Save Animation
-
In the menu, you can save an animation that you have created, or you can open an animation that you have previously saved. An animation file stores settings and all key frames, and defaults to the name animation.keyframe. The ability to save and load animation files enables you to keep track of created animations without having to recreate them.
- Options
-
In the menu, each choice is a toggle except for "Time Animation Options" (which opens the Time Animation Options dialog). Select an option from this menu to turn on that preference. When an option is toggled-on, a checkmark will appear next to that option in the menu.
- Animate Time Concurrently
-
Select this option to animate time when animating the key frames, as specified in the Time Animation Options dialog.
- Animate Streamtraces Concurrently
-
If streamtraces display as markers or dashes in your plot, enable "Animate Streamtraces Concurrently" to animate streamtrace markers or dashes concurrently with key frame animation.
- Fade In/Fade Out
-
Toggle-on "Fade In" and/or "Fade Out" to fade lighting intensity and background lighting during the start and/or end of the key frame animation. The fade will last either 30 frames or the first ten percent of all frames, whichever is shorter. Fade In and Fade Out work best with a black background and without any plot features that do not have light sensitivity (mesh lines, edge lines, etc.).
Time Animation Options
With the dialog (opened by selecting "Time Animation Options" in the menu), you can specify additional options for animating your key frames. Choose to animate the frames by any of the following methods.
- Forward
-
With "Forward" selected, Tecplot 360 will display the earliest solution time in the first key frame, and will progress solution time throughout key frame animation so that the latest solution time displays with the final frame of the animation.
- Loop
-
With "Loop" selected, the solution time will progress as in the "Forward" option, except that the complete cycle of solution times displays multiple times over one key frame animation cycle. Set the number of solution time cycles to display in the Num Cycles box.
- Bounce
-
With "Bounce" selected, the solution time will progress forward during animation, until the solution time cycle completes. The solution time will then decrement in equal intervals until the initial solution time displays. Specify the number of times to repeat this bounce in the Num Cycles box.
- As Captured
-
Select "As Captured" to link each key frame with the solution time that the frame displayed when that frame was added to the key frame list. During the key frame animation, the solution time will vary in equal intervals between successive pairs of key frames so that each key frame displays the linked solution time.
See Also: Key Frame Animator.
Export Animation Options
In the dialog, when animating a set of key frames, you can export your animation by selecting "To File" from the Destination drop-down menu. Then select either [Animate All] or [Animate Selected] to launch the dialog. In this dialog, you can customize the export settings for your animation. Then select to select file location and export your animation.
The dialog includes the following export settings for your animation:
- Format
-
Select the format of your exported file.
- Region
-
Select the portion of your workspace that you wish to export. You can export the Active Frame, All Frames, or the entire Work Area.
- Width
-
Choose the width of the exported animation. You can use the default width of image on screen, or enter your own dimensions.
- Animation Speed
-
Enter a number to indicate how quickly you would like your animation to progress, in units of frames per second.
- Antialiasing
-
Toggle-on "Antialiasing" to use antialiasing in your exported animation. For more information on antialiasing, refer to Antialiasing Images.
- Image Type
-
If exporting as Flash, choose the type of image on which to base your animation.
- Optimize
-
With the two Optimize choices at the bottom of the dialog, you can choose to optimize your animation for either faster speed or smaller file size.
Macro Processing
To invoke the Key Frame Animator from the macro language, use the following commands:
Save Animation File:
$!EXTENDEDCOMMAND
  COMMANDPROCESSORID = 'Key Frame Animation'
  COMMAND = 'Animate AnimationDestination=<animationdest>'
In this command, use either OnScreen or ToFile for the <animationdest>.
Open Animation Settings File:
$!EXTENDEDCOMMAND
  COMMANDPROCESSORID = 'Key Frame Animation'
  COMMAND = 'OpenSettingsFile FileName = <string>'
Save Animation Settings File:
$!EXTENDEDCOMMAND
  COMMANDPROCESSORID = 'Key Frame Animation'
  COMMAND = 'SaveSettingsFile FileName = <string>'
Use the $!ExportSetup commands to set up the necessary
parameters for exporting to file (i.e., to set format, filename, etc.)
Note that the $!ExportSetup parameter EXPORTFNAME, which controls the export file name, can accept intrinsic macro variables such as SOLUTIONTIME, FRAMENAME, and LAYOUTFNAME. For example, if you wish to save a .png image, that tracks the frame name and solution time it came from, the macro command below is valid if the supplied intrinsic variables exist:
$!EXPORTSETUP EXPORTFNAME = 'path/to/output/directory/|FRAMENAME|-|SOLUTIONTIME|.png'See Also: Key Frame Animator.
Measure Distance
The Measure Distance add-on provides two menu items on the Tools pull-down menu, which are available only in 3D and 2D cartesian plots.
If this add-on is disabled and you would like to enable it,
uncomment the line $!LoadAddon "tecutiltools_measuredistance"
in your Tecplot.add File or use one of the other
methods to load addons described in Add-on Loading.
The Tools menu items are:
- Measure Distance
-
Choose this command from the Tools menu, then click two points on your plot. After the second click, a dialog appears indicating the coordinates of the two points, the differences in their coordinates, and the linear distance between the two points.
In three dimensions, the distance measured is the shortest distance between the different points selected and does not follow the surfaces. In two dimensions, the distance is in the 2D plane.
- Measure Angle
-
Choose this command from the Tools menu, then click three points on your plot. After the third click, a dialog appears indicating the distance from point 1 to point 2, the distance from point 2 to point 3, and the angle in radians and degrees.
In three dimensions, the angle measured is the angle between vectors 1-2 and 2-3 in the plane defined by points 1,2, and 3. In two dimensions the angle is in the 2D plane.
Multi-Frame 3D
The Multi-Frame 3D add-on adds two menu items to the Frame pull-down menu: Tile Frames and 3D Multi-Frames. Each command displays a small dialog giving you options for managing the frames in your plot.
If this add-on is not enabled and you would like to enable it,
uncomment the line $!LoadAddon "tecutiltools_multiframe3d"
in your Tecplot.add File or use one of the other methods to load addons described
in Add-on Loading.
Tile Frames
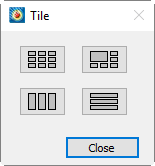
The Tile Frames dialog lets you quickly arrange multiple frames on a page in a variety of layouts. Clockwise from upper left, these are:
- Square
-
Frames are made as close to square as possible and arranged in a grid with approximately equal numbers of rows and columns.
- Wrap
-
The first frame is displayed in a larger size and the rest of the frames are wrapped around the right and bottom edge. The size of the main frame depends on the number of additional frames that need to be wrapped around the page.
- Horizontal
-
Equal-size horizontal frames are stacked vertically.
- Vertical
-
Equal-sized vertical frames are arranged horizontally.
When frames are resized, no attempt is made to re-fit the data to them. If a frame’s aspect ratio changes, data may no longer fit the frame as it did before tiling.
3D Multi-Frames
The 3D Multi-frames dialog, available only when the active frame is in 3D Cartesian mode, creates three additional frames displaying top (XY), front (XZ), and side (YZ) views of the 3D frame.
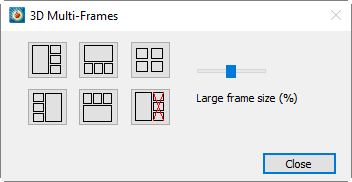
You may choose from five options for arranging the frames. Four of these options use a large frame for the original 3D frame and place the top, front, and side views along the top, bottom, or side of the large frame. For these views, the slider chooses the size of the large frame from 25% to 75% of the paper area. A grid arrangement giving equal prominence to all four frames is also provided. The button with the red X is for deleting the auxiliary frames (they may also be deleted manually).
When the new frames are created, the data and styles are shared with the original frame, and the new views are fit to their frames. The program also links field layer toggles, such as Mesh, Contour, Lighting, and so forth, so that a change in one frame is automatically reflected in the others.
Macro Processing
To tile frames using the Tecplot macro language, use the following command.
$!EXTENDEDCOMMAND
  COMMANDPROCESSORID = 'Multi Frame Manager'
  COMMAND = 'TILEFRAMESSQUARE'
The command can be TILEFRAMESSQUARE, TILEFRAMESVERT, TILEFRAMEZHORIZ, or TILEFRAMESWRAP.
To generate the top/front/side frames from a 3D view, use the following command.
$!EXTENDEDCOMMAND
  COMMANDPROCESSORID = 'Multi Frame Manager'
  COMMAND = 'MAKEFRAMES3D ARRANGE=LEFT SIZE=25'
ARRANGE may be LEFT, TOP, RIGHT, BOTTOM, or TILE, and the first four accept the SIZE parameter, which indicates a percentage of the paper size and can be 25-75.
To delete the top/front/side frames, use the following command.
$!EXTENDEDCOMMAND
  COMMANDPROCESSORID = 'Multi Frame Manager'
  COMMAND = 'DELETEFRAMES3D'
Solution Time and Strand Editor
The Solution Time and Strand Editor add-on allows you to modify the strand and solution time values from the user interface. This helps when loading a series of data files that do not have a solution time or strand ID. Adding the solution time simplifies both animating and setting component styles.
If this add-on is disabled and you would like to enable it,
uncomment the line $!LoadAddon "tecutiltools_strandeditor"
in your Tecplot.add File or use one of the other methods to load addons described
in Add-on Loading.
To access this add-on, select from the menu. The dialog has the following options:
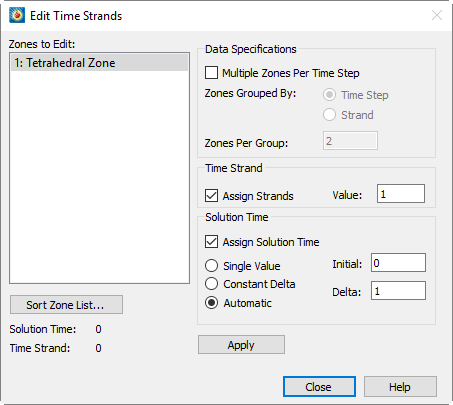
- Zones to Edit
-
In the Zones to Edit box, select a set of zones to edit.
- Data Specifications
-
Toggle-on "Multiple Zones Per Time Step" in order to select grouping by time step or strand. Use this Data Specifications region of the dialog to specify how the add-on groups zones.
- Strand ID
-
In the Time Strand region of the dialog, toggle-on "Assign Strands" to assign strand IDs.
- Solution Time
-
In the Solution Time region of the dialog, toggle-on "Assign Solution Time" to assign the solution time using one of the following options:
- Single Value
-
The Single Value option assigns the specified solution time to all selected zones.
- Constant Delta
-
The Constant Delta option applies a constant delta between zones (or groups of zones, depending on the Data Specification settings).
- Automatic
-
The Automatic option attempts to determine the solution time for each zone in this order:
-
Examines the Common.Time auxiliary data attached to the zone.
-
Tries to read a number from the zone name.
-
Tries to find a dataset variable that contains the time value. If found, uses the minimum value of this variable for that zone.
-
If an existing solution time is defined for the zone, the Automatic option uses it.
-
If all previous efforts fail, the Automatic option will fall back to use the Constant Delta option.
-
Tensor Eigensystem
The Tensor Eigensystem enables you to calculate the eigenvalues and eigenvectors of a 3-by-3 symmetric tensor whose components are stored in your data set. The add-on calculates for each node in the data set and stores the results as new data set variables.
If this add-on is disabled and you would like to enable it,
uncomment the line $!LoadAddon "tecutiltools_tensoregn"
in your Tecplot.add File or use one of the other methods to load addons described
in Add-on Loading.
To use this add-on, select "Tensor Eigensystem" from the menu to open the dialog.
In the dialog, select variables from your data set to represent the 6 components of the tensor. Toggle-on "Sort by Eigenvalue" to sort the results by the eigenvalues, and/or toggle-on "Save Eigenvectors" to store the calculated eigenvectors in addition to the calculated eigenvalues, which the calculation always saves. Then select to perform the calculation.
Tecplot 360 will store the eigenvalues of the tensor as variables EgnVal1, EgnVal2, and EgnVal3 in your data set. If you choose to save the eigenvectors as well, they are stored as variables EgnVec11 through EgnVec33. If you toggled-on "Sort by Eigenvalue", the eigenvalues and their corresponding eigenvectors will be sorted largest-to-smallest at each grid node. The association of EigenValue to EigenVector is as follows:
EigVal1 → EgnVec11, EgnVec21, EgnVec31
EigVal2 → EgnVec12, EgnVec22, EgnVec32
EigVal3 → EgnVec13, EgnVec23, EgnVec33
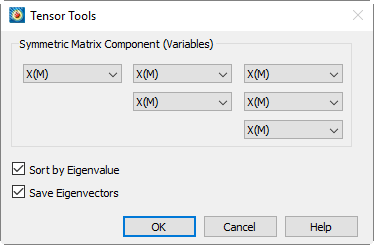
A common use of Tensor Eigensystem is to visualize vortex cores in a flow solution. You can do this by the following method:
-
Calculate Velocity Gradient in
-
Calculate the symmetric tensor S2 + Ohm-2 with (see below for an equation file to perform this)
-
Use the dialog to calculate the sorted eigenvalues
-
Display an iso-surface of Lambda-2, the middle of the three eigenvalues, which is negative in the vicinity of a vortex core
The following equation file calculates the required symmetric tensor components of S2 + Ohm-2 from the velocity gradient for step 2 above. Save the below to a text file, then load it into the dialog by selecting "Load Equations" and selecting the file.
#!MC 1100
$!ALTERDATA EQUATION = '{s11} = {dUdX}'
$!ALTERDATA EQUATION = '{s12} = 0.5*({dUdY}+{dVdX})'
$!ALTERDATA EQUATION = '{s13} = 0.5*({dUdZ}+{dWdX})'
$!ALTERDATA EQUATION = '{s22} = {dVdY}'
$!ALTERDATA EQUATION = '{s23} = 0.5*({dVdZ}+{dWdY})'
$!ALTERDATA EQUATION = '{s33} = {dWdZ}'
$!ALTERDATA EQUATION = '{Omga12} = 0.5*({dUdY}-{dVdX})'
$!ALTERDATA EQUATION = '{Omga13} = 0.5*({dUdZ}-{dWdX})'
$!ALTERDATA EQUATION = '{Omga23} = 0.5*({dVdZ}-{dWdY})'
$!ALTERDATA EQUATION = '{s2o2_11} = {s11}**2 + {s12}**2 + {s13}**2 - {Omga12}**2 - {Omga13}**2'
$!ALTERDATA EQUATION = '{s2o2_12} = {s11}*{s12} + {s12}*{s22} + {s13}*{s23} - {Omga13}*{Omga23}'
$!ALTERDATA EQUATION = '{s2o2_13} = {s11}*{s13} + {s12}*{s23} + {s13}*{s33} + {Omga12}*{Omga23}'
$!ALTERDATA EQUATION = '{s2o2_22} = {s12}**2 + {s22}**2 + {s23}**2 - {Omga12}**2 - {Omga23}**2'
$!ALTERDATA EQUATION = '{s2o2_23} = {s12}*{s13} + {s22}*{s23} + {s23}*{s33} - {Omga12}*{Omga13}'
$!ALTERDATA EQUATION = '{s2o2_33} = {s13}**2 + {s23}**2 + {s33}**2 - {Omga13}**2 - {Omga23}**2'
| Remember that the Tensor Eigensystem add-on can only analyze 3-by-3 symmetric tensors (not 2-by-2, anti-symmetric, or non-symmetric tensors). |
Macro Processing
To invoke the tensor eigensystem add-on with a macro, use the following syntax.
$!EXTENDEDCOMMAND
  COMMANDPROCESSORID = 'Tensor Eigensystem'
  COMMAND = 'T11VarNum = <varref>\nT12VarNum = <varref>\nT13VarNum =
             <varref>\nT22VarNum = <varref>\nT23VarNum = <varref>\nT33VarNum =
             <varref>\nSortEgnV = <Boolean>\nSaveEgnVect = <Boolean>'
Where <varref> can be an integer or the variable name contained within double quotes.
Time Series
The Time Series add-on, extracts a single point over time and plots the result in a new frame as an XY Line Plot. The solution time of the time series plot’s frame is linked to that of its parent, and a marker gridline is added to show the current solution time. If a nearest-point probe is performed (using Control-click), you may follow a particular node through time, or through an XY(Z) location.
If this add-on is disabled and you would like to enable it,
uncomment the line $!LoadAddon "tecutiltools_timeseries"
in your Tecplot.add File or use one of the other methods to
load addons described in Add-on Loading.
|
When tracking a node through time, each zone must have the same node map (or a shared node map) This add-on may not work as expected when there are multiple zones in the same strand at the same solution time. The user may see skipped values in their final plot if they probe a mesh in 3D which changes position over time. A nearest-point probe (using Control-Click) may give better results in these cases. |
To use the Time Series add-on, choose one of the following menu options from the menu:
- Probe To Create Time Series Plot
-
This option sets the mouse mode to probe. You can use either the mouse or the dialog to probe a point. The probed location will be sampled over time (for transient data) and a resulting XY Line Plot will be created. If a nearest point probe is done (Control-click), a dialog appears to ask if you want to track the node or the XY(Z) location through time. If you track the node, it is important that your data has the same node map for each zone through time.
- Send Time Series Data To New Frame
-
This option creates a new frame for each point extracted. By default, the frame used for the time series data is reused to avoid creating an excess of frames.
See also: Extract Over Time, Extend Time Macro, Solution Time and Strand Editor, Extend Macro, and Time Aware.
Write Data as Formatted Text
The Write Data as Formatted Text add-on enables you to write data from an XY Line Plot to a text file in *.csv format (for comma separated data) or in *.txt format (for any other data separators).
If this add-on is disabled and you would like to enable it,
uncomment the line $!LoadAddon "tecutildataio_excsv"
in your Tecplot.add File or use one of the other methods to load addons described
in Add-on Loading.
To use it, select "Write Data As Formatted Text" from the menu.
This will open the dialog.
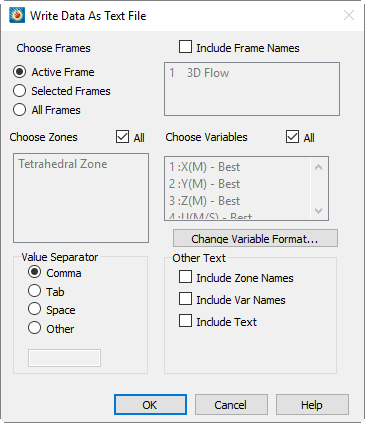
The dialog includes the following options:
- Choose Frames
-
Use the Choose Frames region of the dialog to specify which frames to include in the text file. Choose from the following options:
- Active Frame
-
Select to include the active frame only.
- Selected Frames
-
When "Selected Frames" is active, the box to the right will become sensitive. Use the Shift and Control keys to select multiple items in the list.
- All Frames
-
Select "All Frames" to include data from all frames in the text file.
- Choose Zones
-
Toggle-off the "All" option to select a subset of zones to include the in text file. Because different frames may have different zones, this option is available only when "Active Frame" is selected in the Choose Frames region of the dialog.
- Choose Variables
-
Toggle-off the "All" option to select a subset of variables to include in the text file. Because different frames may have different variables, this option is available only when "Current Frame" is selected in the Choose Frames region of the dialog.
- Value Separator
-
Use the Value Separator options to specify the delimiter to use in the text file.
- Change Variable Format
-
Click to launch the Change Format dialog. If you choose not to change the variable format, values will be written in the "best" format, except variables named "Time" or "Date."
- Other Text
-
Toggle-on any of the options in the Other Text region of the dialog to include the desired values in the text file.
Change Format
Use the dialog (accessible using the Change Variable Format button in the Write Data as Text File dialog) to change the format for one or more variables. To change the format for all variables simultaneously, toggle-on .
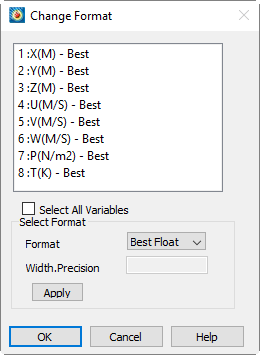
Choose a new format with the Select Format section of the dialog. Available formats are Best Float, Integer, Float, and Exponent. "Best Float" automatically selects either regular floating point or scientific notation depending on the value and uses as many digits as are necessary to represent the value. "Float" and "Exponent" use standard and scientific notation, respectively.
When you have chosen "Float" or "Exponent," you may use the Width.Precision box to specify the width and precision of your new variable format using a C-style numeric formatting specifier (see examples following). Width refers to the total number of characters (including the decimal point; numbers are space-padded on the left if necessary), while Precision refers to the number of places beyond the decimal point. Precision is a hard limit, while Width is a soft limit: the specified number of digits of precision are always used, but numbers are not cut off if they do not fit in the specified width (see second example following). Leading zeroes are not displayed, except for one immediately preceding a decimal point (that is, for values between -1 and 1).
For example, a Width.Precision of 10.2 yields:
Month,Seattle Rainfall,Dallas Rainfall,Miami Rainfall,Error 1,
1.00, 4.30, 4.00, 4.00, 0.20,
2.00, 4.50, 4.00, 4.10, 0.22,
3.00, 4.00, 3.50, 4.50, 0.24,
4.00, 4.20, 3.40, 4.20, 0.24,
While a Width.Precision of 3.2 yields:
Month,Seattle Rainfall,Dallas Rainfall,Miami Rainfall,Error 1,
1.00,4.30,4.00,4.00,0.20,
2.00,4.50,4.00,4.10,0.22,
3.00,4.00,3.50,4.50,0.24,
4.00,4.20,3.40,4.20,0.24,