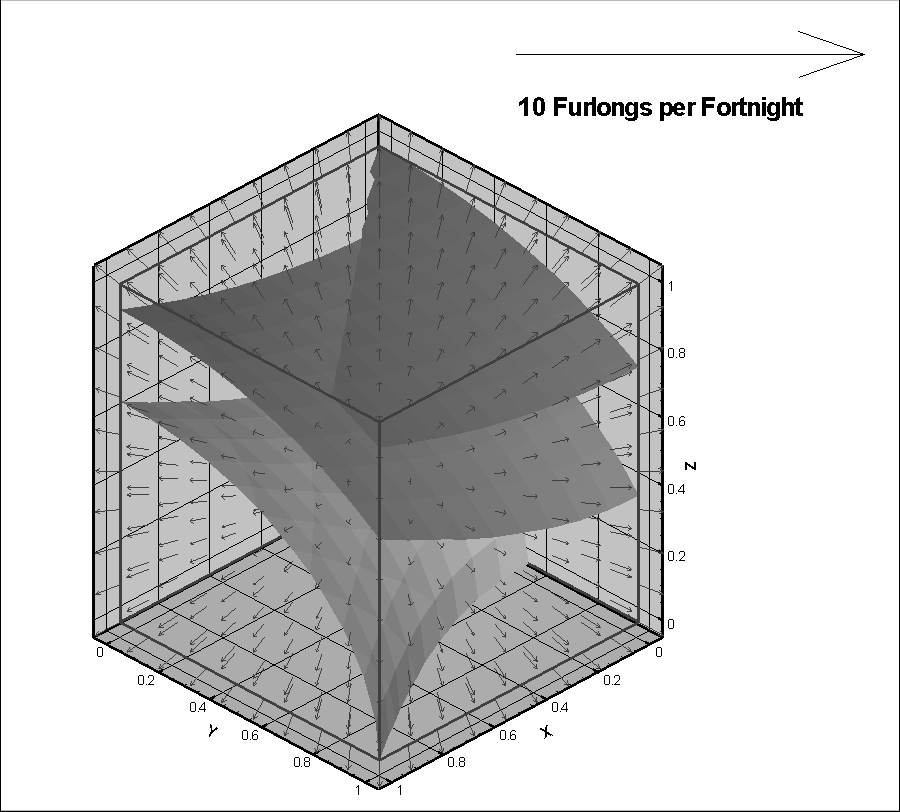
Vector Layer
You can create vector plots by activating the layer in the , and specifying the vector component variables. plot attributes can be modified using the page of the dialog.
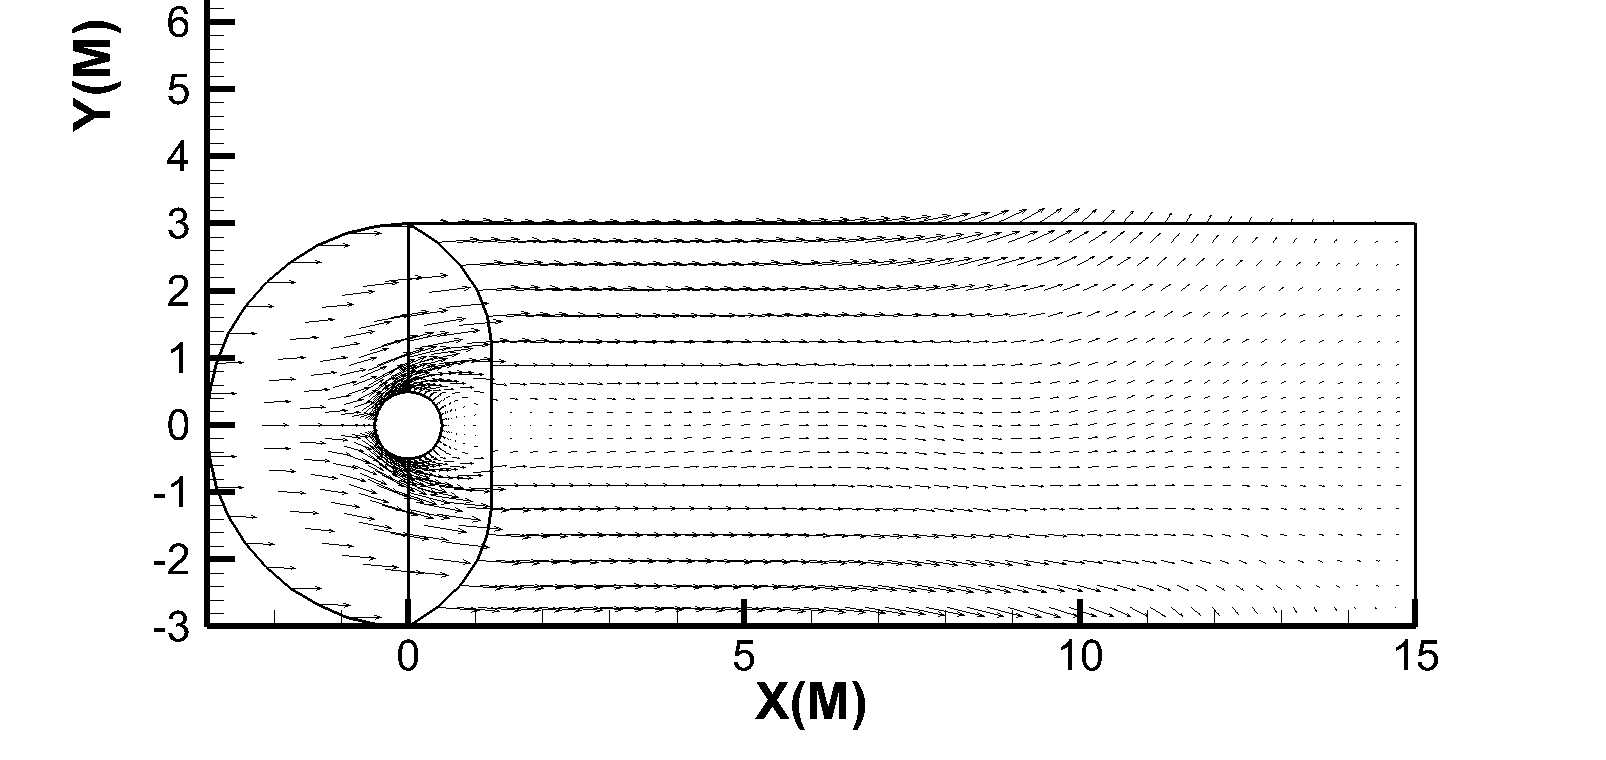
Vector Variables
When you activate the layer (via the ), Tecplot 360 checks to see whether vector components have been assigned for the current dataset in the current plot type. If you have not assigned vector components, the dialog, shown here, will be launched.
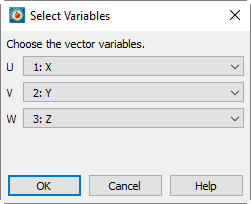
Choose variables by selecting the desired U, V, and W (3D only) variables from their respective drop-downs. You may select any of the current dataset’s variables as any component. You can change the component variables at any time by choosing from the menu.
Once you have selected the in the and have chosen your vector components, your vector plot will appear. If vectors are not visible, refer to Definition Page.
Vector Plot Modification
You can modify your vector plot attributes using the of the dialog. You can control any of the following attributes from the of the dialog.
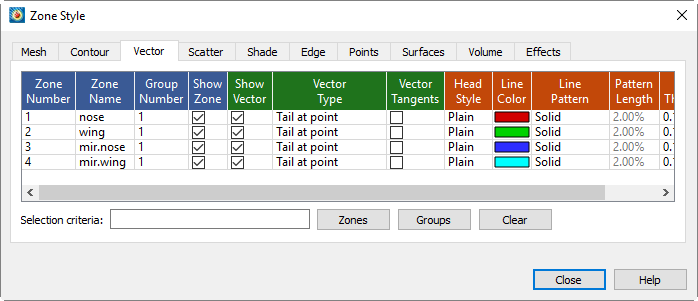
| In order for the changes made on the to be visible in your plot, the must be active (toggled on in the ). |
- Show Vector
-
Toggle-on to show the vector for a particular zone.
- Vector Type
-
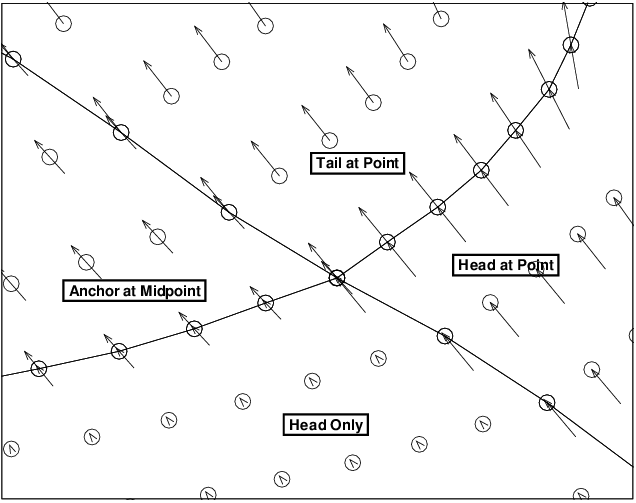
Select from the following options:
- Tail at Point (default)
-
Draws the tail of the vector at the data point.
- Head at Point
-
Draws the head of the vector at the data point.
- Anchor at Midpoint
-
Positions the midpoint of the vector at the data point.
- Head Only
-
Draws the head of the vector at the data point and does not draw a tail.
Figure 2 shows examples of each of the vector plot types.
- Vector Tangents
-
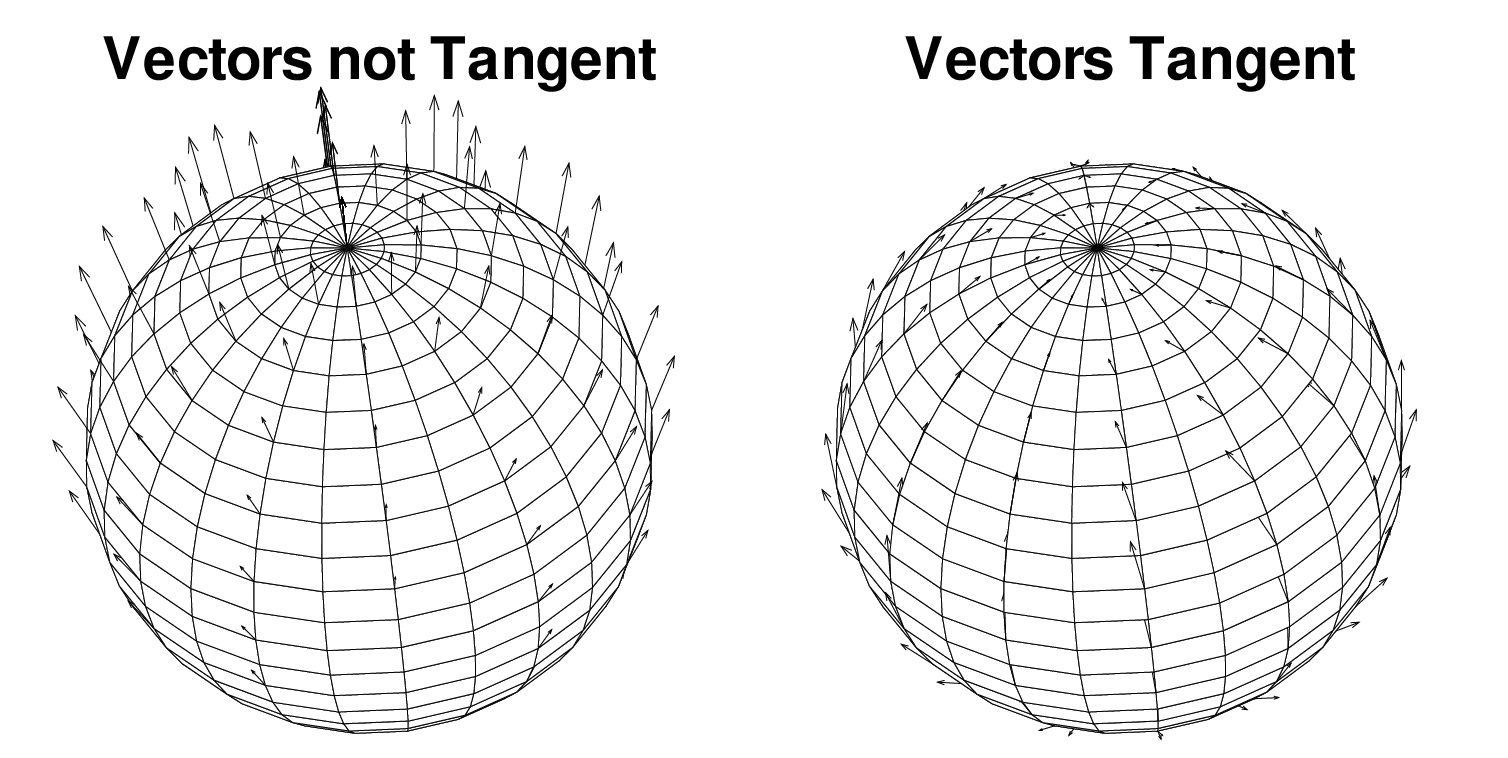
Toggle-on to display only the tangent component of vectors, not both tangent and normal components. Tangent vectors are drawn on 3D surfaces only where it is possible to determine a vector normal to the surface. A plot where multiple surfaces intersect each other using common nodes is a case where tangent vectors are not drawn because there is more than one normal to choose from. An example of this would be a volume IJK-ordered zone where both the I and J-planes are plotted. If tangent vectors cannot be drawn, then regular vectors are plotted instead.
- Head Style
-
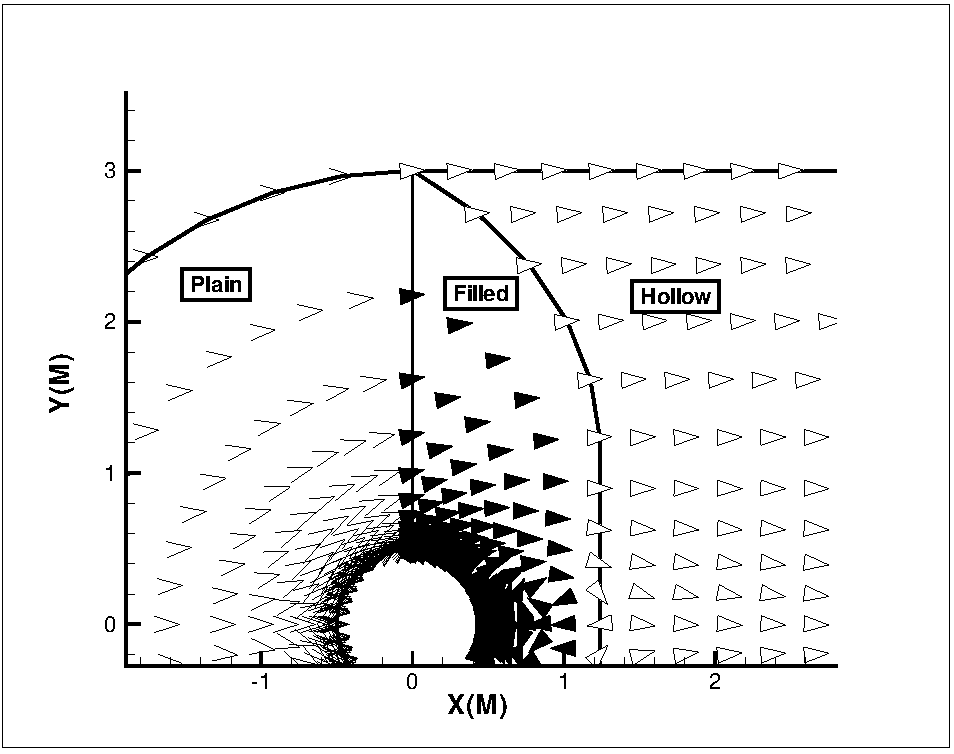
Right-click to choose an arrowhead style for the vectors. Figure 4 displays the available styles.
- Plain (default)
-
Line segments drawn from the head of the vector.
- Filled
-
Filled isosceles triangles with apex at the head of the vector.
- Hollow
-
Hollow isosceles triangles with apex at the head of the vector.
- Line Color
-
Right-click to choose the vector color in the Color Chooser dialog
- Line Pattern
-
Right-click to choose the vector line pattern.
- Pattern Length
-
Right-click to choose the vector line pattern length as a percentage of frame height. You may choose a preset length or enter an exact number.
- Line Thickness
-
Right-click to choose the vector line thickness as a percentage of frame height. You may choose a preset thickness or enter an exact number.
| If your data consists of a dense mesh of points, a may be too crowded to be of much use. You can "thin" the plot by plotting only a certain subset of the data points with the attribute from the Points page of the dialog. |
| For information on using the controls at the bottom of the dialog to select zones by name, see the description of these at the end of Field Plot Modification and the Zone Style Dialog. |
Use the dialog to adjust other settings, including length scaling, arrowhead appearance, and reference vector. See Vector Details.
Vector Details
The dialog () lets you specify the length of vectors and the appearance of arrowheads. You can also display a reference vector. on your plot. These settings are all global to the current frame.
| In order for most changes made on the dialog to be visible in your plot, you must have the toggled on in the Plot sidebar, and the vectors of at least one zone must be visible (see Vector Plot Modification). |
The dialog has three pages:
Definition Page
The page of the dialog allows you to change the vector variables, adjust the length of displayed vectors, and use even vector spacing.
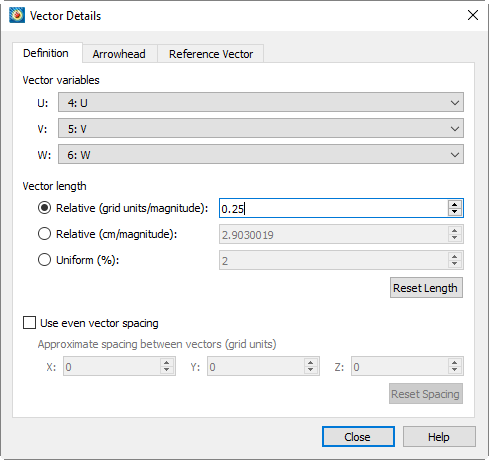
The page of the dialog has the following options:
- Vector variables
-
Select the variables for U, V, and W (3D only) vector variables. Selecting new vector variables will update the plot if any vectors are displayed.
- Vector length
-
The following option are available for the length of the vector:
- Relative (grid units/magnitude)
-
Specify the vector length as the number of grid units per unit of vector magnitude.
- Relative (cm/magnitude)
-
Specify the vector length as the number of centimeters per unit of vector magnitude.
- Uniform (%)
-
Specify the vector length as a percentage of frame width.
- Reset Length
-
For relative vector length, the default is based on the size of the longest vector. Click to change the vector length to a relative vector length with the scale factor expressed in grid units per unit of vector magnitude. Not available when is selected.
For either of the "Relative" options for vector length, the value you specify is a scale factor that is multiplied by the vector magnitude to determine the length of the vector.
| Since 3D vectors are plotted in the plane of the screen, a 3D vector’s length will depend on both the vector length settings and the orientation of the vector. The length may be distorted more if the length setting is and the 3D projection is . |
- Use even vector spacing
-
Select to turn on even spacing for vectors based on grid units of X, Y, and Z (3D only). Turning on even vector spacing (with vectors displayed) will selectively remove some of the vectors in the plot to approximately enforce the display intervals specified in the spacing controls. This is useful for clarifying areas of the plot that are cluttered with an excess number of vectors. When turned on, the initial values of spacing, specified in grid units, are set to attempt to display a maximum of 40 vectors in each direction across the frame based on current view. This default number of vectors can be changed in Tecplot’s configuration file, tecplot.cfg; refer to the
VECTORDEFAULTSPACINGCOUNToption of the$!FRAMESETUPmacro command.- Reset Spacing
-
Resets the spacing intervals to these default values. Selecting new axis variables will also reset the vector spacing values.
Arrowhead Page
You can specify arrowhead sizes as either a fraction of the vector length or in frame units (that is, as a percentage of the frame height). By default, Tecplot 360 specifies size as a fraction of the vector length.
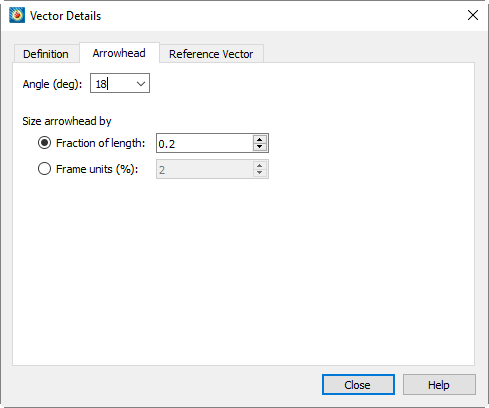
The page of the dialog has the following options:
- Angle (deg)
-
The arrowhead angle is the angle that one side of the arrowhead makes with the vector, i.e. the apex angle is twice the arrowhead angle. To specify the arrowhead angle, enter a value from 1 to 90, or choose a value from the drop-down, indicated by the down-arrow button.
- Size arrowhead by
-
- Fraction of Length
-
Enter a decimal value from zero to ten.
- Frame Units (%)
-
Enter a percentage value from zero to 100.
Reference Vector Page
A reference vector is a vector of specified magnitude placed on the plot as a visual measure of vector length.
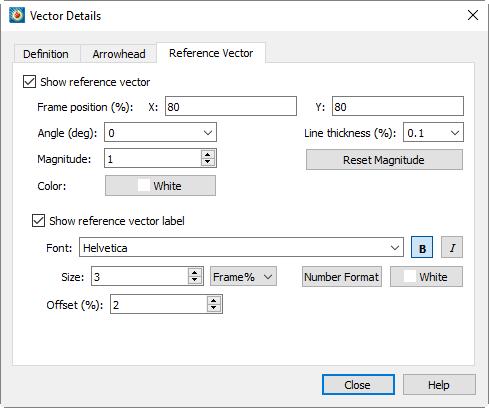
The page of the dialog has the following options:
- Show Reference Vector
-
Toggle-on to include a reference vector in your plot.
- Frame Position
-
Enter the coordinates of the starting point of the reference vector, as a percentage of the frame width (X) and frame height (Y).
- Angle (deg)
-
Enter the orientation of the vector in degrees from horizontal, or choose a value from the drop-down.
- Magnitude
-
Enter the magnitude of the reference vector. The units correspond to those of the vector components.
- Color
-
Choose a color with the Color Chooser. Multi-color and RGB coloring are not available.
- Line Thickness (%)
-
Enter the desired line thickness, or choose a value from the drop-down.
- Reset Magnitude
-
Resets the magnitude of the reference vector based on the average vector magnitude.
- Show Reference Vector Label
-
Toggle-on to include the magnitude of the reference vector in the label. Select and modify any of the following options:
- Font
-
Choose or enter the name of the font to be used for the label. Click the B or I buttons to select the bold and/or italic variety of the font. (See Font Folders and Fallback for more information on how fonts work with Tecplot 360.)
- Size
-
Enter the size and choose units either of frame height percentage or points.
- Number Format
-
Click to specify how the number will be formatted using the Specify Number Format dialog. See Specify Number Format for a discussion of this dialog.
- Color
-
Choose a color with the Color Chooser. Multi-color and RGB coloring are not available.
- Offset (%)
-
Choose the spacing between the label and the reference vector as a percentage of frame height.
A plot with a reference vector is shown here. The units for the reference vector were added using a text object (see Text).
