Tecplot RS Workspace Features
Tecplot RS includes certain features that function independently of plot type. Understanding these features of the Tecplot RS workspace, as described in this chapter, can help you work with your data easily in Tecplot RS.
These features include:
Using Frames
All plots in Tecplot RS appear inside a frame. By default, the Tecplot RS workspace contains one frame.
To conveniently create additional frames and/or arrange frames in your plot, you can use the Multi-Frame Options dialog. This dialog contains options for managing plots with multiple frames on a single page, allowing you to create multiple views of the same data set, or view multiple data sets. When working with multiple frames, you can also use this dialog to link features between frames.
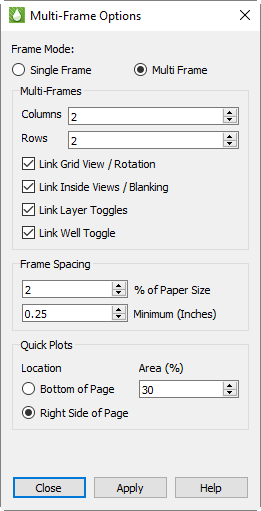
Multi-Frame Options
To access the Multi-Frame Options dialog, click the
 (Multi-Frames)
button in the toolbar, or choose from the
menu. The dialog includes the following controls.
(Multi-Frames)
button in the toolbar, or choose from the
menu. The dialog includes the following controls.
-
Frame Mode Use the Frame Mode region of the dialog to choose a frame management mode.
-
Single Frame Tecplot RS will automatically create a single frame for the requested plot type. Any time you change the plot type, Tecplot RS will clear the old frame to display the new plot type.
-
Multi-Frame In this mode, Tecplot RS creates multiple frames to display the data for the chosen plot type. Each frame will display a different view of the data set. The variation depends on the plot type. For example, grid plots will display a different variable in each frame, while XY-Variables plots will cycle through the entity list.
-
|
Several plot types do not support using multiple frames: RFT Plots, Completion Profiles, and Flow Tables. When using one of these plot types, you can only use a single frame. Tecplot RS cannot fully support frame linking with dual porosity grids loaded. Refer to Grid Options for additional information. |
-
Multi-Frames The Multi-Frames region of the dialog allows you to control the configuration of frames when using the Multi-Frame mode. The region has the following options:
-
Columns and Rows Use these controls to set the number of frames appearing across and down the paper.
The settings immediately below the Colums and Rows fields let you to link frames, to share settings for view, value blanking, or toggles:
-
Link Grid View/Rotation When the views are linked, changing the viewing angle or distance on one frame will make the changes in all frames. Without linking, you can set the views independently in each frame.
-
Link Inside Views/Blanking With the inside views and blanking linked, a single set of value blanking and inside views criteria will apply to all frames. When this option is toggled-off, you can set cell and pick blanking constraints and inside views independently in each frame. See Cell Value Blanking for a discussion of value blanking, Pick Blanking for a discussion of pick blanking, and Inside Views for a discussion of inside views.
-
Link Layer Toggles Layer Toggles include the Mesh, Contour, Connect, Shade, Translucency, and Light toggles at the top of the grid sidebars, and the Lines and Symbols toggles in the XY plot sidebars. When linked, any change to these toggles will affect all frames. Toggle-off "Link Layer Toggles" to set these options independently for each frame.
-
Link Well Toggle When toggled-off, wells will be displayed only in the first frame. When on, wells will display in all frames. Unlike the layer toggles, well display cannot change from frame to frame. This option simply lets you control whether wells are shown in one frame or all. See Wells for additional information about wells.
-
-
-
Frame Spacing These options control the spacing between frames and the margin from the edge of the paper to the plot frame(s). The first value sets the spacing as a percentage of the longer dimension of the paper, and may range from 0 to 5. The second value represents a minimum distance in inches, and is independent of the paper size.
For no spacing at all around frames, set both values to 0. Otherwise, you may use both options or just one. If both are set, the frames will be spaced according to whichever setting results in the larger spacing.
-
Quick Plots Quick Plots are available in the 2D and 3D Grid plot types. These provide plots of statistical data (histogram and cross plots), plots of value for one cell over all time steps, or one location at each cell depth. See Additional Data Views for more information on the Quick Plots.
The Quick Plots options allow you to control where these plots are placed in relation to the main plots (below or to the right), and how much of the paper area is allocated for the quick plots (between 20% and 50% of the page).
Changing the View
The menu contains controls with which you can adjust the active frame’s view, the view of the entire workspace.
Display of the Toolbar or Sidebar
You can turn off the toolbar and/or Plot Controls sidebar by choosing or , respectively, from the menu. To turn them back on, choose the corresponding menu item again.
Redraw a Frame
By default, Tecplot RS automatically redraws the current plot whenever you
make changes to it. If you choose to turn off this Auto Redraw feature (in
the Performance dialog, accessible from the menu), or
while recording macros, you can redraw the active frame by choosing
from the menu. You can also redraw the
active frame by pressing Ctrl+R, or clicking the
 (Redraw Frame)
button in the toolbar.
(Redraw Frame)
button in the toolbar.
Redraw All
To redraw your entire plot when the Auto Redraw feature is turned off (in
the Performance dialog, accessible from the menu) or when
recording a macro, choose from the menu.
You can also press Ctrl+D or click the
(Redraw Frame)
button in the toolbar or sidebar to redraw your plot.
Zoom
Tecplot RS includes the capability to zoom in several ways, adjusting the perceived distance between the viewer and the plot.
Plot Zooming
As well as clicking the Zoom tool in the Plot Controls Sidebar, you can also zoom your plot interactively by choosing from the menu to access the Zoom tool. Drag the pointer to draw a box: the region within the view box will resize to fit in the frame according to the longest dimension of the box.
| To return to the previous view, choose in the menu (or press Ctrl+L). Choose from the menu to center the data in the active frame. |
Paper Zooming
You can also zoom your workspace, rather than the plot, by pressing the Shift key while drawing a box with the Zoom tool. Tecplot RS will resize the plot so that the longest dimension of the zoom box fits in the entire workspace.
| You can also fit one or all frames to the workspace by choosing or from the menu. |
Interactive Zooming and Translation
You can also use the middle and right buttons of the pointer to smoothly zoom and translate your plot view. Drag with the middle button up and down to zoom smoothly; drag with the right button to translate your plot view.
3D mouse Tecplot RS also supports a 3D mouse, an input device that allows zooming (and translation and rotation) of 3D plots with a touch. You do not need to activate the Zoom tool to use the 3D mouse for zooming. Simply push the mouse’s cap toward or away from you to zoom.
Hold the Alt key while zooming with the 3D mouse to switch the zoom method (see Input Devices for details).
Avoid tilting the mouse cap, as this may induce unintended rotation. Hold down the Alt key to switch between zooming by moving the data and by moving the viewer.
Last
Choose from the menu to restore the previous view of your plot. With this command, you can step backward through resizing and repositioning a plot. Tecplot RS remembers the last fifteen view changes, including zooming, centering, translating, or fitting, for each frame.
Center
Choose from the menu to center the plot within its frame. This command centers only the data, neglecting text, geometries, and 3D axes. Neither axes or plot change in size with this command.
Fit Everything
Choose from the menu to resize the plot so that all data, text, and geometries fit visibly in the frame. You can also fit everything by pressing Ctrl+E. This view can be useful to restore a standard view of your plot after extensive zooming, scaling, or translating.
Fit Data
Choose from the menu to resize the plot so that all data points fit visibly in the frame. This command ignores text and geometries when resizing. You can include the text by setting the text to be positioned by grid coordinates (in the Text Details dialog).
Copy View
Use in the menu to copy the active frame view; you can then paste the frame view into another frame. The copied view includes all view attributes affected by the menu: zoom position, translation, scale, and, in 3D grid plots, the degree of rotation and perspective projection.
Paste View
Choose from the menu to paste a copied view onto the active frame (click on the frame you wish to copy the view onto first to make it the active frame). When working with multiple frames in one plot type, this command (and the Copy View command) can help make you more efficient, since you can make view changes to one frame and then copy and paste those changes to the other frames in your plot.
Custom 3D View
Use the commands Save Custom 3D View and Apply Custom 3D View to save
the current view (rotation, center, and perspective) and to reset the
current view to the saved settings. The
 (Reset View) toolbar
button can also be used to apply the saved view. Available only when
a 3D plot is active. See
Custom 3D View
for further details.
(Reset View) toolbar
button can also be used to apply the saved view. Available only when
a 3D plot is active. See
Custom 3D View
for further details.
Workspace Commands
The menu contains several advanced commands to optimize your viewing of the workspace. To type the keyboard shortcuts, hold down the Ctrl and Shift keys while pressing the corresponding letter key.
-
Fit Selected Frames to Workspace (Ctrl+Shift+F) Choose this command to resize all frames proportionally so that the selected frame(s) fill the workspace either vertically or horizontally.
-
Fit All Frames to Workspace (Ctrl+Shift+A) Choose "Fit All Frames to Workspace" or type the keyboard shortcut to resize all frames proportionally so that all frame(s) fill the workspace either vertically or horizontally.
-
Fit Paper to Workspace (Ctrl+Shift+P) This command resizes the paper to fill the Tecplot RS workspace.
-
Last Workspace View (Ctrl+Shift+L) Choose this command to restore the workspace to the previous view. This command undoes the last "Fit Selected Frames to Workspace" or "Fit All Frames to Workspace" command.
Using the Edit Menu
You can duplicate frames, text, and geometries with the copy and paste commands in the menu. (You can also use the keyboard equivalents, Ctrl+C and Ctrl+V.) You can also cut objects from one location and paste them into another, or throw them away completely (by choosing from the menu).
| The Cut, Copy, and Paste commands work only within Tecplot RS. Choose "Copy Plot to Clipboard" from the menu to copy a Tecplot RS plot for external use. You can then paste it into other applications. |
-
Cut Choose "Cut" from the menu, or press Ctrl+X, to remove the selected item from the plot and the active data set (if applicable), and store the removed item in Tecplot RS’s memory for pasting within Tecplot RS.
-
Copy Choose "Copy", or press Ctrl+C, to store the selected item in Tecplot RS’s memory for pasting within Tecplot RS.
-
Paste Use the command in the menu, or press Ctrl+V, to add the most recently cut or copied item to the active frame. If you are pasting a copied object into the same frame as the original, Tecplot RS will position the new object directly over the original. Use the Selector or Adjustor tool to move the copied item to a new location in the frame.
-
Clear With the command in the menu, you can remove the selected item from the plot and the active data set. Tecplot RS does not store cleared items in its memory for pasting.
Using Color in Your Plot
You can change the color of many attributes of your plot. Often, this is done using a drop-down list right next to the setting whose color you wish to specify.
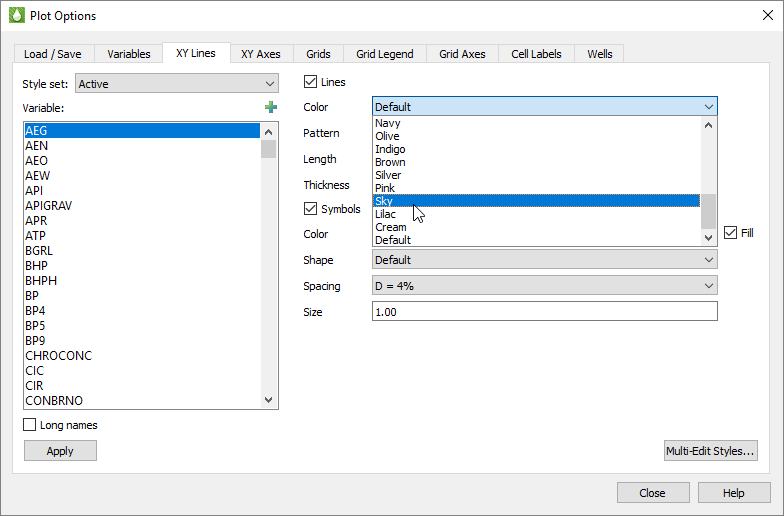
For example, in the Plot Options dialog shown here, there are drop-down lists for specifying the colors of lines and symbols.
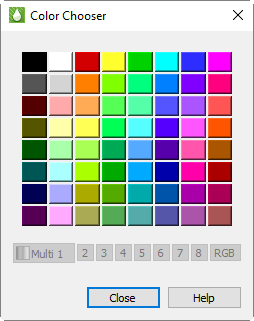
In some places, you may use the Color Chooser dialog. Use the Color Chooser dialog to apply another color to the selected plot attribute. The place of access determines the element in your plot for which the color applies. For example, if you open the Color Chooser dialog from the Text Details dialog, the chosen color will apply to the currently selected text.
To change the color of the selected object, simply click on the color you wish the object to appear.