History Match
It is often useful to compare history data of a reservoir with multiple simulation runs to determine which simulation best matches the history data. While other comparison methods give good qualitative comparison results, when that is not sufficient, you can use the History Match plot type to compare data sets in a quantitative, visually diverse manner.
You can compare data sets using History Match plots in two ways. In the One Well mode, Tecplot RS shows you how the comparison data for a single well deviates from the history data over time (or as another independent variable changes). In the Multi Well mode, Tecplot RS shows you how the comparison data for a single date deviates from the history data from well to well.
To use the History Match plot type, with XY data loaded, choose History Match from the Plot Type menu in the sidebar or from the menu in the menu bar.
The History Match plot type displays three frames at once, showing three different comparisons of the data sets: the raw data, the deviation data, and the deviation distribution.
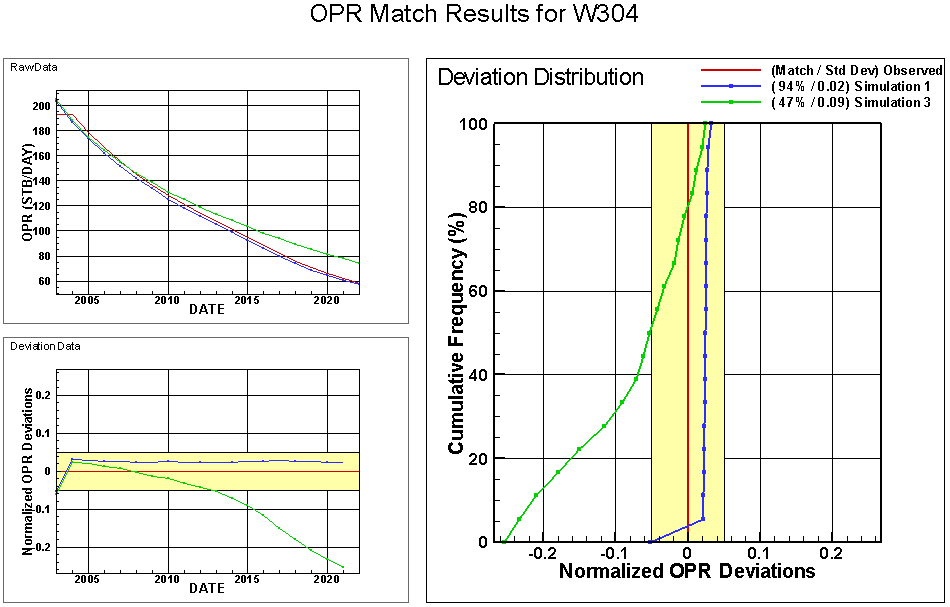
An example of the three frames that display when the History Match plot type is selected. In this example, the red line is a display of the observed data, and the blue and green lines represent simulated data sets.
History Match Plots
The History Match plot type always displays three frames with three specific plots. Legends, when included by controls in the Paper Layout plot type, display in the Deviation Distribution plot frame.
You can adjust the style of the lines displayed, as well as the axes colors and marker styles, by double-clicking on one of the plots to open the XY Lines page of the Plot Options dialog. However, you cannot adjust the scale of the plots in the History Match plot type; the axes scale to fit the data being displayed. By default, the first nine lines displayed on History Match plots use style sets one through nine (ST1 through ST9). Additional lines use style set 9 (ST9) and rotate through comparison style sets.
The legend that displays in the Deviation Distribution frame identifies
each data set. You can control how the legend displays the data set names
by adjusting the display name itself on the XY page of the Manage Data
dialog (accessible by choosing from the
menu or clicking the Manage Data button in the toolbar
 ).
).
Raw Data Plot
The Raw Data plot displays a standard comparison of each data set as chosen in the sidebar. For example, in History Match Comparisons, the Observed data set is displayed as the history data, along with Simulation One and Simulation Three. DATE is selected in the X Var menu of the sidebar, and OPR is selected in the Y VAR menu of the sidebar. (This is a One Well plot. In a Multi Well plot, the X axis always represents the well numbers of the selected wells.)
Deviation Data Plot
The Deviation Data plot shows the difference between the history data and each selected comparison data set, for each value of the independent variable. (In the example of History Match Comparisons, the deviations are displayed by Date. In a Multi Well plot, they are displayed by well number.)
Deviation Distribution Plot
The largest frame of the History Match plot type displays the Deviation Distribution of the data. This plots the cumulative percentage of points (shown on the Y-axis) that fall within the deviation range (shown on the X-axis). For example, on the plot shown in History Match Comparisons, the blue line intersects the red line at about 3%, which means only about 3% of the data points in Simulation One deviate negatively from the history data. The green line, Simulation Two, intersects the yellow deviation band at about 50% and remains inside the deviation band from 50 to 100%, showing that about 50% of the data deviates from the history data within the acceptable range.
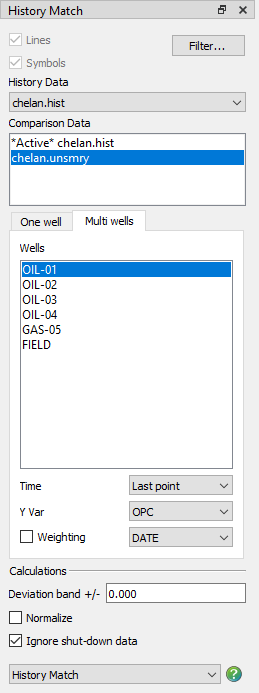
History Match Controls
When you choose "History Match" from the Plot Type menu in the sidebar or from the menu in the menu bar, the displayed plot type in Tecplot RS will switch to the History Match plot type, and the sidebar will change to include specialized options for customizing your history match set of plots. You may then choose One Well or Multi Well tab to select which mode you wish to use.
With the options in the History Match sidebar, you can customize your plot comparisons in a number of ways.
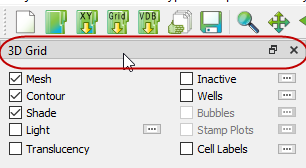
You can un-dock the Plot Controls sidebar by dragging its title bar to a new position. To put the Plot Controls back on the side of the workspace, double-click on its title bar (the region that displays the plot type). You can also drag its title bar to either side of the workspace, let go, and it will snap into place.
File Selection
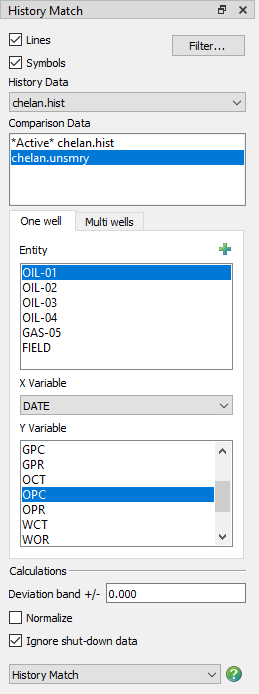
Use the controls in the top region of the sidebar to choose which data sets Tecplot RS will analyze and display.
-
History Data The data set chosen in this menu acts as the active data set to which all other data sets will be compared. Only variables and entities (wells, completions, and so forth) included in the history data set chosen will display in the Data region of the sidebar.
-
Comparison Data All loaded XY data sets except the data set chosen as the History Data display in the Comparison Data list. This list controls which data set(s) Tecplot RS compares to the history data set. Highlight one or more data sets to compare them to the history data set. You can also control which data sets to include in the Compare Data Sets dialog.
Data Selections
The group of controls in the Data region of the sidebar control which entities and variables (determined by the data set chosen as the History Data) are displayed and analyzed.
To compare entities and variables between data sets, Tecplot RS reads each data set for entities and variables with matching names. If the data sets use different names for the same entity or variable, you can include additional aliases for these in your RS Variables file, and edit them on the Variables page of the Plot Options dialog (accessible by selecting from the menu).
On the One Well page, you can choose the following options:
-
Entity Choose which entity to display on the History Match plots from the Entity list.
-
X Variable The variable selected in the X Variable menu will display as the independent (X-axis) variable.
-
Y Variable The variable selected in the Y Variable list will display as the dependent (Y-axis) variable.
On the Multi Well page, you can choose the following options:
-
Wells Choose the wells to be included on the History Match plots from the Wells list. Hold down Ctrl to toggle the state of the clicked items or Shift to make contiguous selections.
-
Time Choose the time step for which the History Match plots should be created.
-
Y Var Choose the variable to be used as the dependent (Y-axis) variable in the History Match plots.
Calculations
The choices in the Calculations region of the sidebar control how Tecplot RS calculates the history matching and defines the acceptable range used and displayed on the Deviation Distribution plot and the Deviation Data plot.
-
Deviation band The deviation band defines the maximum deviation, or error, allowed in each data set compared with the history data. As a measure of error, the deviation band value must be a positive value in the units of the Y-axis variable of the Deviation Data and Deviation Distribution plots. If the "Normalize by Vref" option is chosen on the Delta page of the Compare Data Sets dialog, the deviation band value will be a factor of the normalization. Tecplot RS also saves the deviation band in the project file separately for each Y-axis variable, so you can specify a separate value for each variable.
The deviation band displays as a background fill on the Deviation Data and Deviation Distribution plots as a visual indicator of how well each of the comparison sets matches the history data.
In the legend that appears in the Deviation Distribution plot frame, Tecplot RS displays the percentage of data points for each comparison set that fall within the deviation band, along with the standard deviation of each comparison set.
To turn off the deviation band on the plots and in the legend, type "0" (zero) in the Deviation band field in the sidebar.
-
Normalize Toggle-on the Normalize switch to normalize the comparison by dividing the difference between each value in the two data sets by the reference (history) data.
-
Shut-down switch (Available only in One Well mode) The "Ignore shut-down data" switch specifies how the deviation distribution data are computed, to compensate for measurements during which a well (or other entity) was shut down. When this switch is toggled-on, any data points for which both the history data set and the comparison set are zero will be ignored in the distribution calculations. This is targeted for rate variables, to avoid skewing the deviation factor by including matching values from measurements taken while a well was shut down.
-
Weighting (Available only in Multi Well mode) When Weighting is toggled-on, the specified variable, typically a cumulative variable such as OPT, is used to determine the importance of each well and is included in the "goodness factor" that indicates how well the simulation data matches the actual data. The weighting factors for each well appear on the Deviation Data plot, and the Deviation Distribution plot emphasizes the most important wells by giving them a greater proportion of the Y axis.
The sum of all weighting factors equals 100% unless one or more wells is not found in the comparison data sets (for example, if some well names differ among the files). If Weighting is toggled-off, each well has an equal contribution to the plot.
The weighting coefficient for a given well is the ratio of the variable value for the well to the maximum value of the variable for all wells; for example, Wwell = (OPTwell / OPTmax). The sum of the weighting coefficients, WT, is WT = Sum(Wwell) for all wells. The percent contribution for each well is Pwell = 100 Wwell / WT.
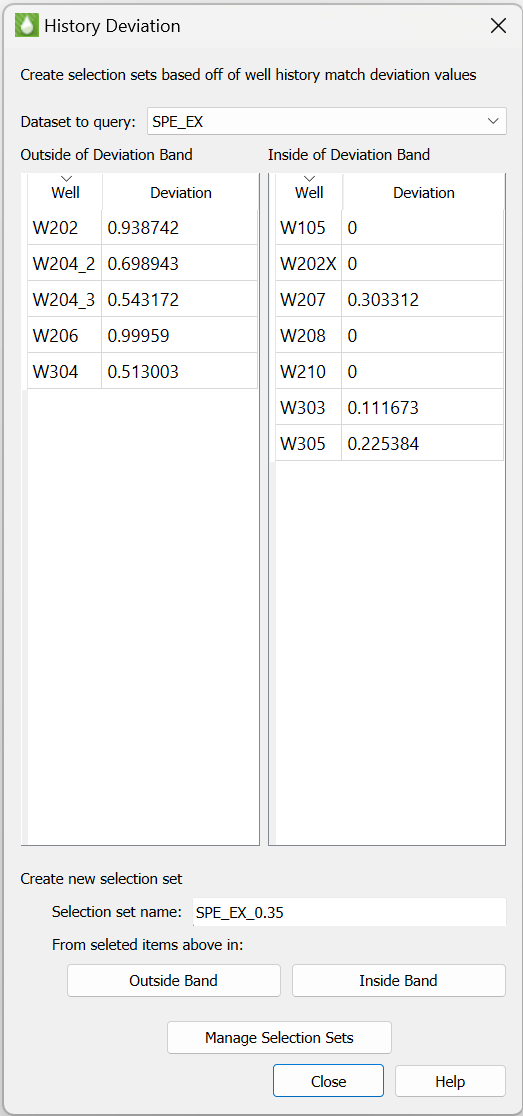
History Deviation Dialog
The History Deviation Dialog allows you to create a selection set of wells that are either inside or outside the current deviation band. You can also select one or more wells and copy them to the clipboard by Right-Clicking either well list and selecting "Copy" or using the Ctrl+C shortcut on the keyboard.
To display the History Deviation dialog click the Deviation Selection Set button on the History Match sidebar.
| The History Deviation dialog is only available for "Multi Well" History match plot types. If the history match plot type is set to "One Well", the History Deviation Dialog is not available. |
The History Deviation dialog has the following options:
|
|