Customization
This section describes how you can use the Preferences dialog in the menu or, more technically, edit your configuration file, to customize aspects of your Tecplot RS sessions.
Performance Dialog
In the Performance dialog you can adjust the methods of Tecplot RS’s image rendering and calculation. This can help optimize your workflow, especially when working with large data sets.
Use the Rendering page of the Performance dialog (accessed from the menu) to adjust the Plot Approximation, Graphics Cache, and Image Export Options. Use the Miscellaneous page of the Performance dialog (accessible from the menu) to adjust Data I/O, Load On Demand, Variable Derivation, and Status Information.
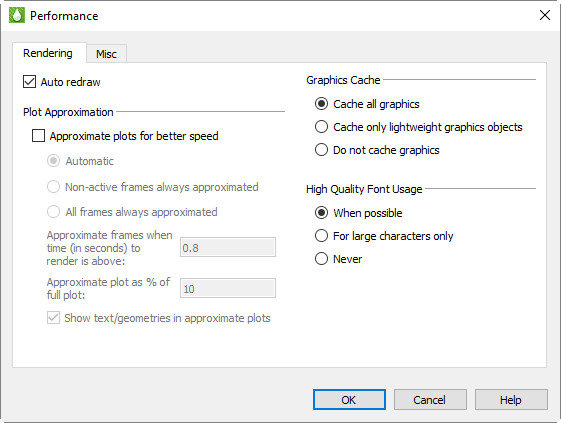
Rendering
The Rendering page of the Performance dialog has the following options:
-
Use Auto Redraw When selected, Tecplot RS will automatically redraw the plot whenever style or data changes. Some users prefer to turn this option off while setting multiple style settings and then click the Redraw All button in the toolbar to see the updated plot.
To interrupt an auto-redraw, click your pointer or press any key. -
Subdivide all volume cells (to resolve saddle point issues) Turn on this control to eliminate holes in iso-surfaces near saddle points. When turned on, all cells are subdivided for the purpose of contouring, slicing, and isosurface generation. This layout property applies to all frames and iso-surfaces.
Plot Approximation
-
Approximate Plots for Better Speed When selected, Tecplot RS builds an approximate representation of the plot. The following settings control the degree of detail of the approximation:
-
Automatic (Default) When the number of data points exceeds the point threshold, Tecplot RS will render the approximate plot for style, data, and interactive view changes, followed immediately by the full plot. This option provides for good interactive performance with the final plot always displayed in the full representation.
-
Non-Active Frames Always Approximated When only one frame exists, this option acts the same as the automatic mode. When the plot contains multiple frames, Tecplot RS sets the active frame to automatic mode while approximating the other frames.
-
All Frames Always Approximated When the number of data points exceeds the point threshold, Tecplot RS renders the approximate plot in all frames. To see the full representation, click the Redraw All button in the toolbar.
-
-
Point Threshold for Automatic Approximation This value controls when Tecplot RS will consider using approximate plots. The optimal value to use depends highly on the computer’s hardware capabilities.
-
Approximate Plot as % of Full Plot This value controls the percentage of geometric detail represented by the approximate plot. The larger the percentage the more closely the approximation represents the original plot. However, the interactive performance is reduced. This number should be adjusted until there is a balance between good interactive performance and sufficient detail. Typically, the percentage should be set to be less than or equal to 50. If values larger than 50% are needed to provide sufficient detail, consider not using approximate plots.
Graphics Cache
Tecplot RS uses OpenGL to render plots. OpenGL provides the ability to cache graphic instructions for rendering and can re-render the cached graphics much faster. This increases speed for interactive manipulation of a plot. However, this performance potential comes at the cost of using more memory. If the memory need is too high, the overall performance could be less.
Use one of the following Graphics Cache modes to optimize your computer’s performance:
-
Cache All Graphics (Default) When selected, Tecplot RS assumes that there is enough memory to generate the graphics cache. If this is valid, Tecplot RS’s rendering performance will be optimal for interactive manipulation of plots.
-
Cache Only Lightweight Graphics Objects Lightweight objects include approximate plots and some other minor items, but do not include full plots. This is a good setting for memory constrained problems. Consider using this option in conjunction with the Plot Approximation mode set to "All Frames Always Approximated".
-
Do Not Cache Graphics Consider using this option when memory constraints are very limited. If you intend to interact with the plot, also consider setting the Plot Approximation mode set to "All Frames Always Approximated".
| In order to optimize animation, graphics caching is temporarily disabled during animations that include zones, line mappings, time, or blanking elements. Graphics caching is not altered during animations that include slices, streamtraces, or iso-surfaces. |
High Quality Font Usage
Tecplot RS supports high quality TrueType font usage. Windows platforms include the TrueType fonts used by Tecplot RS. On the Linux platforms, the fonts have to be obtained and installed.
Tecplot RS has three high quality font modes:
-
When Possible (Default setting for Windows) Tecplot RS uses any of its TrueType fonts that are available for any size text. This produces the best rendering quality; however, performance is slower for large amounts of text.
-
For Large Characters Only Tecplot RS uses the TrueType fonts for large characters only. Small characters will use Tecplot RS’s built-in stroke fonts. This is a good blend of quality and performance.
-
Never Tecplot RS never uses TrueType fonts. This is the default mode for platforms other than Windows and Linux 32 bit operating systems.
Image Export Options
Some graphics cards' hardware does not support off-screen rendering (needed for exporting images). In addition, most graphic hardware produces images off-screen slower than on-screen.
To accommodate a variety of graphic hardware Tecplot RS provides two image export modes:
-
Safe (Render Image Off-Screen) (Default) Tecplot RS will render all exported images off-screen. This allows creation of images not bound by the physical size and state of the Tecplot RS drawing area.
-
Fast (Use On-Screen Image) Tecplot RS will grab the pixels from the physical Tecplot RS drawing area. Any rendering damage, such as occluding windows or partially drawn images will become part of the exported image. In addition, the image size is bound by the physical size of the Tecplot RS drawing area.
Best Practices For Rendering Performance
The factory settings in the Performance dialog are designed for moderately sized data and occasionally may need to be adjusted to optimize Tecplot RS’s rendering performance.
There are many combinations of Plot Approximation and Graphics Cache modes. However, two combinations meet most user’s needs:
-
When visualizing moderate to large size data sets:
-
Toggle-on "Plot Approximation"
-
When using one frame, set the Plot Approximation mode to "Automatic" (Default).
-
When using multiple frames, set the Plot Approximation mode to "Non-Active Frames Always Approximated".
-
-
Set the Graphics Cache mode to Cache All Graphics.
-
-
When visualizing large to very large size data:
-
Set the Graphics Cache mode to "Cache only Lightweight Graphics Objects".
-
For ordered data, setting the Plot Approximation mode to "All Frames Always Approximated" can be helpful.
-
For finite element data, toggle-off "Plot Approximation" to reduce up-front load time. However, this setting may result in unacceptably slow view changes (rotation, translation, zooming, etc.).
-
| The size of the data isn’t the only factor when rendering in Tecplot RS. If your plot includes slices or iso-surfaces, you may also need to adjust your plot approximation mode and graphics cache settings. |
With either case, adjust the "Approximate Plot as% of Full Plot" value to give an acceptable balance between interactive performance and plot detail.
Miscellaneous
The Miscellaneous page of the Performance dialog has the following controls:
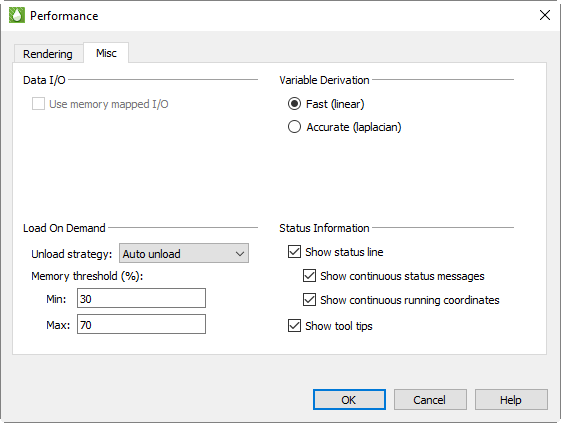
Data I/O
Use Memory Mapped I/O When toggled-on, Tecplot RS will use system-level memory mapping functions to map Tecplot RS variables directly over block data in a binary data file. The advantage of mapping variable data is that Tecplot RS will only load the variable when it is first used. In addition, the mapped variable data can be shared between other Tecplot RS sessions running on the same machine. Memory mapped I/O is most useful when there is a large number of data points to load from a file and they are not all being used by Tecplot RS at the same time. Only variable data that is in a binary block format can be memory mapped.
Load On Demand
With load-on-demand activated, Tecplot RS generates plots faster and using less memory by only loading data that is needed for the plot. If changes to the plot style require additional variables to be loaded, Tecplot RS will automatically load them, and if necessary, unload variables that are no longer used. Tecplot RS’s ability to automatically load and unload variables on demand allows you to examine data that is much larger than the physical or virtual memory of your computer.
For large data sets, Tecplot RS will load only the zones and variables currently in use. However, for small data sets, Tecplot RS may load some other zones and variables for you (based on the Memory Threshold).
-
Unload Strategy Use the Unload Strategy menu to specify how to manage unloading variables and other load-on-demand resources.
-
Auto Unload This strategy attempts to keep Tecplot RS’s memory use within the defined Min and Max Memory Thresholds. Tecplot RS uses these values to determine when and how much it should unload. This is the best option for exploring data as Tecplot RS only unloads if and when the memory threshold has been exceeded.
-
Minimize Memory Use This strategy is used if more aggressive unloading of variables and other load-on-demand resources is required. This option is best suited for animating through a very large number of time steps, where each time step consumes a significant part of the computer’s available physical and virtual memory.
-
Never Unload This strategy disables the unloading capability of load-on-demand while still preserving the ability to load variables on demand.
Most users should select either "Auto Unload" or "Minimize Memory Use" for best results.
-
-
Memory Threshold (%) [Auto Unload ONLY] When Tecplot RS uses at least the maximum percentage of the available physical and virtual memory, it will attempt to unload variables and other load-on-demand resources until the available physical and virtual memory is at or below the specified minimum percentage.
Variable Derivation
When Tecplot RS needs to create a nodal variable from a cell centered variable, it uses a prescribed derivation method. Tecplot RS provides two such derivation methods: fast and accurate.
-
Fast (Linear) When selected, Tecplot RS uses simple averaging to derive a nodal variable from a cell centered one.
-
Accurate (Laplacian) When selected, Tecplot RS uses Laplacian interpolation to derive a nodal variable from a cell centered variable.
Status Information
Since the display of the status line in the Tecplot RS workspace requires memory usage, you can adjust the Status Line settings in this dialog to optimize your Tecplot RS experience. Use the following controls in the Status Information region of the Performance dialog to customize what Tecplot RS displays in the status line:
-
Show Status Line Toggle this option on/off to control the display of status messages.
If you are remotely displaying Tecplot RS on an X terminal, updating the status line can slow down processing. If this is the case, toggle-off the Show Status Line option. -
Show Continuous State Messages Toggle-on this option to receive context sensitive commentary in the Status Line.
-
Show Continuous Running Coordinates Toggle-on this option to display the pointer’s coordinates in the status line.
-
-
Show Tool Tips Use this option to turn the display of tool tips on or off.
Configuration Files
A Tecplot configuration file is a special type of Tecplot macro file that Tecplot RS reads on start up. Use customized configuration files to override any or all of Tecplot RS’s factory default settings.
Loading Configuration Files in Tecplot RS
Tecplot RS looks for configuration files (named tecplot.cfg) in one of three places: the current working directory, the user’s home directory, and the Tecplot RS installation folder. Tecplot RS looks for the configuration file (in the respective order listed above) and uses the first configuration file found.
| The names of the default configuration files used in Tecplot RS vary from platform to platform; this section concentrates on Windows and Linux files. |
If you want to force Tecplot RS to load a specific configuration file (instead of one of the standard files named above), you can use the -c command line option when starting Tecplot RS.
System administrators can use the tecplot.cfg file in the Tecplot RS installation folder to set system-wide defaults, then others on the system can copy the system configuration file to their own installation folders and make any desired changes. Tecplot RS will use the settings in your local configuration file instead of the settings in the system configuration file.
| A configuration file needs to include only those options for which you want to override defaults. |
Tecplot RS on Linux platforms has a second type of configuration file: an X11 resource file (app-defaults file) that controls the appearance of the Tecplot RS application and its dialogs. Most users do not need to concern themselves with this file; nothing in the resource file has any effect on the plots you create with Tecplot RS, either on screen or on paper. However, if you are an experienced Linux and X11 user, you may want to modify some of the resources to improve the appearance of Tecplot RS’s windows and dialogs on your display. Interface Configuration (Linux) explains how to do this.
Configuration File Creation
The simplest way to customize a configuration file is to edit settings in the default tecplot.cfg file present in your Tecplot RS installation folder.
Editing the Configuration File
You are not limited to customizing only those settings that appear in the default configuration file. Most settings that can be modified by the $!Field, $!LineMap, or $!Interface macro commands can be changed in the configuration file directly. You can use the $!Limits macro command in the configuration file only.
The simplest way to do this is to create and save a project or macro with the settings you want, and then copy and paste the appropriate commands from your project (.rsprj) or macro (.mcr) file into your configuration file. See the Tecplot 360 Scripting Guide (accessible on the Tecplot Web site) for complete details on macro commands.
SetValue Commands
SetValue Commands are macro commands used to specify the value of a given plot attribute. You can add SetValue commands to your tecplot.cfg file to override any of Tecplot RS’s default settings. For example, suppose you want your 2D axes to appear cyan. You can add this preference to your configuration file as follows:
-
Using the Tecplot RS interface, create a 2D plot with cyan axes while either recording your steps as a macro, or saving the result as a Tecplot RS project.
-
Open the resulting macro or project with a text editor, and scan for the lines that set the 2D axis colors. The following example shows the commands that specify the X- and Y-axis details in a 2D grid plot with cyan axes:
$!TwoDAxis XDetail{RangeMin = -3} $!TwoDAxis XDetail{RangeMax = 15} $!TwoDAxis XDetail{GridLines{Show=Yes}} $!TwoDAxis XDetail{AutoGrid=No} $!TwoDAxis XDetail{GrSpacing = 5} $!TwoDAxis XDetail{GridLines{Color = Cyan}} $!TwoDAxis YDetail{GridLines{Show = Yes}} $!TwoDAxis YDetail{GridLines{Color = Cyan}} -
Discard everything but the lines that actually set the color:
$!TwoDAxis XDetail{GridLines{Color = Cyan}} $!TwoDAxis YDetail{GridLines{Color = Cyan}} -
Paste the resulting lines into your configuration file.
Plot Default Setting - FieldMap and LineMap
You can include a single $!FieldMap command to set plot defaults. You cannot specify the zone in the configuration file, and the command is not effective for values set dynamically by Tecplot RS, such as Mesh Color. In the example below, the default contour type is Flood, scatter symbol shape is Delta, and scatter size is 1.8.
$!FieldMap Contour{ContourType = Flood}
$!FieldLayers ShowScatter = Yes
$!FieldMap Scatter{SymbolShape{GeomShape = Del}}
$!FieldMap Scatter{FrameSize = 1.8}
In the same way as above, you can add a single $!LineMap command for line mapping defaults. In the example below, XY and Polar Line mappings will have a dashed line pattern, and symbols will be filled circles.
$!LineMap Lines{LinePattern = Dashed}
$!LinePlotLayers ShowSymbols = Yes
$!LineMap Symbols{SymbolShape{GeomShape = Circle}}
$!LineMap Symbols{FillMode = UseLineColor}
Override Automatic View → Fit Everything
When loading a plot, Tecplot RS automatically fits all 3D surfaces, data points, text, and geometries to the frame. To revert to the old Tecplot RS behavior, add the following line to your tecplot.cfg file:
$!FrameSetup Initial3DScale = 0.7Interface Configuration
The many members of the $!Interface macro help you configure Tecplot RS’s user interface and graphics drawing capabilities. Although some of these commands can be executed in any Tecplot RS macro, the best place to put these is in the Tecplot RS configuration file: tecplot.cfg. Below are a few examples. Refer to the Tecplot 360 Scripting Guide for a complete listing.
General Interface Configuration Options
$!Interface followed by:
-
MouseActions {MiddleButton {SimpleDrag=ZoomData}} Specify the action of the middle pointer button dragging. The Tecplot 360 Scripting Guide (available on the Tecplot Web site) lists several other options for the middle and right pointer buttons. Tecplot RS can execute these commands only from the configuration file.
-
UnixHelpBrowserCmd = string Specify the default browser for viewing the Help files (Linux platforms only). This command can only be executed from the Tecplot RS configuration file.
-
ShowWaitDialogs = (Yes, No) Disable the launch and display of all Wait dialogs by setting this to No. (Wait dialogs are launched during long operations and give you the ability to cancel the operation.) This is useful on some Linux systems where transient dialogs do not drop properly, leaving a gray box that obscures part of Tecplot RS’s drawing area.
-
UseStrokeFontsOnScreen = (Yes, No) - If set to Yes, Tecplot RS draws all text in the work area using internal stroke fonts. If set to No, the native True Type fonts will be used instead. This option has no effect on Linux platforms.
-
UseStrokeFontsFor3DText = (Yes, No) If set to Yes, Tecplot RS draws all 3D text in the work area using internal stroke fonts. 3D text consists of ASCII scatter symbols and node and cell labels when the active plot type is 3D Grid. For 3D text, this setting overrides the setting of UseStrokeFontsOnScreen. If set to No, Tecplot RS uses the native True Type fonts instead. This option has no effect on Linux platforms.
OpenGL-Specific Configuration Options
Several options are available to further tune Tecplot RS to operate with the OpenGL capabilities of your platform. To assign values to these parameters you must use the $!Interface OpenGLConfig command. The Tecplot 360 Scripting Guide includes a complete list of these options.
$!Interface OpenGLConfig followed by:
-
{AllowHWAcceleration = (Yes, No)} In some cases, bugs in OpenGL drivers cause problems in Tecplot RS. In these situations, Tecplot RS will typically behave better if this options is set to No. However, Tecplot RS will also run slower.
-
{ScreenRendering {DoExtraDrawForLastPixel = (Yes, No)}} Some OpenGL implementations use an optimization for line drawing that omits the last pixel in the line. Set this to Yes to change all line drawing to force the last pixel to be drawn. This setting applies only to drawing on the screen.
-
{ScreenRendering {StippleAllLines = (All, Critical, None)}} - Set to All to make all lines drawn using stippling. Set to Critical to use stippling for stroke and user-defined fonts. Set to None to disable stippling. This setting applies only to drawing on the screen.
-
{ImageRendering {DoExtraDrawForLastPixel = (Yes, No)}} Some OpenGL implementations use an optimization for line drawing that omits the last pixel in the line. Set this to Yes to change all line drawing to force the last pixel to be drawn. This setting applies only to exporting images from Tecplot RS.
-
{ImageRendering {StippleAllLines = (All, Critical, None)}} Set to All to make all lines drawn using stippling. Set to Critical to use stippling for stroke and user-defined fonts. Set to None to disable stippling. This setting applies to exporting images from Tecplot RS.
Default File Name Extensions
You can also change the default extensions for file names in file input-output dialogs in the configuration file. To change these settings, use the FNameFilter sub-command in the $!FileConfig macro command.
$!FileConfig FNameFilter followed by:
-
ColorMapFile = <string> Specifies the default extension for color map files.
-
InputDataFile = <string> Specifies the default extension for input data files.
-
OutputAsciiDataFile = <string> Specifies the default extension for ASCII output files.
-
OutputBinaryDataFile = <string> Specifies the default extension for binary output files.
-
StyleFile = <string> Specifies the default extension for stylesheet files.
-
MacroFile = <string> Specifies the default extension for macro files.
-
EquationFile = <string> Specifies the default extension for equation files.
For example, to change the default extension for input data files to be .tbl use:
$!FileConfig FNameFilter {InputDataFile = "*.tbl"}Default Temporary Directory
Tecplot RS writes out a number of temporary files. To customize where Tecplot RS places these files, add the following macro command to the tecplot.cfg file:
$!FileConfig TempFilePath = "tempfilepath"where tempfilepath represents the new path. The default path is system dependent.
Interface Configuration (Linux)
On Linux platforms, the style of the graphical user interface for Tecplot RS is configured, for the most part, by a resource file called TecplotRS, which resides in the app-defaults folder below the Tecplot RS installation folder. If you edit this file, the changes will affect all users. Alternatively, if you want the changes to apply only to your own execution of Tecplot RS, you can add entries to a file called .Xdefaults, which resides in your own $HOME directory. If the file .Xdefaults does not already exist in your home directory, you can create one.
Custom Character and Symbol Definition
When Tecplot RS launches, it reads the font file (tecplot.fnt). This file contains information that defines the appearance of text characters on the screen. Tecplot RS defines and draws characters on the screen as a set of straight lines called strokes. These stroked characters approximate the appearance of characters for the screen.
The font file is an ASCII file. You can modify the shape, size, and resolution of existing stroke font characters or add completely new ones. In PostScript print files, text characters are generated using PostScript defined fonts, not the stroked fonts. If you are using the Windows version of Tecplot RS and the Windows print drivers are active, then all text except text using the User-Defined fonts is serviced by the Windows printer driver. However, the text characters in bitmap export files are in stroked fonts (since they are generated from the screen). The inter-character spacing in all output files is determined by the character-width definitions in the font file. When using PostScript print files or the Windows print drivers, changing the font commands affects only the character shape for User-Defined fonts and the character spacing for all fonts.
The Font File is structured as follows:
#!FF 4
CharCellHeight
Stroke command set for Helvetica Font
Stroke command set for Greek Font
Stroke command set for Math Font
Stroke command set for User-Defined Font
Stroke command set for Times Font
Stroke command set for Times Italic Font
Stroke command set for Courier Font
The file type and version are on the first line ("FF" refers to Font File). CharCellHeight is the interline spacing (the height of a capital M plus some vertical space) in the units of a two-dimensional coordinate system used to define the stroke-font characters. The baseline of the characters is at zero. Before Tecplot RS uses the character definitions, they are normalized by the character cell height.
Following the character cell height, there are seven sets of stroke commands, one set for each font as shown above. Each stroke command set consists of definitions for the characters in the font. Each font has a base set of 96 characters (character indexes 32 to 127). Some fonts also include an extended set of characters (character indexes 160 to 255). The extended characters are needed to complete the character sets for most of the common European languages.
All seven stroke command sets must be present, and each must have at least one character defined. Each stroke command set begins with the definition for a space (character index 32). After that, characters within a stroke command set can be defined in any order. If a character is not defined in the Font File, it is drawn as a blank.
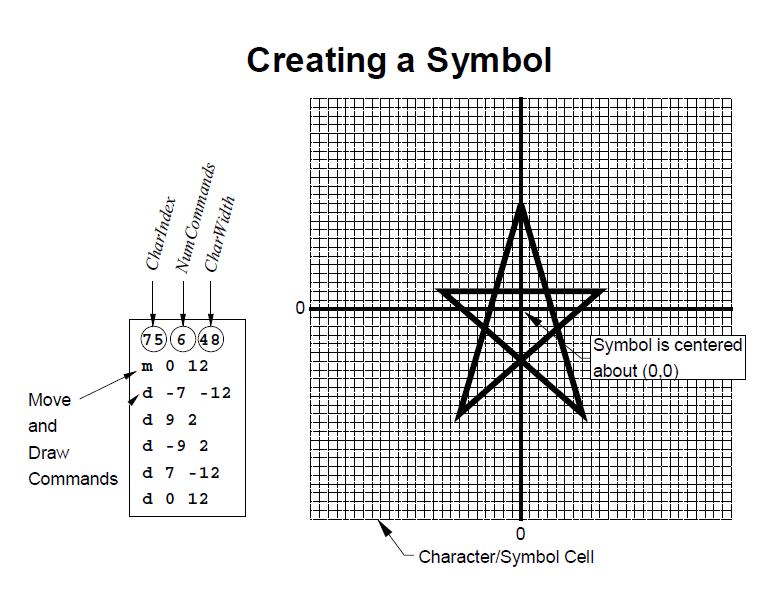
Each character in a stroke command set is defined as follows:
CharIndex NumCommands CharWidth
 Command1
 Command2
 Command3
.
.
.
 CommandNumCommands
CharIndex is the character index that ranges from 32 to 127 and 160 to 255 for each font (see Custom Characters for the matching of the character index to the English, Greek, Math, and standard User-Defined font characters). NumCommands is the number of stroke commands defining the character that follows. CharWidth is the character width, which determines the spacing of the characters.
A command may exist in one of the following forms:
-
m x y.
-
d x y.
-
mr dx dy.
-
dr dx dy.
Where:
-
A command that begins with an m is a move command.
-
A command that begins with a d is a draw command.
-
Commands mr and dr are relative move and relative draw commands.
-
The x and y are the absolute coordinates within the character cell.
-
The dx and dy are the relative coordinates with respect to the previous location (increments from the position attained by the previous command).
-
All coordinates are specified as integers.
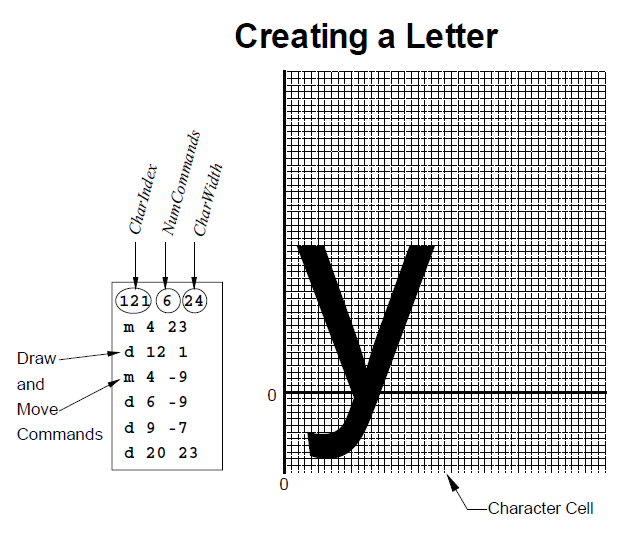
Defining a user-defined plotting symbol shows an example of a character cell and the commands used to define the lowercase letter "y". The height of the character cell is 48.
Defining a user-defined plotting symbol shows a symbol being defined. Symbols should be centered about (0, 0) so that they are centered about the point they mark. The font file included with Tecplot RS contains many User-Defined font stroke commands. Most of these are for creating extra plotting symbols, accessible when you use the Symbol Type "Other", enter an ASCII character, and specify the User-Defined font.