Data Export
Your Tecplot RS installation allows you to manipulate your data to use for new simulator input with the following routines:
-
Property Modifier - Use the Property Modifier dialog to create an ASCII file to use as input into reservoir simulation programs to modify grid properties within the simulator.
-
Extract Data by Cell - Use the Extract Data by Cell dialog to save information about cells to a file (Grid data ONLY). You have the option to save information about all cells, all blanked cells or all visible cells.
-
Extract Data by Well - Use the Extract Data by Well dialog to save information about a well or group of wells to a file (Grid data ONLY).
-
Well Editor - Use the Modify Wells dialog to interactively create or modify a well trajectory.
Property Modifier
Using the Property Modifier dialog, you can create an ASCII file to use as input into reservoir simulation programs. The dialog allows you to change values of any of the properties in the grid file. You can apply the changes to the entire grid or to a subset of the grid (either according to blanking criteria or by drawing a boundary). Using the Property Modifier dialog will not alter the values in the grid solution files. Instead, the Property Modifier dialog directs Tecplot RS to create a new file that the VIP, Eclipse, or Chears input decks can use.
Open the Property Modifier dialog by choosing .
To use the Property Modifier dialog, perform the following steps:

-
Load and display the grid solution files containing data to be modified. The displayed view (2D or 3D) impacts the cells chosen for inclusion in the file. To limit the output to a single plane, use a 2D view. Use a 3D view to choose cells in multiple planes.
-
In the Property Modifier dialog, specify which cells to apply modifications to: visible cells, blanked cells, cells inside boundary, or cells outside boundary.
-
To apply property modifications to the displayed cells, choose "Visible cells" and do not use Cell Value Blanking, Pick Blanking or Inside Views. Otherwise:
.. To apply the modifications to visible or blanked cells, specify the blanking criteria in the Cell Blanking dialog (accessed with the button in the toolbar)
or any of the
Inside Views options.
button in the toolbar)
or any of the
Inside Views options.-
To apply the modifications using boundary criteria, use the second portion of the dialog to create the boundaries.
-
-
If you chose either of the boundary options in the Apply Modifications To region of the dialog, use the Boundary Creation region of the dialog to create the boundary. To use boundary criteria for your property modification, you must use an aerial view of your plot. In multi-frame plots, you must also have Frame 1 highlighted.
Use the buttons to create the boundary:
-
 Insert a
rectangular boundary region.
Insert a
rectangular boundary region. -
 Insert a circular
boundary region
Insert a circular
boundary region -
 Insert a polygonal
boundary region
Insert a polygonal
boundary region -
 Erase the
boundary region
Erase the
boundary regionYou can use only one boundary region at a time. If you insert a second boundary region, the last one you drew will be erased automatically.
-
-
After you have created your geometry, specify whether to include cells inside geometry when the boundary encloses all corners, or when the boundary encloses at least one corner. When you apply property modifications according to a boundary, only the visible cells will be used. To apply the property modifications to all cells affected by your boundary, do not use Cell Value Blanking, Pick Blanking or Inside Views.
-
Once you have specified which cells to apply your modifications to, you are ready to make your modifications in the Modifiers region of the dialog.
-
Use the Property menu to specify the property to modify. The Property variables match the variable list for the currently loaded grid file.
Selecting a different property to use in the Property Modifier dialog does not change the property displayed in your plot. Use the Variables region of the sidebar to change the variable displayed in your plot. -
From the Operator menu, you can choose from the operators =, +, -, *, /, @ (Property to the Value power), & (Value to the Property power), >, or <.
The inequality operators > and < force a minimum or maximum value, respectively; any values less than the specified value (or greater than, in the latter case) will be replaced by the provided value. For example, < 1600 replaces any values larger than 1600 with 1600, so that all values are no greater than 1600.
-
You can type any number as the value. Tecplot RS does not validate this value in any way.
-
-
After you have specified the property modifications, click the Apply Modifiers to Plot button to apply the changes. If you have the same property (variable) displaying in your grid plot, the plot will reflect the applied change. Click Reset to Original Values to undo the property modification.
-
Use the File Output region of the dialog to write out your property modifications.
-
Choose the desired output format (Chears, Eclipse, VIP, or INTERSECT) from the Output Format menu.
-
Click the File button when you are ready to output the data to a file. A Write Text File dialog will appear with a default file name matching the grid file name but with an extension of .txt. If the file already exists, a dialog will prompt you to either overwrite the file or append it. This allows you to output multiple property modifiers into a single file.
-
Click the Write Equations button to write out the modifiers to the file you specified with the File button. Alternatively, click the Copy Values button to write out the values for the variable chosen in the dialog to the file specified with the File button.
-
| When you use the Copy Values option, Tecplot RS will output all grid cells for the chosen variable (regardless of blanking and boundary settings). |
If you choose to output your property modifications to a file, the output box at the bottom of the Property Modifier dialog will display the name of the file to which Tecplot RS wrote your output and a summary of the output (the summary displays the equations, if you clicked Write Equations, or a message indicating that the values were copied, if you clicked Copy Values).
Property Modifier Output
The output file will contain information which identifies:
-
The property (variable) being modified
-
The grid name (if cells are in an LGR)
-
The range of cells to be modified
-
The operator (for example: equals, add, subtract)
-
The value
In general, the output is an equation for modifying the existing properties. The equations are specific to VIP, CHEARS, Eclipse, or INTERSECT, depending on the chosen Output Format. They are not in the format of the Tecplot Data Alter equations. For additional details regarding the file format, refer to the VIP, CHEARS, Eclipse, or INTERSECT user’s manual.
CHEARS Variable Names
For some variables, the names in the .init and .unrst files differ from what CHEARS needs for the property modifier input deck.
Tecplot RS will translate the following variable names when writing equation data to CHEARS format files:
| .init or .unrst name | Output file name |
|---|---|
PORVOL |
POREVOLUME |
POROS |
POROSITY |
TOPDEPTH |
TDEPTH |
PERMX |
XPERM |
PERMY |
YPERM |
PERMZ |
ZPERM |
KRREG |
KRREGION |
EQLREG |
EQUILREG |
CHEARS File Formats
Output in CHEARS format by way of the Write Equations button uses the following format when you are modifying data:
****Comment *****
VARNAME
WINDOW I1 I2 J1 J2 K1 K2 (operation) value
(WINDOW line may be repeated)
The header indicates the operation performed and the chosen selection method. The next line specifies the variable being modified. Tecplot RS then specifies a WINDOW of cells bounded by I1, I2, J1, J2, K1, and K2 limits. The indicates what to do with the value, and the final number is the user-supplied value. Below is an example of subtracting 0.5 from the POROSITY of the visible cells:
****Output Visible Cells *****
POROSITY
WINDOW 1 4 1 1 1 1 - 0.500000
WINDOW 1 3 2 2 1 1 - 0.500000
WINDOW 1 3 3 3 1 1 - 0.500000
WINDOW 1 1 4 4 1 1 - 0.500000
When using Copy Values, the output file uses the following format:
****Comment ****
VARNAME
CELLS i1 i2 j1 j2 k1 k2 =
value1 value2 ... valueN
The header indicates the operation performed. The next line specifies the variable being modified. A group of cells is specified using their I/J/K boundaries, followed by, on the next line, the values of these cells. For example:
****Copy cell values from plot *****
PRESSURE
CELLS 1 24 1 12 1 10 =
0.0000 0.0000 0.0000 ...
Eclipse File Formats
When using Write Equations, an Eclipse file will have a format based on the following template:
-- Comment
(op)
VARNAME value I1 I2 J1 J2 K1 K2 /
(the above line may be repeated)
That is, a comment indicating the operation and the selection, followed by a line indicating the operation, which is spelled out in Eclipse format (ADD for +, etc.). This is followed by one or more lines indicating the variable name, the value to be applied, and the I/J/K window to be modified. Multiple of this latter kind of line will appear if there are multiple regions being modified based on the selection type. The variable name and value will be repeated on each line in this case. For example:
-- Output Visible Cells
ADD
PRESSURE 1.0000 13 18 5 1 1 /
For Copy Values, the file format is slightly different:
-- Comment
BOX
I1 I2 J1 J2 K1 K2 /
VARNAME
value1 value2 ... valueN
After the comment, separate lines contain the command BOX, the I/J/K window of the full data set, the variable name, and the values in the individual cells. For example:
-- Copy cell values from plot
BOX
1 24 1 12 1 10 /
PRESSURE
0.0000 0.0000 0.0000...
VIP File Formats
For Write Equations, the VIP file output format adheres to the following syntax:
! Comment
VARNAME
MOD
I1 I2 J1 J2 K1 K2 (operation)value
(above line may be repeated)
That is, a comment line indicating the operation and the selection, the name of the variable name being modified, the keyword MOD indicating modification, each on its own line. This is followed by one or more lines indicating the I/J/K window being modified, the operation, and the value. For example:
! Output Visible Cells
PRESSURE
MOD
13 18 5 5 1 1 +1.0000
When using Copy Values, the following format is used:
! Comment
VOVER VARNAME
I1 I2 J1 J2 K1 K2 EQ
value1 value2 ... valueN
This format includes a comment line, a VOVER command followed by the name of the variable, specifications for the I/J/K window constraining the data, the EQ command, and the values of the cells. For example:
! Copy cell values from plot
VOVER PRESSURE
1 24 1 12 1 10 EQ
0.0000 0.0000 0.0000 ...
Intersect File Formats
INTERSECT output is in two parts. The first part defines the cells to be modified using the IJK indices. The GLOBAL grid is assumed, but if the cells are part of an LGR, its name is also included.
# Comment
CellSelectionFamily "quinaultlgr_Fam1" {
   Cells = [[
 (4 1 1) (5 1 1) (6 1 1) (7 1 1) (8 1 1) (9 1 1) (10 1 1) (4 2 1)
 ('B_INJ' 6 1 1) ('B_INJ' 3 2 1) ('B_INJ' 4 2 1) ('B_INJ' 5 2 1)
   ]]
   SelectionNames = ["quinaultlgr_Sel1"]
}
Comments are designated by the # symbol.
Once the cell selection is defined, there will be one or more property modifiers as follows:
CellPropertyEdit "quinaultlgr_Prop1" [
   Family                 Name                   Property           Expression
   "quinaultlgr_Fam1"     "quinaultlgr_Sel1"     "PRESSURE"         "PRESSURE + 2000"
]
INTERSECT does not support copying individual values from an altered plot.
Extract Data by Cell
The Extract Data by Cell dialog enables you to extract a range of cells from your grid plot for export into another file or format (this option is not available for XY plots). Open the dialog by going to .
CSV Extractions by Cell
The Extract Data by Cell dialog has various options based on the selected format. When "CSV" displays as the format, the following controls display:
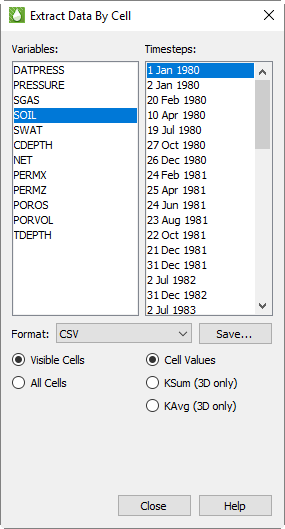
-
Variables The Variables box lists all of the variables available in the grid. Tecplot RS highlights the first variable by default. Use the Ctrl and Shift keys to highlight a set of variables to include in the output file.
-
Time steps The Time steps box lists all of the time steps available in the grid. Tecplot RS highlights the first available time step by default. Use the Ctrl and Shift keys to highlight a set of time steps.
-
Visible/All Cells The selectable options at the bottom region of the dialog specify whether to save visible cells or all cells. The latter is available only when saving cell values (see next option). The Inside Views region of the sidebar controls the settings for visible cells. You may also use Cell Value Blanking and Pick Blanking to exclude cells from export.
-
Cell Values/KSum/KAvg Choose to save the actual cell values, or KSum or KAvg. The latter are available in only 3D Grid plots and always save the sum or average of visible cells (the Visible/All Cells setting is not used). The output for KSum or KAvg always encompasses the full range of I and J values available in your data. KSum and KAvg output is provided for all grids (global and LGRs) plus all selected variables and time steps.
-
Save CSV Click the Save button to save the data to a csv file. Tecplot RS outputs the data delimited in a column format. For each group of data, one header line indicates the name of the data in each column of output. The static data (ordered by LGR) will appear in the file first. The static data will be followed by all time-dependent data, output by time step, then LGR.
| The time format (date or time) listed in the Time steps box is determined by the setting on the Load/Save page of the Plot Options dialog. Refer to Miscellaneous Settings for additional information. |
Sector Data Extractions by Cell
You can also choose to output a continuous IJK range of cells, known as a "sector" of data. For example, the group of cells 1-5 in the I-dimension, cells 2-4 in the J-dimension, and cells 2-3 in the K direction could define a sector of data. To output a three-dimensional group of cells like this, choose "Sector Data" from the Format menu in the Extract Data By Cell dialog, and related options will appear in the dialog.
| A "sector" of data represents a continuous, three-dimensional grouping of cells. You can define and extract a sector of data in the Extract Data By Cell dialog after choosing "Sector Data" as the data format to extract. |
When you choose from the Format menu, the Variables and Time Steps options remain the same as for CSV extraction, but additional controls appear beneath.
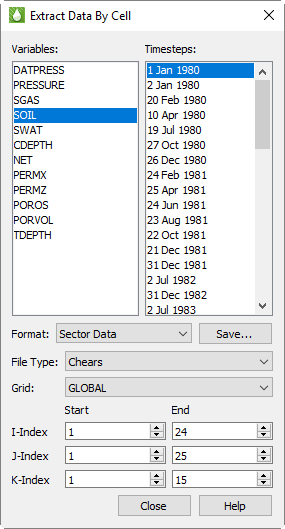
-
File Type Choose from Chears, Eclipse, or VIP as the file type of the sector data output file. The output formats match the Property Modifier File Output formats.
-
Grid From the Grid menu, choose the grid from which to pull the data. By default, Tecplot RS will choose the GLOBAL grid.
-
I-Index Start and I-Index End In the Start and End boxes to the right of the I-Index label, indicate the range of cells in the I dimension to extract.
-
J-Index Start and J-Index End In the Start and End boxes to the right of the J-Index label, indicate the range of cells in the J dimension to extract.
-
K-Index Start and K-Index End In the Start and End boxes to the right of the K-Index label, indicate the range of cells in the K dimension to extract.
-
Save Sector Data Click Save to save the sector data to a file of the type chosen (Chears, Eclipse, or VIP).
Extract Data by Well
Use the Extract Data by Well dialog (accessible by going to ) to save information about a well or group of wells to a file (Grid data ONLY).
The Extract Data by Well dialog has the following controls:
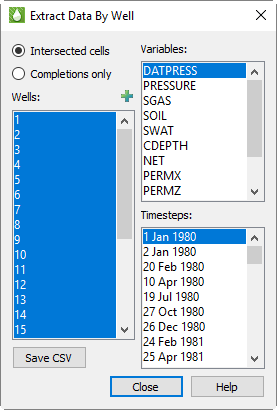
-
Cell Options radio controls Specify whether to save completion (connection) nodes only or completion nodes and intersected cells.
-
Intersected cells When chosen, the output file will include completion node and intersected cell information.
-
Completion cells When chosen, the output file will include only completion nodes.
-
-
Wells list The Wells box lists all of the wells in the grid. All of the available wells are highlighted by default. Use the Ctrl and Shift keys to highlight a subset of the available wells. Click the
 button in the
upper-right corner to launch an expanded, searchable entity list.
button in the
upper-right corner to launch an expanded, searchable entity list. -
Variables list The Variables box lists all of the variables available in the grid. By default, the first variable is selected. Use the Ctrl and Shift keys to highlight a subset of variables to be included in the output file.
-
Time steps list The Time steps box lists all of the time steps available in the grid. The first time step is highlighted by default. Use the Ctrl and Shift keys to highlight a subset of time steps.
| The time format (date or time) is determined by the setting in on the Load/Save page of the Plot Options dialog. Refer to Miscellaneous Settings for additional information. |
-
Save CSV Click this button to save the data to a csv file. Tecplot RS outputs the data comma-delimited in column format. The data will be output in one group, ordered by time step. This function does not treat static variable data differently than time-dependent data; if you choose a static variable and multiple time steps, the output file will repeat static values for each time step.
The available variables in this dialog do not include derived (equation) variables. If these are needed, you can instead use Extract Data by Cell with the following settings:
-
From the sidebar, activate Inside Views - Well Blanking and choose the desired wells.
-
Toggle the "Include Intersected Cells" checkbox to determine whether or not these cells are included in the display and the output file.
-
In the Extract Data By Cell dialog, choose Visible Cells and proceed with the export.
The CSV file created by Extract Data By Well includes the well name. You may want to load the CSV file into Excel and sort the data by well name. If your well names begin with a number, you may also need to first click on that column and indicate that the data should be formatted as text (not numeric).
Well Editor
You can use the Well Editor dialog (accessible by selecting ) to interactively create or modify a well trajectory and output the I,J, K indexes of the cells with completions. The dialog becomes available when at least one grid file is loaded and a grid plot type (2D or 3D) is active.
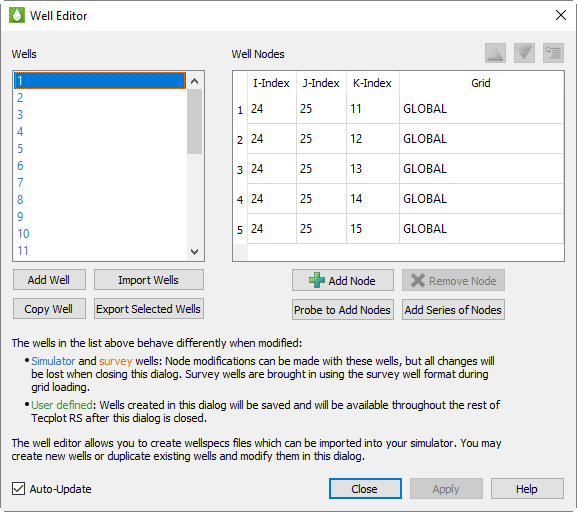
The Well Editor dialog allows you to create new well trajectories, or modify existing well paths for your simulator input.
To create a new well trajectory:
-
Click the Add Well button to add a well to the Wells list. Right-click the well name and select Rename then type a well name.
-
Edit the I, J, and K indexes of any highlighted node, along with the Grid assignments for existing Well Nodes by double-clicking the value of the column and either typing a value or using the arrows. Click Apply to update the Well Nodes list with the modified values. Alternatively, have Auto-Update checked to automatically update the plot without the Apply button.
The modified well trajectory will appear as a diverging red line from the original well line.
-
You can also add new nodes to the list by clicking the Add Node button. This adds a duplicate node of the last node in the list. Modify the values of the highlighted node and click the Apply button to save your edits to the Well Nodes list.
Nodes can also be added via the Probe to Add Nodes button and the Add Series of Nodes button. The Add Series of Nodes will create a series of nodes for an existing well.
The well trajectories do not modify the wells themselves. Instead, Tecplot RS draws a red 3D polyline on the plot to show the new well trajectory. Turn on Translucency in the sidebar to see the line. -
Once you have completed your desired changes, selecting Close will update the dataset with your survey wells. Wells not yet added to the dataset will be bolded in the Well list.
-
If you would like to include the well trajectory in your simulator input, highlight the wells you would like exported, then click the Output button to write the data to a file.
Add Node Series
Clicking the Add Series of Nodes button opens the Add Node Series dialog. This creates a series of nodes increasing or decreasing in a certain I, J or K direction. The inital node location defaults to the smallest, active IJK position.
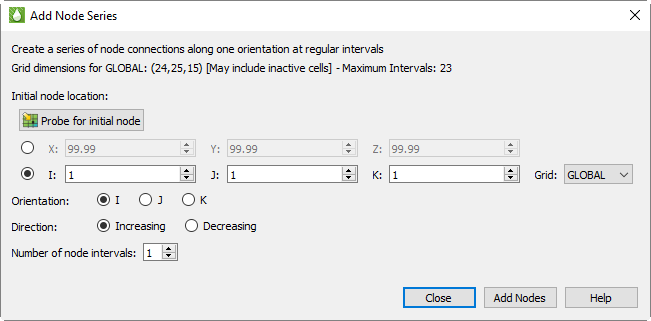
Enter the desired start position in either XYZ or IJK coordinates. Alternatively, probe for the initial node location. Select orientation (the I, J or K axis to increment along) and choose the direction (increasing or decreasing). Finally input the number of node intervals. For your benefit, the maximum number of intervals is shown at the top of the dialog.
When ready, select the Add Well button to add the Well Series as a set of new nodes for the selected well.
Well Data Output
The output is saved in Eclipse format. Here is an example:
WELSPECS
 'GAS-05'_123 2 1'GAS' /
/
COMPDAT
 'GAS-05'_23 2 2 2 'OPEN'_20.708 10.0 1'Z' /
 'GAS-05'_23 2 3 3 'OPEN'_20.708 10.0 1'Z' /
/
The WELSPECS section includes the following well parameters:
-
Well name
-
Name of Well group (the default is used)
-
I location of well head
-
J location of well head
-
Reference depth for bottom hole pressure (the default is used)
-
Preferred phase for the well
The COMPDAT section includes the following completion parameters:
-
Well name
-
I location of the completion
-
J location of the completion
-
Minimum K value of completion(s)
-
Maximum K value of completion(s)
-
Open/shut flag
-
Saturation table number for connection relative permeabilities (the default is used)
-
Transmissibility factor for the connection (the default is used)
-
Well bore diameter (always written as 0.708)
-
Effective Kh (the default is used)
-
Skin factor (always written as 0.0)
-
D-factor (the default is used)
-
Direction in which the well penetrates the grid block (always written as Z)
| The "GLOBAL" grid in Tecplot RS will be called "COARSE" in the output file. All other grid names will be output as they are named in Tecplot RS. |