Plot Options
The Plot Options dialog allows you to control the appearance and style of your plots. Each page of the dialog focuses on customizing a particular aspect of your plot.
To access the Plot Options dialog, click the Plot Options button in
the sidebar,  , or
choose from the menu. You can also
quickly access most of the pages of the "Plot Options" dialog by
double-clicking on the plot object that you want to edit.
, or
choose from the menu. You can also
quickly access most of the pages of the "Plot Options" dialog by
double-clicking on the plot object that you want to edit.
The following options are available:
Load/Save
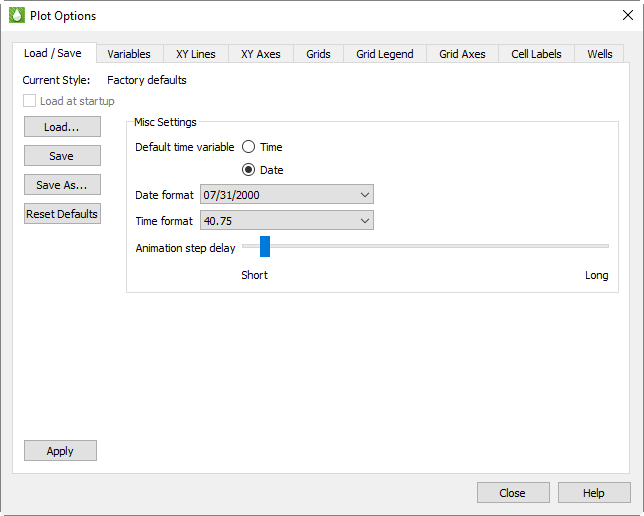
The Load/Save page of the Plot Options dialog includes methods of saving and retrieving style settings, as well as ways to format your axes.
Load/Save Settings
On the Load/Save page of the Plot Options dialog, you can load or save style settings. This useful function can help you save significant changes for future plots.
Toggle-on "Load at startup" to load the current style file whenever Tecplot RS is launched. The current style file that will be loaded at startup when that toggle is checked is listed as the Current Style heading at the top of the dialog.
When you save style settings, Tecplot RS stores all plot options settings in a Tecplot Style File (extension .rsstyx). When you save a project file, Tecplot RS embeds the style settings in the project file itself. You can load embedded style settings from a project file by clicking the Load button on the Load/Save page and then choosing the "RS Project with embedded data" file type in the Open File dialog.
Use the Save and Save As buttons to create and updated style files (.rsstyx) which can then be loaded automatically at startup (by toggling-on "Load at startup") or manually at any time (by clicking the Load… button and browsing to the file).
The Reset Defaults button will reset all Plot Options settings to the factory default states.
| If you would like to associate a style file with a set of XY and/or grid data files, we recommend creating a project file. To create a project file, choose from the menu. Refer to Projects for additional information. |
Previous versions of Tecplot RS saved style files with the .sty extension. To load style files with this extension, choose "Old format style file (*.sty)" from the Files of type menu in the Open File dialog.
Miscellaneous Settings
Use the Misc Settings region of the Load/Save page of the Plot Options dialog to customize default time display and animation settings. The time and date formatting options apply only to XY plot axes.
You have the following options:
-
Default Time Variable - Many simulators record both a Time and Date for the time variable. On XY plots, this selection controls which one (if both are available) that Tecplot RS displays by default on the X-axis. On Grid plots, this selection controls whether time or dates are displayed on the plot title and when choosing the time step.
This setting controls only the default setting. Within the appropriate dialog you can choose any variable for any axis.
| For additional control of the time increments displayed on your grid plot, use the … button below the time/date display on the sidebar. See Time Options for more information. |
-
Date Format The Date Format menu provides options of how to format your axis label when displaying dates. Tecplot RS includes the following options:
| Option | Description |
|---|---|
2000.50 |
The year displays as a four-digit integer, followed by a decimal portion of the year (DEFAULT) |
07/31/00 |
Two digits represent the month, two digits represent the day, and two digits represent the year |
07/31/2000 |
The day and month are represented by two digits; the year displays as four digits |
Jul-31-00 |
The three-letter month abbreviation displays, followed by a two-digit day and two-digit year |
Jul-31-2000 |
Three-letter month, two-digit day, four-digit year |
31/07/00 |
Two-digit day, two-digit month, two-digit year |
31/07/2000 |
Two-digit day, two-digit month, four-digit year |
31-Jul-00 |
Two-digit day, three-letter month, two-digit year |
31-Jul-2000 |
Two-digit day, three-letter month, four-digit year |
07/00 |
Two-digit month, two-digit year |
07/2000 |
Two-digit month, four-digit year |
Jul-00 |
Three-letter month, two-digit year |
Jul-2000 |
Three-letter month, four-digit year |
2000/07/31 |
Four-digit year, two-digit month, two-digit day |
2000-Jul-31 |
Four-digit year, three-letter month, two-digit day |
| Date formats other than the default are not compatible with years before 1800. Numbers in dates in such years appear as all asterisks (e.g. --** instead of Jan-31-1700). |
-
Time Format The Time Format menu controls the axis label formatting when displaying elapsed time. You can display the time on your axis in any of the following ways:
| Option | Description |
|---|---|
40.75 |
The number of days displays, followed by a decimal portion of days. |
40 18:30 |
The number of days displays, followed by the number of hours and the number of minutes |
40 18:30:00 |
The number of elapsed days displays, followed by the number of hours, the number of minutes, and the number of seconds (separated by colons) |
| To change the range of your displayed dates or times, switch to the XY Axes page of the Plot Options dialog, or double-click on the date axis to bring up the XY Axes page. |
Animation Step Delay This slider controls the length of the pause between each step of a plot that includes an animation option. If a plot animation cycles too quickly through all the available entities, variables, or time steps, use this slider to adjust the timing.
Variables
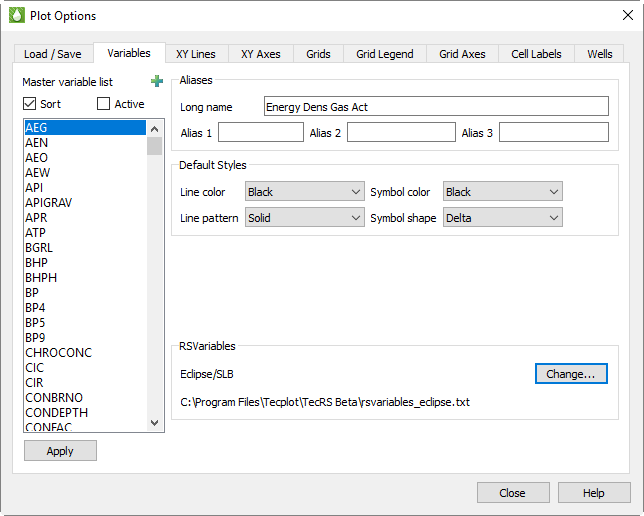
The Variables page of the Plot Options dialog allows you to define default styles and alternative names for all variables in your project. On this page, choose a variable to customize from the Master Variables List on the left side of the dialog, then make the desired changes. The changes are automatically saved
Specifically, the Variables page of the Plot Options dialog has the following options to help you customize variables.
Master Variables List
The Master Variable List includes every defined and derived variable in your loaded data sets. The list includes all variable names from each of these sources:
-
The RS Variables Files.
-
All loaded data files.
-
All derived variables calculated from the Grid Equations dialog and the XY Equations dialog.
-
Any style files loaded using the Load button on the Load/Save page of the Plot Options dialog.
The Master Variables List references each variable by its short name, generally derived from the simulator. A simulator usually generates short names as all uppercase and no more than 8 characters long, but these conventions do not reflect Tecplot RS limitations.
The Master Variable List also includes nine variables named ST1 through ST9. The long names of these variables appear as Entity 1 through Entity 9. Do not delete these variables from the RS Variables file. The XY Entities and XY Custom Entities plot types use these variables (XY Freestyle does as well, occasionally).
In these plot types, a frame contains plots of a single variable for multiple entities (other plot types show a single entity with the options for multiple variables). If the style was based on the variable being shown, a plot showing three wells would have no way of differentiating one well from another.
So for these plot types, Tecplot RS reads the style not from the variable but from the entity number. These ST1 through ST9 represent the nine different entity-specific styles, which you can customize. If you include more than 9 entities in a single frame, the cycle of styles will repeat.
Sort and Active Toggles
Two toggles appear at the top of the dialog that allow you to control how the Master Variable List appears.
When Sort is toggled-on, variables appear in the Master Variable List in alphabetical order according to their short name. When toggled-off, variables appear first as they do in the active RS Variables file, followed by the names that Tecplot RS added from the data files in the order that it opened the data files. The latter method helps if you want to use an RS Variables file to group variables in order of use.
The Active toggle becomes available when you have at least one data set loaded. When toggled-on, Tecplot RS limits the variable list to only those variables that exist in the current data sets. In general, leave this toggled-on unless you choose to specifically edit the MVL options for all variables. Derived variables that have been calculated in the Grid Equations dialog or the XY Equations dialog will automatically append to the Active list. Also, Tecplot RS will calculate saturation variables that are part of the simulation but excluded from the recurrent data file and include them in the Active list.
Aliases
In the Aliases region of the dialog, you can define a long name for any variable, as well as up to three short name aliases for that variable. For example, you could define "Oil/Water Ratio" as the long name for the "OWR" variable. In the Paper Layout plot type, you can choose where to display long variable names: in the frame title, the plot titles, and/or the axes of XY plots. See Title Options for instructions.
-
Long Name - To change a variable’s long name, choose the variable in the Master Variables List and type a new long name into the Long Name field in the Aliases region of the dialog. Tecplot RS will accept a long name of up to 80 characters in length, but we recommend no longer than 32 characters.
-
Alias 1, Alias 2, Alias 3 - You can define up to three short name aliases for each variable as well. Aliases are useful when you use the Compare toggle in XY plots to view data from multiple files, since Tecplot RS will equate a variable in either file known by one of the aliases with the associated short name in the Master Variable List.
For example, if your simulator outputs "OWR" as the Oil/Water Ratio variable, but your historical data files names the Oil/Water Ration variable "WOR", include WOR as an alias for OWR. Then Tecplot RS will recognize that the two names refer to the same variable, and will display the correct comparison of that variable between the two files.
| Aliases do have a unique limitation: Once you define them, you cannot change them with Tecplot RS running. You can add a new alias, but you cannot change an existing one. This occurs because Tecplot RS merges the lists of aliased variables when it loads new data sets. To change an alias, edit the active RS Variables file directly. See Editing RS Variables Files for details. |
Default Styles
Below the Aliases region of the Variables page, the Default Styles region allows you to choose default styles in which each variable displays. Use the Line Color, Line Pattern, Symbol Color, and Symbol Shape menus to set the styles used by default when displaying each variable. As with the Aliases region of the dialog, select the variable you wish to edit in the Master Variables List, change the default styles as you wish, and click Apply.
Since the XY Lines page of the Plot Options dialog allows you to choose even more customized variable styles, remember that the styles set on this page will affect the plot only if the selections on the XY Lines page are set to "Default".
|
It may seem that the settings on the XY Lines page function identically to the Default Style settings on the Variables page of the Plot Options dialog, since on both pages you can choose styles that change depending on the variable or entity being plotted. Here is how they differ: The settings on the XY Lines page define 20 different Style Sets (selected in the Style Set menu). Tecplot RS uses the Style Sets to plot comparisons of data from multiple files (Comp 1 is used for the first comparison data set, Comp 2 for the second, and so on). If you wanted to change the color for OPR lines from green to lime, you would have to change it 20 places on the XY Lines page. The "Default" selection on the XY Lines page does defer the style settings of that compared variable to the settings on the Variables page. |
RS Variables
This section displays the path of the active RS Variables file, which contains variable name substitutions, aliases, and the default colors and line and symbol styles used in line plots. Click Change to choose a different file (sample files are provided for each simulator supported by Tecplot RS). See RS Variables Files for further information on these files.
XY Lines
The options on the XY Lines page of the Plot Options dialog provide style controls to change line and symbol properties for the variables in your style sets. You can quickly access this page by double-clicking on any line representing data in an XY plot
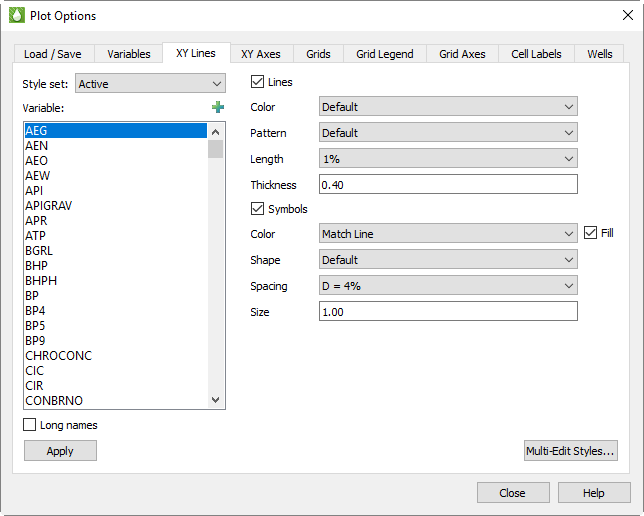
Style Set
You can design up to 100 complete sets of styles one for the active data set and one each for up to 99 comparison data sets. The Style Set menu controls which set you are altering. Initially, the settings in RS Variables Files define the "default" values for each property, with the exception that the Lines Pattern is cycled for the comparison style sets to differentiate them from the Active Style Set. Each Style Set is applied to the data set(s) included in a comparison plot according to the order specified on the Order page of the Compare Data Sets dialog. (For example, Comp 1 is applied to the first file listed on the Order page.) Refer to Comparing XY Data for more information on specifying comparison values.
You can specify the style for each variable in each Style Set. Typically, you would only edit the styles applicable to the plots you are creating. Often the default settings display sufficiently. To quickly edit a line style, double-click on the specific line in the XY plot of interest. This will bring up the XY Lines page with the appropriate Style Set and Variable pre-selected in the dialog. After you make several changes to line styles you should save a style file using the Load/Save page of the dialog. If you create or use an existing Project file, Tecplot RS will automatically save all of the style changes to the Project file.
To edit multiple combinations of variables and style sets, click the Multi-Edit Styles button (see Multi-Edit XY Line Styles).
Variables
The Variable box includes all the names included in
Master Variables List, including
settings for entities. Use it to choose the variable for which you want to
change the comparison style settings. The variable is automatically selected
if you accessed this dialog by double-clicking on a line in an XY plot.
Click the  button in the
upper-right corner of the list to launch an expanded, searchable list. This
helps particularly for very long lists.
button in the
upper-right corner of the list to launch an expanded, searchable list. This
helps particularly for very long lists.
You can also use the Variables page of the Plot Options dialog and manage this list of variables by sorting it alphabetically and limiting it to just the variables that appear in your data files.
Toggle-on "Long Names" to display the full name of the variable (as defined in the Master Variables List). When "Long Names" is toggled-off, Tecplot RS uses an abbreviation.
Tecplot RS uses the variables named "Entity1" through "Entity9" or "ST1" through "ST9" to customize the style settings for entities used in XY Entities plots. "Entity 1" / ST1 correspond to the first entity in the plot, and so forth.
Style Selections
The style selection options are initially set to default settings defined in the RS Variables file for a given variable or set of variables. To edit the settings, use the Variables page of the Plot Options dialog to change them interactively, or create a personal RS Variables file and edit it. Refer to Master Variables List and Editing RS Variables Files for instructions.
The options are grouped for lines and symbols, as follows:
-
Lines or Symbols - Controls whether lines and/or symbols display. If you toggle-off both switches, Tecplot RS will display nothing in the plot for the corresponding variable and Style Set. These settings also depend on the master toggles for Lines and Symbols provided at the top of the sidebar for XY plot types.
| When you work with a variable that is repeated in multiple Style Sets and you wish to display it only once, toggle-off both "Lines" and "Symbols" for that variable in the other Style Sets. That variable will not be included in the plot of legend for the associated data set. This is useful when comparing multiple Eclipse history match runs in which the output file for each run includes the historical data. |
-
Color - Choose from 26 standard colors or Default, which uses the color defined in the Master Variables List. For symbols, you can also choose the "Match Line" option. This option sets the symbol color to match the color of the line. The symbol color will update whenever the line color is changed.
-
Pattern - Six line patterns are offered, plus the Default option that reads the pattern from the Master Variables List.
-
Pattern Length - You can alter the repeat length of the pattern. Values are expressed as a percentage of frame size.
-
Thickness - You can select the thickness of the line. Again, Tecplot RS measures these values relative to the frame size.
-
Symbol Shape - Seven shapes are offered, plus options for Default and Character. When Default is selected, the shape is taken from the Master Variables List.
When Character is selected, a small text field will display. Use this to input the alpha or numeric character to be used as a line symbol. For example, you may want to use "W" for water variables, "G" for gas, and so on.
-
Symbol Spacing - The "All" option will plot a symbol at each data point. Use the "D" options to space symbols at approximately even intervals along the line, with the spacing value expressed as a percentage of frame size. The "I" spacing options are skip values. For example, I = 6 will place symbols at every sixth data point.
-
Symbol Size - Tecplot RS expresses sizes as a percentage of frame size.
Multi-Edit XY Line Styles
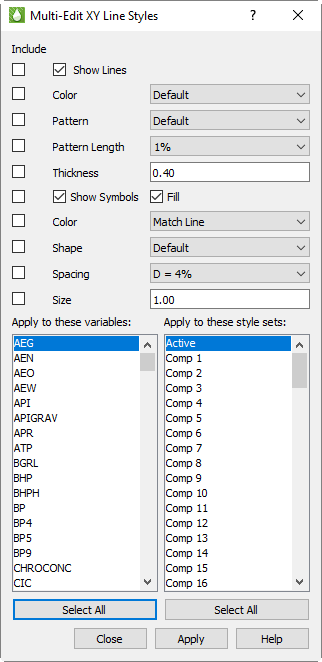
The XY Lines page of the Plot Options dialog allows you to define styles for each unique variable/style set combination, one at a time. To make multiple assignments at once, click the Multi-Edit Styles button in the lower right corner of the XY Lines page. The Multi-Edit XY Line Styles dialog appears.
When the Multi-Edit XY Line Styles dialog opens, the selections match the settings in the Plot Options dialog, but this is just a starting point. The basic style settings are identical to those in the Plot Options dialog: line color, pattern, etc. Two things are different.
-
First, you’re making style assignments to multiple variable/style set combinations. You choose the variables and style sets using the two multi-select lists in the lower half of the dialog. Most of the time, you will choose one variable and multiple style sets or one style set and multiple variables, although you can also choose one or multiple of both.
-
Second, the Include toggles control which styles you are setting. You may choose to set only one style or several in a single operation.
For example, suppose you wanted to always show any Oil values in green, but alter the line style to differentiate rates from cumulative values, and use a different symbol to differentiate files in comparison plots. You can do this as follows:
1.Set the line color:
-
Check only the Include toggle next to Color, and set the color to green.
-
Highlight the desired Oil values in the variables list that will be plotted in green.
-
Highlight all the style sets using the Select All button.
-
Click Apply.
You’ve just made hundreds of changes one per style set time the number of oil variables selected.
-
Differentiate OPR (rate) from OPC (cumulative):
-
Turn off the Include toggle next to Color, and turn on the toggle for Pattern (and Pattern Length, if desired).
-
Select the Oil Production Rate variable.
-
Choose the styles you want for Oil Production Rate for example, a solid line.
-
Select all the style sets using Select All, then click Apply
-
Change the variable to the Oil Production Cumulative, change the line pattern to something different (e.g. short dash), and click Apply.
-
Repeat the last step for other oil values, using different line patterns for each.
-
Differentiate comparison plots
You may find it nice to use the line symbols for differentiating comparison plots. A character symbol is a good way to do this, and this can be done for all variables. For example:
-
Set the toggles to copy only the symbol options. You definitely want shape, but you may also want to set the size and spacing. Color is optional depending on what you want to do.
-
Choose a symbol shape of Character, and set the character to the number "1".
-
Choose ALL variables.
-
Choose ONLY the Comp 1 style set, then hit Apply.
-
Repeat by changing the character to "2" and the style set to Comp 2.
You may choose instead to use symbols instead of line patterns to tell OPR from OPC, and use patterns to differentiate comparison plots. The choices are yours, but the Multi-Edit XY Line Styles dialog makes it easy to make mass edits.
| There is no Undo feature in Multi-Edit XY Line Styles. It’s a good idea to save a separate style file (using the Load/Save page of the dialog) before beginning your changes, and perhaps additional style files at various steps in your editing. If you make a mistake, you can get back to where you were by re-loading one of these files. Alternatively, simply save your project file before beginning, then, if something goes wrong, exit Tecplot RS without saving your project. You’ll be right back where you were before you started when you re-open the project. |
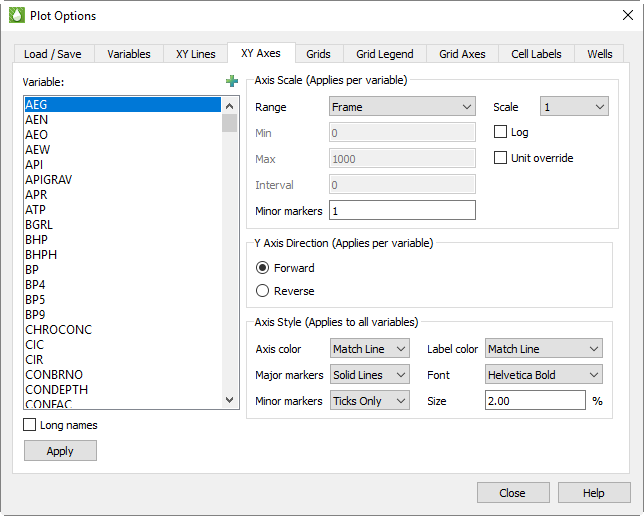
XY Axes
The settings on the XY Axes page of the Plot Options dialog control the axis ranges for each variable as well as the style of the axes on all XY plots. To quickly access this page, double-click on an axis or axis label (title) in any XY plot.
Variables
Use the Variables list on the left of the dialog to choose a variable to
customize. If you access this page by double-clicking an axis or label
in your XY plot, the dialog will open with the variable assigned to that
axis highlighted in the list. Click the
button in the upper-right
corner of the list to launch an expanded, searchable variables list. This
button helps particularly for very long lists.
The Long Names toggle controls whether the Variables box displays the long variable names. Toggle-on "Long Names" to display the long variable names. Otherwise, the short (acronym) names display.
The list of variables that displays here comes from Master Variables List.
You can also switch to the Variables page of the Plot Options dialog and manage this list of variables by sorting it alphabetically and limiting it to just the variables that appear in your data files. You can use the Variables page to add variables to your RS Variables file.
Axis Scale
The Axis Scale region of the dialog controls the scale (range and display) of axes on XY plots. You can choose to instruct Tecplot RS to display a range that fits the data, or to customize the ranges manually.
The selections in the Axis Scale region of the dialog apply only to the variable selected in the Variable list. After clicking the variable in the Variable list that you wish to customize, choose from the following options in the Axis Scale region of the dialog.
-
Range - The menu controls how the minimum and maximum axis values are determined. Choose from three options:
-
Frame - With this option selected, Tecplot RS will compute the limits to encompass the range of variable values plotted in a single frame. This option gives you the best "zoomed in" view of the data.
-
Data - If "Data" is selected, Tecplot RS will compute the limits to encompass the range for each variable in all entities of the same type. This gives a common scale for all frames, to show how one well compares to another.
-
Manual - Choose this option to manually type the minimum and maximum values for Tecplot RS to use for axes.
-
| For the majority of applications, setting the range to either Frame or Data will produce good results. |
-
Min and Max - These text fields become active when you select "Manual" for the range. Type the minimum and maximum values of the range in these boxes. If you wish to adjust the range of your Time or Date variable, type the Min and/or Max in the decimal year format (for the Date variable; for example, 2000.50) or the decimal days format (for the Time variable; for example, 40.75).
-
Interval - Choose the interval of units display between major markers (labels). A value of zero (0) instructs Tecplot RS to calculate the interval.
-
# of Minor Markers - Choose the number of minor markers or grid lines to display between major markers. Use 0 to skip drawing minor markers.
-
Scale - The Scale menu rescales axes labels. When you deal with very large values, you can direct Tecplot RS to reduce them to multiples of a thousand, million, and so forth by choosing a factor from this menu. Choose "Enter" to type a custom scaling factor in the text field beneath the menu.
When you use a factor other than 1, the axis label will include the scaling information. For example, when the Oil Prod Rate variable Scale is set to 1000, the label reads "Oil Prod Rate (1000 STB/Day)".
-
Log - Toggle-on "Log" to use a logarithmic scale. In this case, it is usually best to select Manual range with "nice" values for the limits (such as 1, 10, 100, and so forth).
-
Unit Override - Toggle-on "Unit Override" to specify your own unit label. The standard unit label is a combination of the scale factor and the unit label from the data file. After toggling-on "Unit Override", type the unit label that you wish to display in the text field that appears underneath the Unit Override toggle. For example, you might type "MSTB/Day" to replace "1000 STB/Day".
| When zooming a plot in or out, the grid interval and tick mark spacing will temporarily reset to automatic settings calculated based on the chosen magnification. Click the Reset plot view button (or change the plot type) to return to the standard plot, which uses the settings defined here. |
Axis Direction
Choose the Y axis direction for this variable in XY plot types.
| DEPTH is automatically reversed on the Y axis for XY Entities plot types. Selecting "Reverse" for DEPTH therefore reverses the reverse direction, so that it is forward. |
Axis Style
The selections in the Axes Style region of the XY Axes page control how axes are drawn and labeled:
-
Label or Axis Color - Choose the color of the displayed label or axis:
-
Standard Colors - Choose from 26 standard colors.
-
Match Line - Choose Match Line to match the color the text, axes, and/or grid and markers according to color of Axis Line Variable. When comparing data sets, Tecplot RS matches the color of the variable in the active data set. When multiple variables are plotted on a single axis, Tecplot RS uses the color of the first variable.
-
-
Font - Choose from a list of the available fonts.
-
Size - Choose the font size expressed as a percentage of frame height.
-
Major Markers - Choose Ticks, Solid Lines, Dotted Lines, or Precise Dots.
-
Minor Markers - Choose from the same options as for Major Markers (above).
Tecplot RS will apply the selections on this page as follows:
-
Axes are always drawn with major markers and a border.
-
Tecplot RS will use the same font for axes labels and the axes titles.
-
If you specify an axis size in the dialog, the axes labels will also use this size. The titles will be 1.2 times as large as the specified axis size.
-
The choices you make for major and minor markers will apply to both axes.
-
Label size and color selections are used on all axes.
-
Tecplot RS controls the plotting area within the frame, making adjustments according to how many axes are displayed and the selected font sizes. For multi-frame plots, Tecplot RS rescales the font size based on the aspect ratio of the frames.
Tecplot RS will choose a labeling interval automatically.
Grids
The Grids page in the Plot Options dialog includes selections for formatting the grid styles of active cells, inactive cells, and see-through cells. To access this page, double-click on the reservoir grid in any grid plot, or choose from the menu and switch to the Grids page.
Active Cell Grid Styles
When you have "Active Cells" selected on the left side of the Grids page, the settings that display on the Grids page control the Mesh and Contours of the active plot, for 2D Grid Plots or 3D Grid Plots.
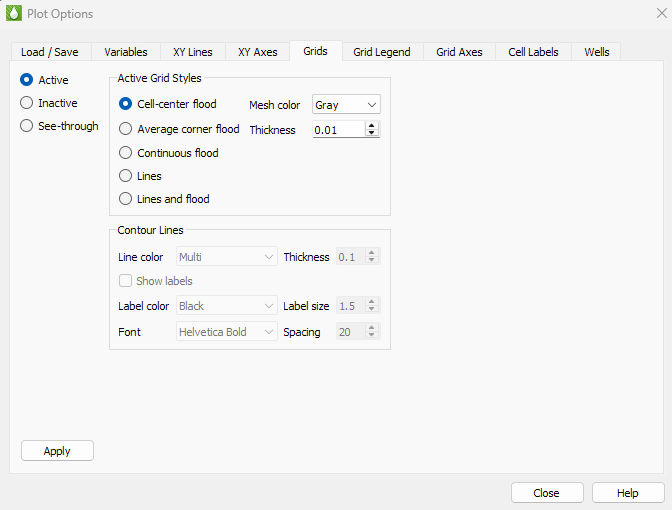
Active Grid Styles
In the Active Grid Styles region of the Grid page, you can modify the color and mesh styles of the grid. The first set of options allow you to customize how Tecplot RS presents the selected grid variable on the cell faces. Choose one of the flood options to flood the cell faces with color to represent the variable value (such as oil saturation or porosity). If you choose to display contour lines, the Contour Lines region of the dialog will become active.
Your options include:
-
Cell Center Flood - Tecplot RS fills the entire cell face according to the cell-center value of the selected variable.
-
Average Corner Flood - Tecplot RS averages all four corners of a cell face and fills the area with a solid color. This is not useful for cell-centered data.
-
Continuous Flood - Colors vary across the face according to the set contour levels. The color is constant between two contour levels.
-
Lines - With this option selected, contour level values display as lines. Solid lines depict positive values and dashed lines depict negative values.
-
Lines and flood - Combines the above two options.
-
| The grid style for an XYZ Slice or Iso-surface will always display as flooded, regardless of the setting in this dialog. |
To change the grid mesh color, choose a color for the grid mesh (wire frame) from the Mesh Color menu. The "Multi" selection colors each grid line segment according to the local values of the selected grid variable.
You can choose or type a thickness of the line used to draw the mesh in the Thickness box. This control expresses thickness as a percentage of frame size, with acceptable values ranging from 0.1 to 1.0.
Contour Lines
The Contour Lines region of the dialog controls the style settings for contour lines in the active plot, when "Lines" is selected in the Active Grid Styles region of the page. This includes the following options:
-
Line Color - The Line Color menu controls the color of the contour lines. By default, Tecplot RS chooses the "Multi" value, which colors the contour lines according to the value of the contour variable. You can also choose single color options that set the contour lines to one color.
-
Thickness - The Thickness box controls the width of the contour lines.
-
Labels - Toggle-on "Show Labels" to include contour line labels in your plot. Use the Label Color, Label Size, and Font menus to customize the style of your contour labels. Use the Spacing menu to alter the spacing between the contour labels along a given contour line. Tecplot RS measures spacing as a percentage of the frame height.
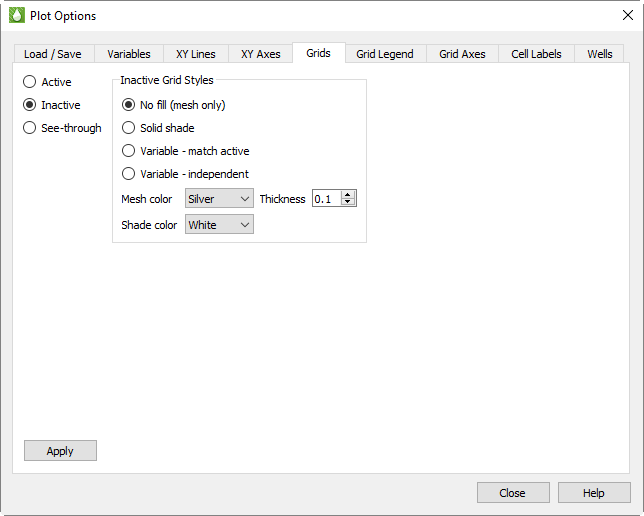
Inactive Cell Styles
To adjust the style of the inactive cells' display, select "Inactive" on the left side of the Grids page. With the controls that appear, you can customize the display style of the inactive cells in your grid. These controls are also included in the Inactive Cells dialog; changes made in one dialog will be reflected in the other.
In the first set of options, you can choose whether to display the inactive cells as a simple mesh or shade, or whether to display a variable value:
-
No fill (mesh only) - Choose this option to display the inactive cells as a mesh.
-
Solid Shade - Choose this option to fill the inactive cells with a color.
-
Variable - match active - Choose this option to color the inactive cells according to the solution data of the variable used by the active cells. If the inactive cells do not contain a value for that variable, they will display with a value of zero.
-
Variable - independent - Choose this option to color the inactive cells according to solution data of a variable of your choice. If the inactive cells do not contain a value for that variable, they will display with a value of zero.
To learn how to select an independent variable for the inactive cells to display, refer to Inactive Cells.
The remaining options in the Inactive Grid Styles region of the Grids page control the mesh color, mesh thickness, and/or shading color displayed by the inactive cells:
-
Mesh Color - Choose a color from the Mesh Color menu to display a mesh of that color.
-
Thickness - Choose or type a thickness value between 0.1 and 2.0 in the Thickness field to specify the width of the mesh lines as a percentage of frame size.
-
Shade Color - Choose a color for inactive cell shading from the Shade Color menu.
Click the Apply button to view the results in your plot.
See-through Grid Styles
Tecplot RS uses see-through styles in 3D views any time you select options in which viewing the interior of the grid is advantageous, for example, when toggling-on "Ghost" while displaying Inside Views.
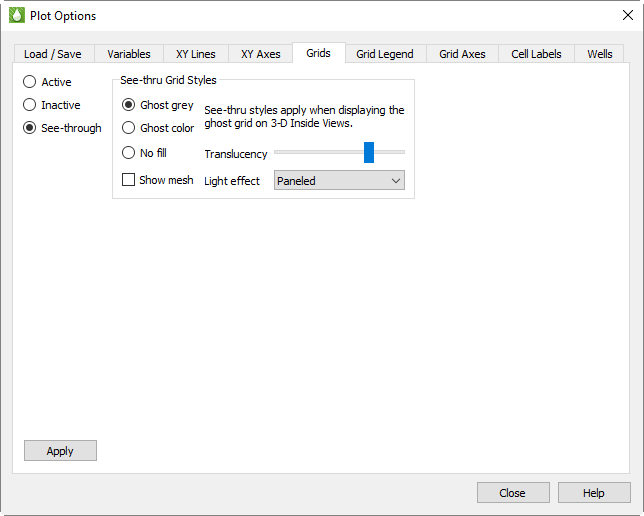
Ghost Gray is the recommended option; this will produce a translucent gray surface that shows the surface of the reservoir while also leaving the interior details visible. Use the Translucency slider to increase or decrease the visibility of the ghosted image.
The "Ghost Color" option displays a translucent reservoir surface colored by the selected grid variable.
Generally, turn off the mesh when you have either of the ghost options selected for the best view, and turn on the mesh only when No Fill is selected.
The Show Mesh option is related to, but different from, the Mesh toggle in the sidebar. The sidebar toggle turns off all mesh displays, including the mesh for the see-through grid, if it is visible. The Show Mesh option in this dialog determines whether the see-through grid’s mesh is shown when the Mesh sidebar toggle is on.
The Light Effect menu controls how light source shading is performed. This is done whenever "Light" is toggled-on in the sidebar. Choose Paneled for fastest performance, or Smooth for a more realistic (but slower) effect.
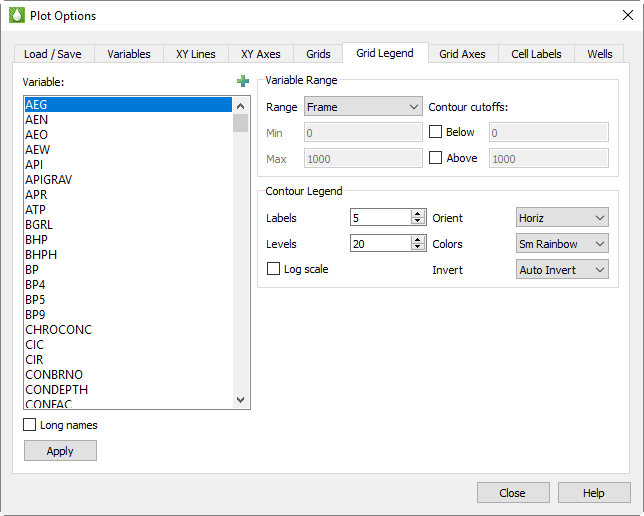
Grid Legend
The Grid Legend page of the Plot Options dialog includes selections for formatting the range and style of the grid variable legend that displays for 2D Grid Plots and 3D Grid Plots. Access this dialog quickly from any grid plot by double-clicking on the legend.
Variables
The selections you make on this page apply on a variable-by-variable basis. In the Variables region of the page, select the variable you wish to customize in the other regions of the page.
-
Variable - The Master Variables List displays in the Variables box. When you double-click on the legend, the corresponding variable automatically displays as selected when the page displays. Click the
button to
launch an expanded, searchable variables list. This helps for very long
lists.The variables in the box come initially from RS Variables Files. Tecplot RS appends derived variables and variables that occur in loaded data files to this list. To change a setting for a variable in this master variable list, refer to Variables or Editing RS Variables Files for instructions.
-
Long Names - Toggle-on "Long Names" to display long variable names in the box. Otherwise, the short (acronym) names display.
Variable Range
In the Variables Range region of the page, you can customize the range for which each variable displays in your plot. This region includes the following options:
-
Standard Deviation Range - Select this option to set the minimum and maximum limits to 1 or 2 standard deviations from the mean value. For example, if “1 standard deviation” is selected, then the variable range minimum will be mean - standard deviation and the maximum will be mean + standard deviation. Note that standard deviation and mean are calculated such that they are identical to the standard deviation and mean values displayed in the histogram plot.
-
Other Ranges - This menu contains three options for determining the minimum and maximum limits for the ranges of the variables:
-
Frame - The limits will be computed to encompass the range of the variable values across all time steps. This gives an individual scale for each frame, making it easier to see how a variable functions in each frame.
-
Data - The limits will be computed to encompass the range of the variable values across all time steps. This gives a common scale for all frames, making it easier to see how one well compares to another.
-
Manual - Use this option to control the minimum and maximum values for the legend ranges manually, by typing the values in the fields.
-
In the case of grid legends, the Frame or Data selections operate identically. The legend will encompass the full range of variable values for all time steps.
-
Min and Max - These text fields activate when the Manual range is selected. Type the minimum and maximum values of the ranges in these fields when using the Manual variable range.
| For the majority of applications, setting the range to either Frame or Data will produce reasonable results. |
-
Cutoff Below/Above - Toggle-on "Below" or "Above" to remove contour variable values below or above a given cutoff, respectively. Type the cut-off value in the corresponding text field. The cells within the cut-offs will display without color.
Contour Legend
Use the Contour Legend region of the dialog to customize the style of your contour legend for each variable. You have the following options:
-
Labels - Use the Labels box to specify the number of contour labels to display in your legend. Changing the number of labels in the contour legend will also change the number of labels on the contour lines themselves, and vice versa.
-
Levels - Use the Levels box to specify the number of contour levels to display in your plot. The Levels and Labels values are used to calculate legend intervals that will display "nice" numbers for the legend labels.
-
Log - Toggle-on "Log" to use a log scale for the levels used in the legend. Use Labels and Levels settings that produce a "nice" look for the legend.
-
Orient - Specify whether to have a vertical or horizontal contour legend.
-
Colors - Use this menu to specify the color map to use for your contour plot. Using colors from this menu instructs Tecplot RS to color different ranges of variable values different colors. For example, with the small rainbow color map ("Sm Rainbow"), Tecplot RS will shade the smallest values blue, then green, then yellow, and the highest values red.
-
Invert - Use the Invert menu to invert the color map. Choose from one of the following color map settings:
-
Auto Invert - Select "Auto Invert" to invert the colormap only when water saturation is set to the contour variable. When using the small rainbow color map, this associates blue with the high end of the range. The colormap will be in its standard configuration for all other contour variables.
-
Never Invert - Select Never Invert to leave the colormap in its standard configuration for all contour variables.
-
Always Invert - Select Always Invert to invert the colormap for every contour variable.
-
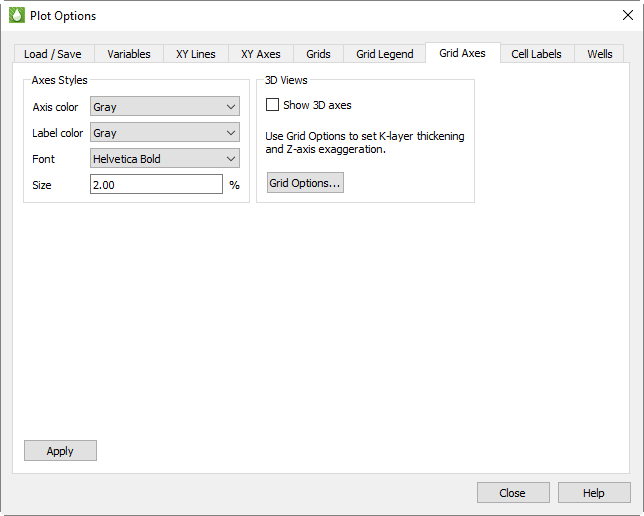
Grid Plot Axes
The Grid Axes page includes selections for formatting the grid axes and 3D Views. You can quickly access this page of the Plot Options dialog by double-clicking on one of the axes in a 2D or 3D Grid plot. Or choose from the menu.
This page allows you to customize axis labels and display (3D Grid only).
Axes Styles
In the Axes Styles region of the Grid Axes page, you can customize the way axis labels appear on your plot with the following options:
-
Axis Color - Choose from 26 standard colors in this menu to assign the color of the selected axis.
-
Label Color - Choose from 26 standard colors to assign the color of the selected axis label.
-
Font - Choose from a list of available fonts to assign the font in which the axis label will display.
-
Size - Choose the size of the axis label’s font as a percentage of frame height.
3D Views
In the 3D Views region of the Grid Axes page, you can choose whether to include the axes display on 3D views (2D views always include the axes). Toggle-on "Show 3D Axes" to display the axes in a 3D Grid plot.
To customize additional characteristics of 3D Grid plots, use the Grid Options dialog, which you can access by clicking the Grid Options button or by clicking Grid in the 2D or 3D sidebar.
Cell Labels
When you have "Labels" toggled-on in the sidebar (available for Grid Plots only), you can use the Cell Labels page of the Plot Options dialog to customize the label formatting.
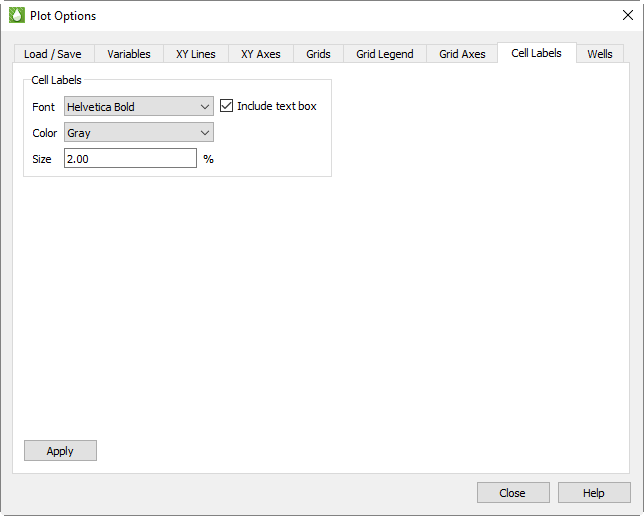
Toggle-on "Include text box" to put cell labels in a text box. This can make the labels easier to see.
Use the and menus to customize the display of cell labels.
Use the Size box to set the size of the cell labels, expressed as a percentage of the frame. You can select a value between 0.1 and 8 for the size of the labels.
Wells
You can display wells on both 2D Grid Plots and 3D Grid Plots. Use the Wells page to control well symbols colors, sizes, and labeling options. To access the Wells page of the Plot Options dialog quickly, double-click on a well head symbol. Holding down the Ctrl key and double-clicking your pointer will interactively select an individual well.
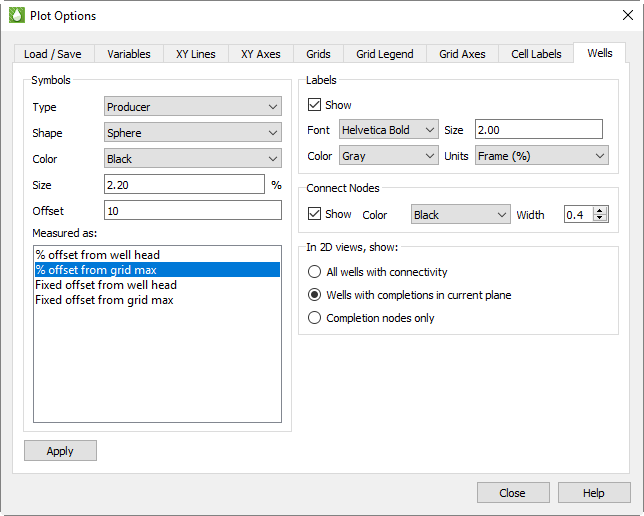
Well Symbols
In the Symbols region of the page, you can customize how well symbols appear, as well as where well symbols display relative to their well. Four selections control how well symbols appear on the grid plots.
There are actually seven sets of well symbol settings, one for each of the Types in the first option menu.
The well types are read from the simulator files. Tecplot RS recognizes five basic types, including:
-
Producer
-
Gas Injector
-
Water Injector
-
Injector ("generic", or anything other than gas or water)
-
Shut-In
You can select a different symbol/color/size for each type. These will be placed on the well head. Symbols are also placed on the well nodes (completions), and these are categorized as either Open or Closed.
For each of the listed types, you can choose the color, shape, and size. Sizes are expressed as a percentage of the frame size.
The selections for the symbol shape include:
Square |
Circle |
Diamond |
Delta |
Gradient |
Left Triangle |
Right Triangle |
Cube |
Sphere |
Octahedron |
The last three shapes (cube, sphere, and octahedron) are 3D symbols. In 2D Grid plots, they will be shown as squares, circles, and diamonds, respectively.
Well Symbol Offset
The simulator output files describe the well geometry by designating the cells containing the well completions. The well head (or first node) is located within the grid, usually (but not always) in the first K plane. When Tecplot RS plots wells, it places the well head symbol in a position above the surface of the grid model so it is easily visible in both 2D and 3D views.
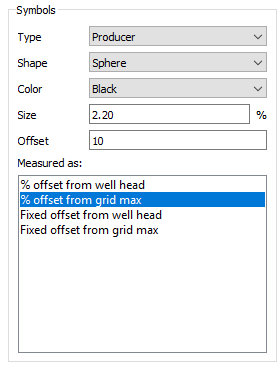
You have control over how this position is determined with a pair of controls in the Symbols region of the Wells page. The Well symb offset box contains four options. Use these options to select the point from which to measure the offset (from the first completion or from the highest elevation in the grid model), and the units for the offset (an actual distance or a percentage of the grid height). You can then use the Well symb offset text field to specify the actual percentage or distance.
When the offset is measured from the well head, the symbols generally follow the surface of the grid model. However, sometimes the well head or first completion falls in a cell significantly beneath the grid surface, causing the symbol to be hidden within the grid within 3D Views. In this case, you can designate that the starting point for the offset be the maximum elevation in the grid model. This guarantees that the symbols will all display visibly, but it also means that they will be at a constant height, possibly increasing the likelihood of interference.
Labels
The Labels region of the Wells page controls how to display well labels. A "Show" toggle controls whether to include labels for the well names.
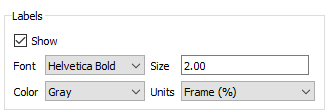
You can choose the font and color of the labels from the and menus in the Labels region of the Wells page.
To change the label size, type a value in the Size text field. The Units menu controls whether the size is expressed as a percentage of the frame size (the labels remain the same size when you zoom in) or a percentage of the grid area (when you zoom in, the labels get larger along with the image).
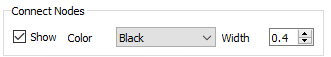
Connect Nodes
Use the Connect Nodes region of the Wells page to specify the style of the line that is drawn between well nodes to represent the well path. The Connect toggle in the upper portion of the sidebar controls the display of these lines.
2D View Settings
Use the 2D View settings region of the Wells page to specify how to treat wells in 2D Grid plots.

Choose from one of the following options:
-
All wells with connectivity Select this option to draw all wells and display the connectivity between completions and well heads.
-
Wells with completions in current plane Select this option to draw only wells with completions in the current plane.
-
Completion nodes only Select this option to display only the completion nodes in the current plane. The well path will not display.
Where Are Styles Set?
You have a multitude of options for customizing your plot to appear exactly as you like, with many different places to set the styles. You can control most of them from the Plot Options dialog, but others dialogs and menus may supersede the Plot Options dialog for different situations. Access most style options quickly by double-clicking on the object that you wish to change.
You can use the following table to determine where to set most styles. To jump to one of the subjects displayed following, select the Controlled By phrase, or type one of the Controlled By phrases into your search box.
| Item | Controlled By |
|---|---|
Legend placement, legend labels |
Paper Layout template |
Legend range and style |
Plot Options dialog (Grid Legend page) |
Line styles (color, pattern, symbols) |
Plot Options dialog (XY Lines page); RS Variables Files |
Frame size and placement |
Multi-Frame Options dialog |
Frame style (border, color) |
Paper Layout templates |
Text (other than axes labels) |
Paper Layout template |
XY Axes ranges |
Plot Options dialog (XY Axes page) |
Axes labels and grids / marks |
Plot Options dialog (XY Axes page) |