Specialty Plots
In addition to the XY plot types described in Basic XY Plots and Custom XY Plots, Tecplot RS provides the following specialty plot types:
| You must load applicable data to use any of these plot types. For example, you must load or append RFT data to use the RFT plot type. |
You can also create RFT plots and Completion profiles using the basic XY plot types. However, flow tables are a unique plot type that you cannot duplicate in any of the other XY plot types.
RFT Plots
RFT data files provide observed or simulated values at one or more depth(s) along a well at a given time. While Tecplot RS allows you to plot RFT data using any of the three basic XY plotting functions (XY Variables, XY Entities, and XY Custom), Tecplot RS includes a specialized module for RFT data that simplifies some of the selections.
RFT data files (extension .rft or .frft) function as a specialty plot type of "XY Data". You can append one RFT file to a field, well, or completion data set. (That is, you can append one Eclipse RFT file to a UNSMRY data set.)
Loading RFT Data
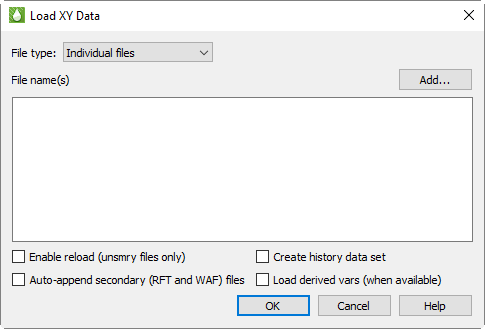
To begin creating an RFT plot, load an RFT data file. You can load (append) Eclipse RFT data files automatically with their associated UNSMRY file using the "Append RFT" data toggle in the Load XY Data dialog, or manually by choosing "Eclipse/VIP RFT" as the File Type in the Open Files dialog (accessed with the Load XY Data dialog). To use the "Append RFT" toggle when loading both files simultaneously, the RFT or FRFT file must have a root file name identical to the UNSMRY root file name.
Appending RFT Data
If you have not yet loaded the UNSMRY file associated with the RFT file, and your UNSMRY data file and RFT data file have identical root file names (for example, chelan.unsmry and chelan.frft), use the following procedure to load both files simultaneously:
-
Choose from the menu.
-
Toggle-on "Append RFT" in the Load XY Data dialog that appears.
-
Click the Add button.
-
Set the file type to "Eclipse UNSMRY" and choose the UNSMRY file to load.
-
Click Open in the Open Files dialog, and click OK in the Load XY Data dialog.
Tecplot RS will now load both data sets. You can toggle between viewing each data set by choosing the appropriate plot type in the sidebar (for example, choose "RFT" to view the Eclipse RFT data set).
If you have already loaded the UNSMRY file, load the Eclipse RFT file manually, as described in the following section. Remember to toggle-on "Append RFT data" in the Load XY Data dialog. With this toggled-on, Tecplot RS will append the RFT file to the active data set.
| You can try appending an Eclipse RFT data file with the chelan.unsmry and chelan.frft files included in your installation. Your Tecplot RS installation includes these files in the C:\Program Files\Tecplot\TecRS 2025 R1\examples\ folder, where C:\Program Files\Tecplot\TecRS 2025 R1 represents the location of your Tecplot RS installation. |
|
Note that if you click Yes to append the RFT to the current dataset, no further RFT files can be appended and any further RFT datasets will be automatically loaded as separate datasets. If you click No and have specified more than one RFT file, the dialog will ask if you want to append the next RFT file in the list. Clicking No to All will not append an RFT files, and will load all RFT files specified as separate datasets without displaying any further dialogs. |
Manually Loading RFT Data
To load an Eclipse/VIP RFT file manually (if you already have the UNSMRY file loaded, or you do not have data files with identical root file names), first load the UNSMRY file by itself if you have not already done so. Then choose from the menu to launch the Load XY Data dialog. Click the Add button to launch the Open Files dialog.
In the Open Files dialog, choose "Eclipse/Chears Files or VIP Files" from the Files of type menu
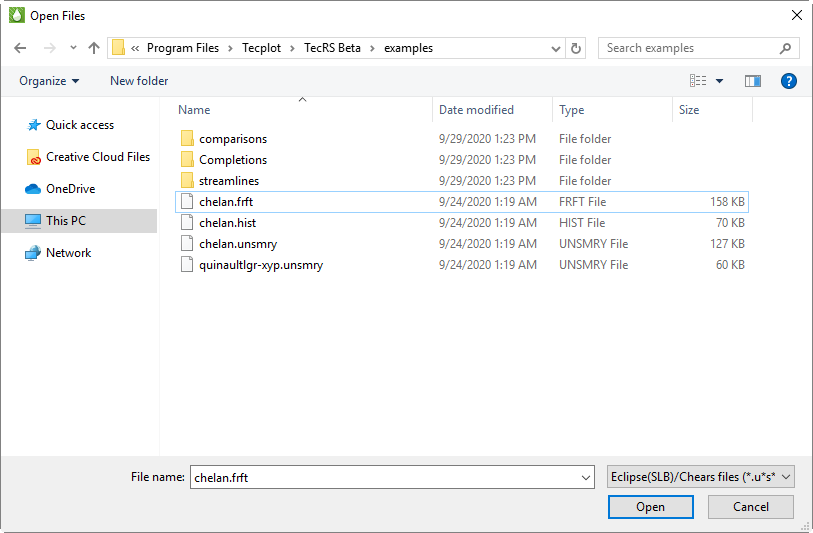
Once you have navigated to the file(s) you would like to load and selected them, click Open.
In the Load XY Data dialog, if the RFT data file represents the same reservoir as your current file, you can append the RFT data to the active data set. To do this, toggle-on "Append RFT data" in the Load XY Data dialog. Tecplot RS will group the data into its own entity type, in the same manner as wells, regions, quality data, and so forth. The Filter options also include the RFT type.
With the RFT data file appended to the active data set, you can access and switch between the plot types easier. However, you can also load the RFT data file as a separate data set, either replacing the current data set or adding as an additional file. To do this, toggle-off "Append RFT data" in the Load XY Data dialog, and choose the action you wish to take in the subsequent Question dialog that will appear after you click the OK button.
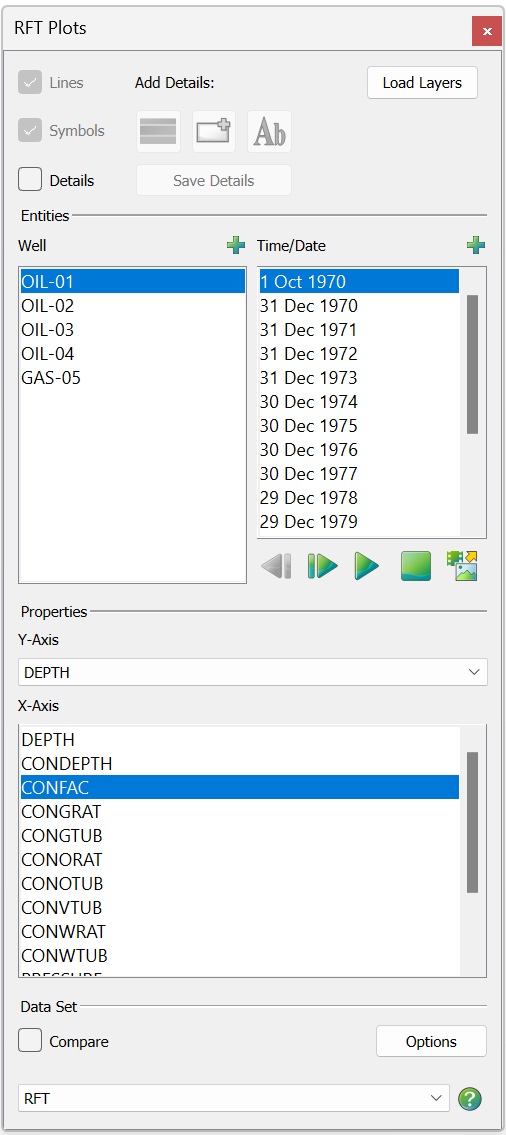
RFT Plot Sidebar
Choose "RFT" from the Plot Type menu to switch to the RFT sidebar. By default, the independent variable (Depth) displays on the Y-axis in RFT plots, and the Y-axis is inverted so that values increase downward.
You can un-dock the Plot Controls sidebar by dragging its title bar to a new position. To put the Plot Controls back on the side of the workspace, double-click on its title bar (the region that displays the plot type). You can also drag its title bar to either side of the workspace, let go, and it will snap into place.
The RFT plot sidebar has the following controls:
-
RFT Plot Text and Layer Details Use the Add Details buttons to record and adjust text and rectangular geometries to represent geological layers on any RFT well. See RFT Plot Text and Layer Details for instructions on adding and customizing these details.
-
Entities In the Entities region of the sidebar, you can choose one or more entity to include in your plot, as well as one or more time/date to include in your plot. Click the
 button
(located in the upper-right corner) to launch an expanded, searchable
entity list from either the Entities box or the Time/Date box.
button
(located in the upper-right corner) to launch an expanded, searchable
entity list from either the Entities box or the Time/Date box. -
Variables Use the variables region of the sidebar to specify the X-axes and Y-axes variables.
| The entity and variable lists are automatically limited to those associated with the RFT data type. |
-
Data Set You can compare RFT data from two or more files. Comparing XY Data describes the basic operation. (The Delta page of the Compare Data Sets dialog has no effect when comparing RFT data.)
When searching for a match between the active data set and the comparison data set(s), Tecplot RS considers both the well name and the time/date identifier. The well names must match exactly, but the dates or times are not expected to be identical. Tecplot RS uses the time closest to the one chosen for the active data set. The legend displays the time, so that you can see which measurements Tecplot RS has chosen.
| In general, setting the time units to Date for RFT plots results in a more intuitive plot. The Date setting removes ambiguity caused by time (days) values. You can change this setting on the Load/Save page of the Plot Options dialog |
RFT Plot Text and Layer Details
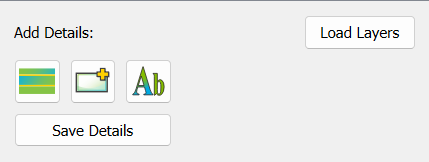
You can add text and rectangular layers as background to any well in an RFT plot. Toggling-on "Details" at the top of the sidebar will make the RFT Details buttons active. With these buttons you can attach text at certain depths or frame positions, color a depth range (for example, to represent geologic layers), and save your textual and/or layer additions into the RFT project file.
Text and layer details are associated with the well that is active when you add the details.
| The "Details" toggle in the sidebar next to the RFT Details buttons controls whether or not RFT details display on the plot. "Details" must be toggled-on to create or save RFT details. |
When you click the Save Details button in this Details region of the RFT sidebar, Tecplot RS saves the added details to the current project file. Using this method, when you reopen the project, the details will appear on your plot and you do not have to recreate them.
To load RFT layers from a comma separated values (CSV) file, click the Load Layers button on the sidebar. You will be prompted for a file name, and layers will be loaded from the file and applied to the currently selected well. Any existing layers in the currently selected well will be unchanged.
The format of the CSV file is as follows for each line:
Layer Number, Top, Bottom, [Color], [Label], [Label Position]
The columns of CSV file are as follows (blank lines and lines starting with '#' are ignored):
- Layer Number
-
Layer number to add. If the layer number is greater than the existing number of layers, a new layer is added. Otherwise, the layer is replaced. Layer numbers start at 1.
- Top/Bottom
-
Top and Bottom values of the layer number.
- Color [optional]
-
Color of the layer. If the color is blank or not specified, the default Green color will be used.
- Label [optional]
-
Text to place inside the rectangle of the layer. Note that once the text is placed, it is not associated with the layer and will not reposition with the layer. To include a comma in the text, the text must be enclosed in double quotes.
- Label Position [optional]
-
Position of the label within the layer rectangle. Must be one of "Left", "Center", "Right". The default is "Center".
Example File:
# A line starting with a '#' is ignored
#If an optional value is not provided, the a default will be used.
#The layer number, top, and bottom values must be provided. Other columns are optional.
1, 10, 20
2, 30, 40, blue
3, 50, 60, green, Some text
4, 70, 80 red, "Some text, with a comma", Left
Text Details
The text details button  acts
identically to the standard Text tool. Clicking this button converts the
selector tool into a crosshair tool. When you click a position in your plot, the
Text Details dialog appears, enabling you to type into the text field to add
text to your plot.
acts
identically to the standard Text tool. Clicking this button converts the
selector tool into a crosshair tool. When you click a position in your plot, the
Text Details dialog appears, enabling you to type into the text field to add
text to your plot.
Customizing Text
The Text Details dialog also allows you to customize the text style, including color, font, size, angle, and other options. The style currently chosen when you close the dialog will become the default style for the next text box added.
You can also specify the positioning and positioning method of your text on the RFT plot:
-
From the Position By menu in the dialog, you can choose the positioning method of the text box. Using "Frame" from the menu will associate the text box with its relative position in the frame. With "Frame" chosen, the text box will remain in the same place in the frame, ignoring zooms, pans, axis range changes, or variable changes. Choosing "Grid" from the menu ties the text box to the Y-axis variable (typically DEPTH in an RFT plot). With "Grid" chosen, the label will follow the line plot when you zoom in or out. Typically, the "Grid" positioning system works better with RFT plots.
With "Grid" positioning, the text box will also maintain the chosen X coordinate, as long as that coordinate falls within the range of the plot. If you switch to a different variable for the X-axis that would cause the text to fall outside the plot range, the text box will automatically reposition to fall within the new range. If this happens, the alignment of the new text position in the frame will match the chosen text anchor position.
-
You can choose the alignment of the text position with the Anchor Alignment dialog, accessed from the Text Details dialog.
Saving Text
Tecplot RS automatically saves text when you make a change that updates the plot (such as choosing a different variable, time/date, or well). You can also save the text by clicking the Save Details button in the RFT details region of the sidebar. You may find this ability useful if you decide to reposition the X coordinate of your text box: if you wish to change the default position of your text box relative to the X-axis, move the text box with your selector tool, and then click Save Details to make the new position the default. Otherwise, Tecplot RS will not save the new X coordinate.
Replicating Text in Other Wells
You can copy text from one well to another. To begin, click the text box with the pointer tool.
With the text box highlighted, choose from the menu (or press Ctrl+C). Switch to the well on which you wish to paste the text, and choose from the menu (or press Ctrl+V). If the text does not appear, you may have pasted the text in a position off the screen (if the depth range differs significantly from the first well). Find the text by zooming out or panning to the appropriate depth. You can also drag the text box to your desired depth. If you change the X coordinate of your text box, click Save Details to save the change.
Layer Details
The RFT layer button  enables you to add a background color to a selected range of Y-variable
values. These rectangular layers, defined by the top and bottom Y-variable
value, consist of a solid color. The layers stretch across the frame. (They
do not use explicitly defined X coordinates.)
enables you to add a background color to a selected range of Y-variable
values. These rectangular layers, defined by the top and bottom Y-variable
value, consist of a solid color. The layers stretch across the frame. (They
do not use explicitly defined X coordinates.)
RFT Layers Dialog
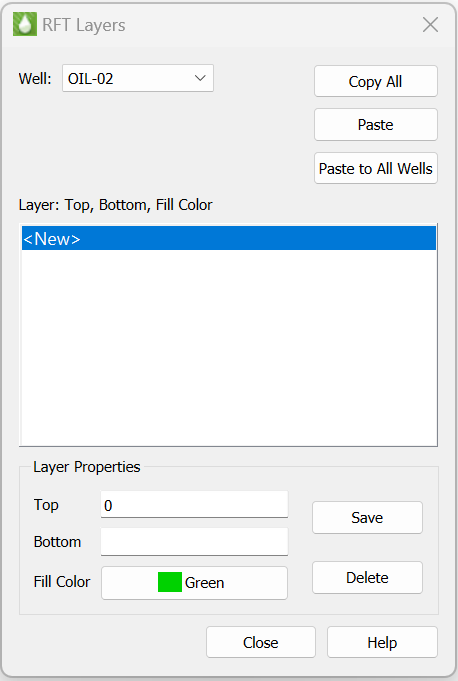
Clicking the button will
launch the RFT Layers dialog, the simplest and most accurate method of
adding or modifying layers for the current well.
In the RFT Layers dialog, choose a well in the active data set from the Well menu. Tecplot RS links the well chosen here with the list of wells in the sidebar: highlighting a well in this menu or in the sidebar will update the plot and the other list.
You can add a layer to the highlighted well by specifying a top and bottom Y-variable value, normally Depth, in the Layer Properties region of the dialog. Choose a color for the layer by clicking the color button next to Fill Color, and click the Save button to add the new layer to the well. When you click Save, the layer will appear on the plot as well as in the large "Layer" box in the middle region of the dialog.
The "Layer" box in the dialog shows a list of each layer present in the current well. To create a new layer, the <New> line must be highlighted. To modify an existing layer, highlight the layer you wish to modify in the "Layer" box, change the layer properties, and click Save to make the changes. To delete a layer, click that layer in the Layer box, and click the Delete button.
If you create more than one layer, the "Top" value of a new layer will default to the "Bottom" value of the last existing layer, and the "Fill Color" will default to the last color chosen.
The Copy All button in the RFT Layers dialog will copy all layers in the currently highlighted well. The Paste button will show the number of layers currently copied. For example, the Paste button would display as Paste (3) if you clicked Copy All when the current well has three layers.
To paste the layers into another well, choose a well from the menu and click the Paste button. If you paste layers into a well that already contains layers, Tecplot RS will add the pasted layers to the list of existing layers.
To paste the layers into all wells, click the Paste to All Wells button. When pasting the layers to all wells, if a layer’s Top and Bottom values match an existing layer, the existing layer will be overwritten.
You can add layers in any order, but they will always appear in the list sorted by depth. Tecplot RS performs no checks for gaps or overlaps. When layers overlap, the layer with the largest bottom value (greatest depth) will display on top.
Use the Save Details button to save the created rectangle(s). When you click this button, Tecplot RS saves the layers with the well and stretches the rectangle width(s) across the frame.
You can use the selector tool interchangeably with the RFT Layers dialog. For example, you can use the dialog to copy layers from one well to another, and then adjust the depths of the copied layers with the selector tool and the Save Details button.
Completion Profiles
Completion profile plots display variables versus level (completion) at a single point in time. Completions display on the Y-axis. The X-axis scales to encompass the range of variable values.
To create a completion profile plot, you must first load an XY data set
containing completions. To determine if a loaded data file contains
completions, use the Active Data Set region of XY page of the Manage Data
dialog (accessible by clicking the Manage Data button in the toolbar
 or by choosing
from the menu). Refer to
Loading XY Data for detailed information
about loading data files.
or by choosing
from the menu). Refer to
Loading XY Data for detailed information
about loading data files.
| You can also use the Filtering dialog to quickly determine whether your data includes completions. |
Once you have loaded a data file containing completions, change the plot type to "Completions" to begin creating your completion profile plot.
You can un-dock the Plot Controls sidebar by dragging its title bar to a new position. To put the Plot Controls back on the side of the workspace, double-click on its title bar (the region that displays the plot type). You can also drag its title bar to either side of the workspace, let go, and it will snap into place.
The sidebar for completions has the following options:
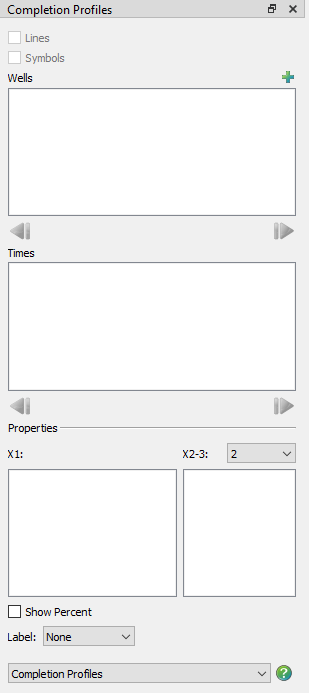
-
Wells The list of wells (that displays in the Wells box, in the Wells region of the sidebar) automatically displays only wells that include completion data. Instead of listing each completion separately, this box lists the well name along with the number of completions included in that well in parentheses. Click the
button
in the upper-right to launch an expanded, searchable entity list. This
helps especially for very long lists. -
Times The available times display in the Times region in the center of the sidebar. Each plot will reflect values at a selected time. The time unit (date or time) to use is determined by a setting in the Miscellaneous Settings region of the Load/Save page of the Plot Options dialog.
-
Variables You can choose the variable(s) that Tecplot RS will plot in the Variables region of the sidebar, in the various boxes. You can plot up to three variables at a time. Use the left-hand box to identify the X1 variable and the right-hand box to identify the X2 and X3 axis variables. The bar color matches its associated axis color.
-
Show Percent Turn on the Show Percent control to add another X-axis scaled from 0 to 100. The line shows the values at each completion as a percent of the total of all layers.
-
Label Use the Label menu to add Depth/Length or K-plane labels to the completion bars in the plot. The labels display in a text box at the end of the bar(s) for each completion.
-
Flow Tables
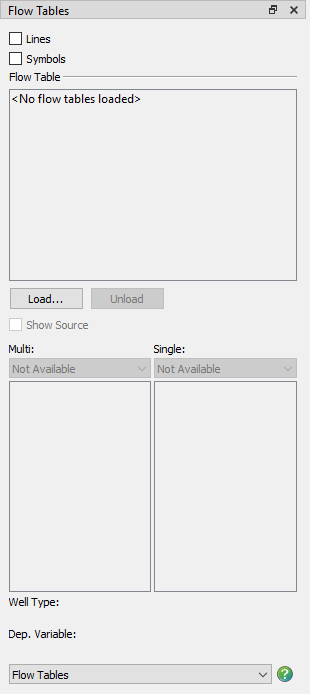
The Flow Tables function requires familiarity with CHEARS flow table (.flot) files. Flow table plots display the information in one or more CHEARS *.flot files. Flow tables contain an N-dimensional array of bottom hole pressure (BHP) values plotted for N-independent variables. BHP is shown on the Y-axis of the plot. Flow tables also include a dependent variable which Tecplot RS places on the X-axis. (Dependent variable applies to the flow table, not to the Tecplot RS plot.) Flow tables are plotted by creating XY-slices from a combination of independent variable settings.
Loading Flow Table Data
A flow table data set acts differently from other data sets used in the other XY plotting options. Because of their uniqueness, you cannot load them from the standard file loading dialogs. You can access them through the Flow Table sidebar (choose from the menu).
You can un-dock the Plot Controls sidebar by dragging its title bar to a new position. To put the Plot Controls back on the side of the workspace, double-click on its title bar (the region that displays the plot type). You can also drag its title bar to either side of the workspace, let go, and it will snap into place.
Click the Load… button to launch the Read Data dialog. To load a flow table file, select the .flot file type. To experiment with flow tables, you can load the chelan.flot data set included in the examples folder of your Tecplot RS installation.
You can load more than one flow table file at a time. If you do, you may find it helpful to toggle-on "Show Source" in the sidebar, below the Load… button. This will show the file name along with the flow table number.
You can remove the flow tables with the Unload button in the sidebar.
Flow Tables Selections
Once you have loaded a flow table data set, the sidebar will display available variables and options.
The data file determines the well type (injector or producer) and dependent variable. The sidebar displays these variables for reference.
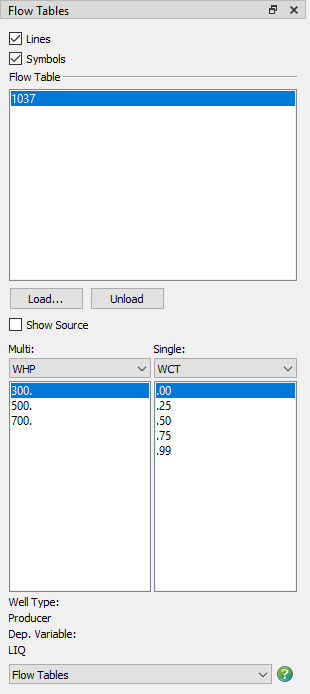
Multi
When you select a variable in the Multi menu, the box beneath shows all the associated independent values of the selected variable. From this list, you can select one or more data values. Each will display on the plot using a different line color.
Single
The Single heading can list one or more variables. When you choose one from the menu, the box beneath will display the independent values for that variable.
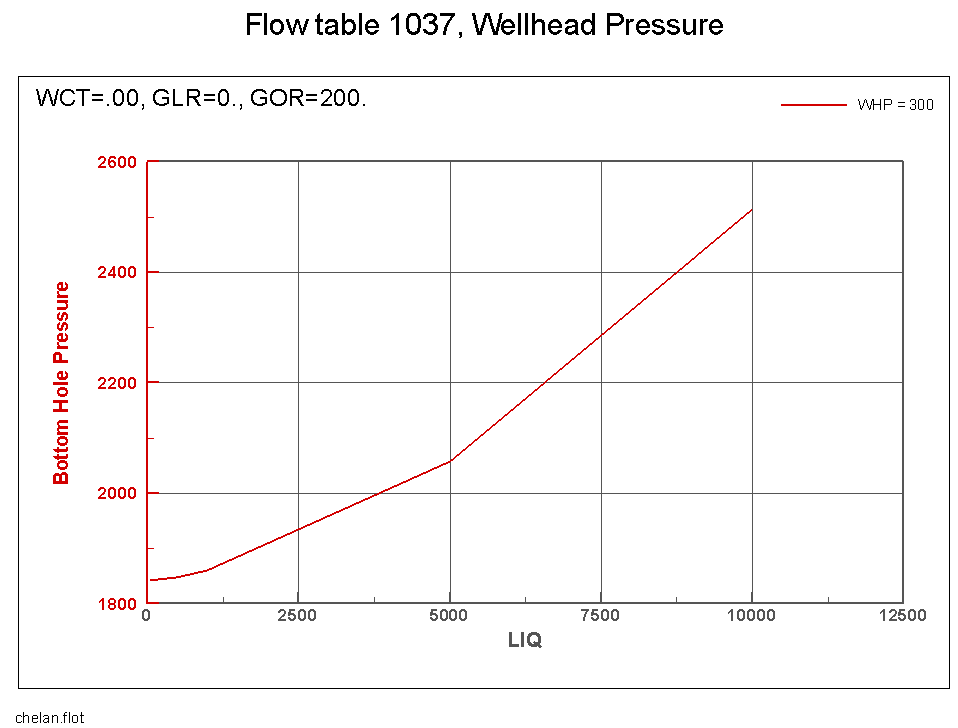
You should choose one value for each of the single variables. These selections will determine the data to be plotted. The plot title will also reflect your variable value choices. For example, if you load the example file chelan.flot, you will see the following plot.
| Whenever you change any value that affects the flow table plot, Tecplot RS redraws the plot with the new settings. |