Comparing Grid Data
As with XY data, Tecplot RS includes tools that allow you to compare grid data sets.
| While this chapter focuses on comparing grid data sets, you can also compare XY data. See Comparing XY Data for details on this feature. |
The method you should use to compare data sets depends on the type of plot you wish to create:
-
Using the Compare Toggle This powerful option serves as the primary method for comparing data files. It also allows you to create delta plots. With this option, Tecplot RS plots your data sets in two, three, or four separate frames.
You can use the Compare toggle for both 2D Grid Plots and 3D Grid Plots. To use this option, the data sets must use identical variable names, unless you link the variable names with an alias.
-
Creating Delta Files A delta file is a file that can be generated by Tecplot RS that stores only the differences between two data sets. This can be loaded with the original data sets so that the differences can be displayed alongside the original using the Compare toggle.
Using the Compare Toggle
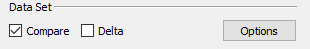
To compare data sets, first load multiple grid data files, then activate the Compare checkbox in the Data Set section of the sidebar. You can then use the Compare Options dialog to choose which data sets to use in the comparison and to change which is the active (or master) data set.
Loading Multiple Data Files
Tecplot RS allows you load any number of grid data sets. For each data set, choose "Load Grid Data" from the Project menu (see Loading Grid Data). Data sets after the first are inactive until made active by selecting them in the Manage Data dialog (). Refer to Managing Grid Data for information on managing multiple grid files in Tecplot RS.
After you have loaded the data sets the first time, you might want to save a project file so you can load the data sets in fewer steps in the future. Refer to Projects for additional information.
Active Data Set
When you load multiple files, only one file functions as the active data set. Tecplot RS will display the active data set by default in all plots and will use it to determine which entities and variables appear in the selection lists. When doing comparisons, Tecplot RS uses the active data set as the data set to which it compares the other files. The Compare Options dialog, accessible by clicking the Options button in the Data Set section of the sidebar, lets you choose the active data set. If "Force unlinked grids to sync" is selected, grid views between datasets are always synchronized when compared regardless of size and extent. If not selected, then Tecplot RS will automatically synchronize views if it determines that the grids in each data set are similar in terms of size and extent. Normally it is not necessary to select this option.
|
|
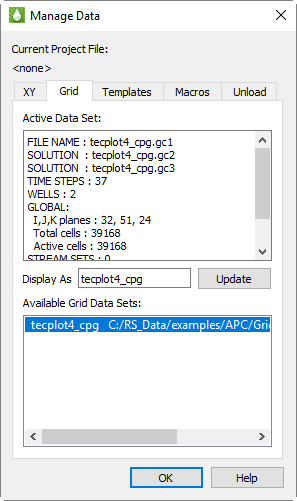
If you need more information about a data set before choosing it, see instead the Grid page of the Manage Data dialog. The active data set appears highlighted. The Active Data Set box lists a summary of the entity types available. You can change the active data set at any time by selecting a different data set in the Available Data Sets region of the Manage Data dialog.
|
|
Selecting Data Sets for Comparison
To activate the comparison feature, toggle-on "Compare" in the sidebar.
Then click Options to open the Compare Data Sets dialog and choose the data sets to be compared.
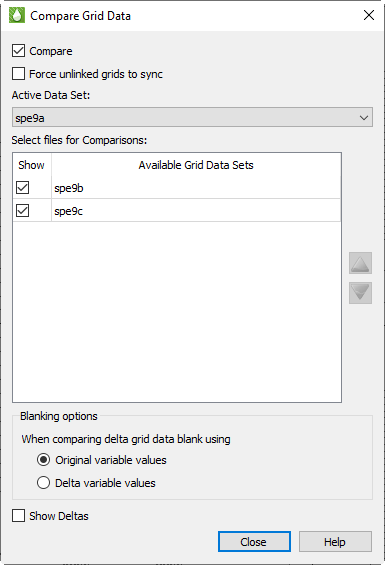
The name of the active data set appears at the top of the dialog, under "Active Data Set," and may be changed here (as well as in the Manage Data dialog shown previously). The remaining loaded data sets are displayed in the Select Files for Comparisons box.
To include/exclude a frame in the comparison plot, toggle the checkbox in the "Show" column next to the data set name on or off. Note that if the "Compare" toggle is checked on the sidebar or in the dialog, the plot will be immediately redrawn. If the compare toggle is not checked then redrawing will be deferred until it is checked. Unchecking the "Compare" toggle will allow you to select plots for comparison and rearrange their order without redrawing the plot multiple times.
Compare Frames Ordering
Compare plots may be reordered in the plot by clicking the "up" and "down" arrow buttons, or by selecting one or more datasets and dragging them to a new position.
| Only datasets with the "Show" toggle checked will be included in the comparison plot, however the ordering of all data sets in the list may be changed. Changing the ordering of datasets not selected with the "Show" toggle has no effect on the comparison plot. |
When grid delta is used, blanking will be applied based on either the original variable values or delta values depending on this selection. (Default: Original variable values)
The settings in the Multi-Frame Options dialog are ignored in the comparison plot; instead, most frame attributes are linked so that the controls in the sidebar now modify all active frames, when the data sets being compared match closely enough. For example, you can choose the variable being displayed and toggle various plot features, such as mesh and shade, on or off, for all frames. If you zoom or rotate one frame, the others will zoom or rotate at the same time. The same time step is shown in all frames.
| See below for how Tecplot RS behaves when the data sets are not similar enough to synchronize the frames. |
Comparing Dissimilar Data Sets
The Compare feature works best when the grids being compared have the same dimensions, coordinate systems, time steps, and variable names. However, in the real world, this isn’t always the case.
-
If the grid origins or coordinate units are different, the views won’t be linked, and you’ll need to do rotations and zooms on each frame separately.
-
If the grid IJK dimensions or number of cells are different, you won’t be able to calculate deltas, but you’ll still be able to do side-by-side displays. 2D Grid plots and inside views that reference IJK planes will work up to the limits of the planes in each grid.
-
If the exact time step cannot be found in every data set, the closest time step will be selected. The frame title will indicate the time actually used.
Tecplot RS must be able to match variable names to display the correct variable in all comparison frames. However, you can use variable aliases to match variable names from one data set to another. For example, if the active file uses OPR for oil production rate (typical for Eclipse/SLB files) and a comparison file uses QOP (VIP standard), you can tell Tecplot RS that QOP is an alias for OPR. Aliases are entered using the Variables page in the Plot Options dialog; see Variables.
You can edit the Master Variables List to expand the list of variable aliases.
Delta Comparisons
When "Show Deltas" is toggled-on in the sidebar, Tecplot RS will calculate and display the difference in the value of the selected variable between the active data set and the comparison data set(s). Note the range of values in the color legend in the delta frames will be different from that of the master frame.
Creating Delta Files
An alternative way of comparing grid files is to create a "delta" file; that is, a file of the calculated differences between two solution files. The delta file can then be loaded into Tecplot RS and even displayed alongside the original file using the Compare toggle. This procedure works with Eclipse/Chears grid files, VIP Map grid files, and Sensor Map grid files.
To begin creating a delta file, choose from the menu.
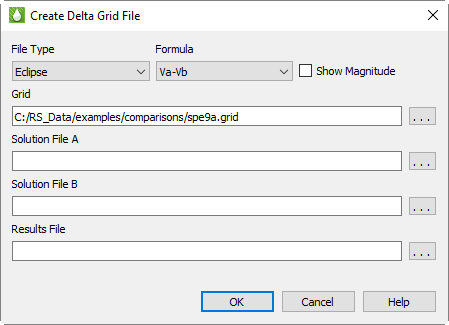
In the Create Delta Grid File dialog that appears, you can adjust the settings for your delta grid file, indicate where to save it, and click OK to create the file. The dialog offers the following settings:
-
File Type Use the File type menu to specify whether to compare a set of Eclipse data files, VIP Map data files, or Sensor Map data files.
-
Formula Choose one of four formula selections to designate how the delta file is calculated, and toggle-on "Show Magnitude" if you wish to use the magnitudes of the calculations.
The four formula selections by which the delta file is calculated include the following, where Va indicates each value in the first data file and Vb indicates the corresponding value in the second data file:
-
Va-Vb = Value in Solution File A minus corresponding value in Solution File B (default)
-
Vb-Va = Value in Solution File B minus corresponding value in Solution File A
-
(Vb-Va)/Vb = Value in Solution File B minus corresponding value in Solution File A, normalized by the value in Solution File B
-
(Va-Vb)/Va = Value in Solution File A minus corresponding value in Solution File B, normalized by the value in Solution File A
Toggle-on "Show Magnitudes" to use the magnitude (absolute value) of the calculation method you chosen. This option ignores the direction (+ or -) of the delta value.
-
Grid Use the Grid field and browse button to specify the grid file to use. The two solution files must belong either to the same grid or to grids with identical structures (they must have the same LGRs, same dimensions for each grid, and identical inactive cells).
The Grid controls do not appear when you choose "Sensor Map" in the File Type menu, since Sensor Map files include the grid and solution data in the same file. Tecplot RS does not need a separate grid file in this case.
-
Solution Data A Specify the first solution file to use.
| All non-solution data used by Tecplot RS (for example, grid structure and well geometries) will be copied from file A into the result file. The equivalent data in file B will be ignored. |
-
Solution Data B Specify the second solution file to use.
-
Results File Specify the name of the delta file that Tecplot RS will create, including the complete path. The delta file (Results File) will contain the calculation results of each value in Solution File A and its corresponding value in Solution File B. The variables in the delta file will be the difference values and will be named dVariable, where Variable is the original variable name. For example, if water saturation (SWAT) is present in both solution files, the variable name in the delta file will be dSWAT. If you plan to compare this file using the Compare sidebar checkbox, you should create variable aliases to link these variable names to the originals.
| Because variables names are limited to 8 characters in the Eclipse file format, Tecplot RS will truncate variable names that have 8 or more characters to 7 characters when 'd' is added. For example, "PRESSURE" becomes "dPRESSUR". |
| Although the output file is formatted like the input files, it contains only those data fields recognized or needed by Tecplot RS. For this reason, we cannot guarantee that other visualization/post-processing applications will be able to load or display the output file. |