Paper Layout
The Paper Layout mode let you design a layout for your plots. The layout controls a variety of items to create a professional, finished presentation plot, including:
-
Paper size, color, and orientation
-
Titles identifying the entity, variable, and so forth
-
Page number, date, or time
-
Legends
-
Orientation axes showing view rotation
-
User-defined text and images (company name and/or logo, address, project, any additional text or image elements)
-
Areas for headers and footers
-
Color, size, font, location, and orientation of all the above
Your installation includes a default layout. You can also define and save your own layouts. Tecplot RS stores paper layouts in named files with an extension of .rslayx. You can create a single file and instruct Tecplot RS to use it as the default layout for each plot. Alternatively, you can create multiple layouts and choose which layout to use for a particular plot type. This approach works well with macros, since you can automatically load a new paper layout prior to any sequence of plots.
Creating a Paper Layout
From the menu bar, choose "Paper Layout" from the menu. Your current plots will disappear and the sidebar will change to reflect the options for Paper Layout.
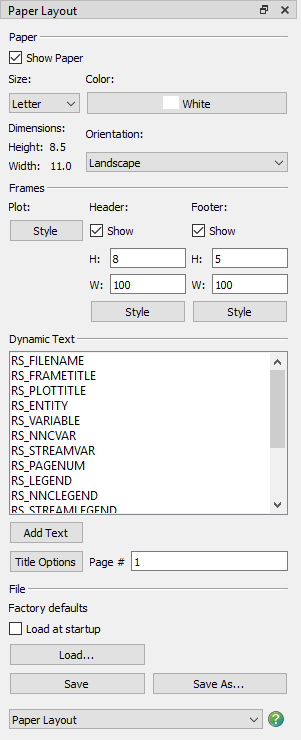
The Paper Layout Sidebar is divided into 4 primary sections:
Paper
Use the Paper region of the sidebar to specify the paper orientation, size and color. The Paper region of the sidebar has the follow controls:
-
Show Paper Use the Show Paper toggle to include or remove the paper display from your plot. The paper display allows you to see how your plot(s) will appear on printed paper.
-
Color Use the color button to change the paper background color. The paper background color will not be included in any print-outs.
-
Size Use the Size menu to specify the paper size.
-
Orientation Use the Orientation menu to specify the paper orientation (choose Portrait or Landscape).
Frames
Use the Frames region of the sidebar to customize the Header and Footer and the plot Frame Style in your paper layout.
Header and Footer
Two toggles control whether to include header and footer frames.
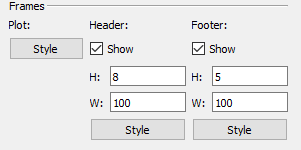
The header and footer are separate frames from the frame containing the plot. The header and footer can contain only text or geometries. You may find header and footer frames especially useful when you work with multi-frame plots, since text in these frames will not be repeated in each of the plot frames. For example, the footer frame can be used to create a title block that includes the company name, date, and page number.
Toggling-on "Show" for the header or footer in the sidebar will activate the text fields for defining the height and width. These values define the amount of space allocated for the header or footer frame, as a percentage of the paper height and width.
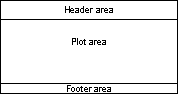
For example, a header with a 10% height and a footer with a 5% height will leave 85% of the paper available for plots:
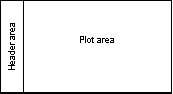
The header and footer are not limited to the top or bottom of the page. By swapping the height and width values, you can place the header on the left edge of the page:
The space used by header and footer frames (if selected) will reduce the area available for the plot frames. Sizes in the range of 5 to 10% will generally produce pleasing arrangements.
While in paper layout mode, only a single plot frame displays even if you wish to design a layout for multi-frame plots. If you apply a layout to a multi-frame plot, Tecplot RS will size the frames to fit within the area covered by the single plot frame shown in paper layout mode.
Frame Style
Click any of the Style buttons to launch the Frame Options dialog, which allows you to customize color and border options for each frame.
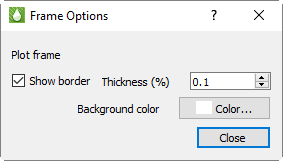
Use this dialog to choose whether or not to include a border, to choose the border thickness, and to choose a background color, if any.
The dialog indicates the frame that you are editing. Any changes you make will be reflected immediately. You can change the frame (Plot, Header, or Footer) you are working on by clicking one of the three Style buttons on the sidebar or by clicking on the frame.
See Using Frames for additional information on working with frames in Tecplot RS.
Saving the Paper Layout
To use your paper layout settings on other plots, save your settings to a file. This allows you to maintain different settings for different scenarios. Click the Load button in the Paper Layout sidebar to load paper layout settings. You have the option either to load an existing paper layout file (*.rslay, *.rslayx) or to load paper layout settings embedded in a project file (*.rspr). Refer to Projects for additional information about project files.
| Older versions of Tecplot RS stored paper layouts in files with names ending in .rslay. You can still load these in today’s Tecplot RS, but they won’t appear in the Open File dialog initially. Choose the file type "RS Paper Layout: Pre-7.5 format (*.rslay)" to make them visible. |
After making changes to the paper layout, if the paper layout file is already open, use the Save button to save your changes. Otherwise, use the Save As button to assign a file name and save the design. The file will have an extension of .rslayx. Toggle-on "Load at startup" before saving the file to have Tecplot RS load that layout every time it launches.
If you would like to associate your paper layout file with a set of XY and/or grid files, we recommend creating a project file. To create a project file, choose from the menu. Refer to Projects for additional information.
Multi-frame Paper Layout
The paper layout can be applied to a single frame layout or a multi-frame layout. Refer to Using Frames for a description of creating multi-frame plots, as well as an example of using a multi-frame paper layout.
Modifying your Paper Layout
You can modify your paper layout at any time by returning to paper layout mode and saving the layout file. Alternatively, you can dynamically update many of the attributes of your paper layout by choosing the Update Styles button in the sidebar. The Update Styles button will modify the active paper layout if you make any style changes (for example, re-positioning or re-sizing a legend). However, Tecplot RS will not update the paper layout when you add or delete items. To make any permanent additions or deletions (including text strings), you must switch to paper layout mode and make your changes.
Adding Text
You can add three types of text to your paper layout:
-
Static text As the name suggests, static text does not change. Static text might include your company’s name, address, and telephone number. Refer to Title Options for additional information.
-
Dynamic text Dynamic text changes according to the situation. For example, you can insert the date. Tecplot RS also uses dynamic text to label the variable name and entity name, to identify each plot.
-
Placeholder text This type of text is used for legends and the orientation axis. The placeholder text will determine the position and style of these items, but the actual object will be displayed only when appropriate. For example, the orientation axis will be shown only on 3D grid plots, and the bubble legend only on bubble plots. The placeholder text is used only to mark the position on the paper layout; on the actual plot, the legend or orientation axis will be shown.
To add text to the paper layout:
-
Click the Text tool button in the toolbar, or choose from the menu.
-
Click anywhere in a frame to set the location of the text.
-
Use the Text Details dialog that appears to type and modify text and formatting.
To add dynamic text and placeholder text to the paper layout:
-
Make sure the frame in which you want to add the text is active. (Click the frame border to activate the frame if necessary.)
-
Click the desired dynamic text or placeholder in the Dynamic Text list box in the sidebar.
-
Click the Add Text button. The text appears in the middle of the frame.
-
Double-click the text to open the Text Details dialog, then modify styles and options.
-
Click and drag the placeholder text to the desired location on the frame.
Legends
To include legends in your plot frame, use one of the following five specialized placeholder text strings.
| Placeholder Text | Explanation |
|---|---|
RS_LEGEND |
Primary legend for grid or XY plots. Always appears on the main plot; will be included in each plot frame of both XY and grid plots if included on the paper layout. |
RS_NNCLEGEND |
Shown when non-neighbor connections (NNCs) are visible in grid plots |
RS_STREAMLEGEND |
Shown with streamlines in grid plots |
RS_BUBBLELEGEND |
Shown with bubbles in grid plots |
RS_INACTIVELEGEND |
Shown when an inactive grid mesh is shown in color in grid plots |
The position of the placeholder text determines the position of the legend. The text styles assigned to the placeholder text will be applied to the text in the displayed legend.
Text Details
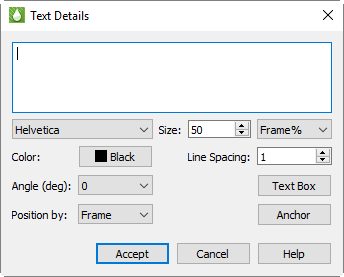
The Text Details dialog allows you to control the style of the text. For placeholder text for legends, the styles assigned to the text will be applied to the legend that appears in its place. Font, style, and color settings are used for legend labels, anchor and position settings control the legend placement, and text box options will control whether a box is drawn around the legend itself.
The Text Details dialog includes the following controls:
-
Text Field For static text, enter the text you wish to create in the top text field. For dynamic and placeholder text, do not modify the text displayed here.
-
Font Choose a font for the text from the Font menu.
-
Size Use the Size control to adjust the sizing of your text or legend label. You can choose whether to control your font size in points or in frame percent ("Frame %"). If you choose to use points, the font will always appear as that size. If you choose frame percent, Tecplot RS will resize the font when the frame is resized, so that the font always appears as a ratio to the frame size.
-
Color To modify the color of the text, click on the Color button and choose a color in the Color Chooser dialog.
-
Line Spacing To adjust the spacing between lines of text, type or adjust the number displayed in the Line Spacing control. Applies only to multi-line static text.
-
Angle (deg) You can adjust the orientation of the text with the Angle control. Tecplot RS measures the angle in degrees counter-clockwise from the horizontal axis: zero degrees indicates horizontal text; 90 degrees indicates vertical text. You can type an angle in degrees or choose a common angle in the Angle menu.
Note that this applies only to static or dynamic text. For placeholder text (legends and the orientation axis), leave this at 0. Instead, you can choose a horizontal or vertical contour legend alignment on a variable-by-variable basis in Plot Options.
-
Position By Ignore this field. Both text and legends are always positioned relative to the frame.
-
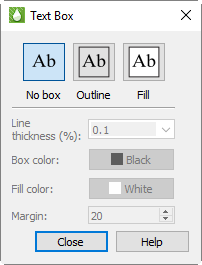
Text Box Click the Text Box button to open the Text Box dialog, where you can control the appearance of a box around the text or legend and choose a background (fill) color if desired. You can also choose a margin; although you can enter larger values, Tecplot RS limits margins to 5%.
-
Anchor To adjust the relationship of the entered text to the point clicked, click the Anchor button.
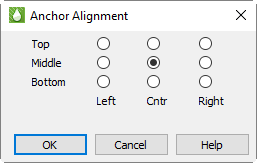
For legends, this should generally match the part of the frame where the anchor is positioned (for example, a corner); it will determine which direction the legend grows, and you will want the legend to grow toward the center of the frame.
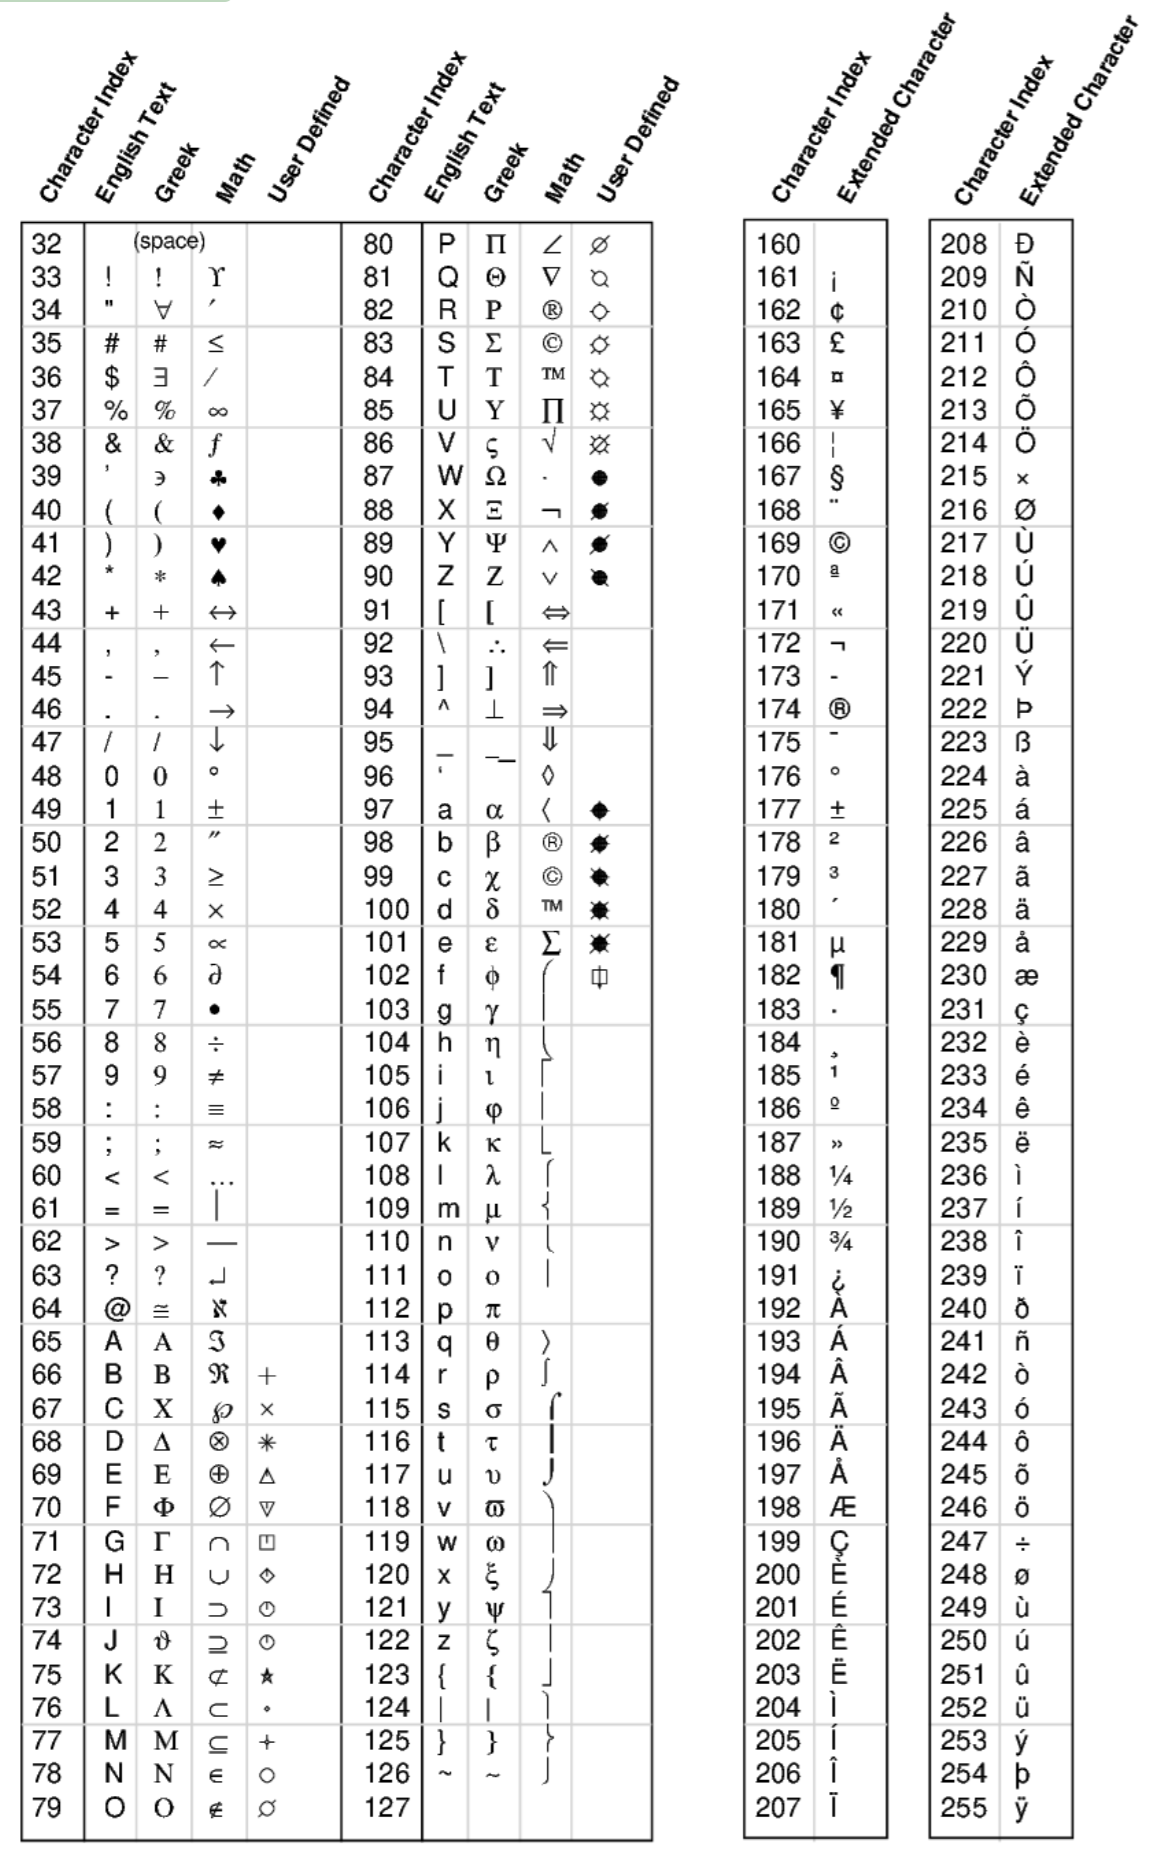
Embedded Characters
You can embed Greek, Math, and User-defined characters into static text by enclosing the characters in text formatting tags. The text formatting tags and their effects include the following (format tags can appear in upper or lower case):
|
Embedded special characters display correctly only in texts of English font; they have no effect in text created in Greek, Math, or User-defined fonts.
To insert a tag into text literally, precede the first angle bracket with a backslash ("\"). To insert a backslash in the text, just type two backslashes ("\\"). In ASCII input files, the number of backslashes must be doubled (two to precede a special character, four to create a backslash) because the Preplot program also requires a backslash to escape special characters.
Superscripts and Subscripts
As described previously, you can produce subscripts or superscripts by enclosing any characters with <sub>…</sub> or <sup>…</sup>, respectively. Tecplot RS has only one level of superscripts and subscripts; expressions requiring additional levels, such as 'Equation Here', must be created by hand using multiple Tecplot RS text strings. If you alternate subscripts and superscripts, Tecplot RS positions the superscript directly above the subscript. Thus, the string a<sub>b</sub><sup>c</sup> produces 'Equation Here'. To produce consecutive superscripts, enclose all superscript characters in a single pair of tags. The string x<sup>(a+b)</sup> produces 'Equation Here' in your plot.
European Characters
Tecplot RS supports the ISO-Latin1 character encodings. Characters in the ordinal range from 160-255 are now available, providing support for most of the major European languages. Custom Characters shows the characters supported by Tecplot RS. Note that the two right-hand columns represent the extended European characters. Text formatting tags for Greek, Math, or User-defined characters work only with characters in the range 32-126 and is not available for the extended European characters.
If your keyboard is configured to produce European characters, then the European characters should appear and print automatically with no additional setup.
If your keyboard is not configured to produce a specific European character you can generate it by including the sequence \nnn in your text where nnn is from the character index table found in Custom Characters. For example, if your keyboard will not generate the and you want to show the word "lattté" enter: latt\233
Dynamic Text
The Paper Layout sidebar includes the most commonly used dynamic text items in the Dynamic Text region. This provides a simple shortcut for adding these items. The following items are categorized as Dynamic Text, meaning text that will change to reflect either what is currently being displayed or the state (date and time) when the plot was created.
1. f you entered text in the Display As box on either the XY or Grid page of the Manage Data dialog, this text will appear in your paper layout (instead of the file name). Refer to Loading XY Data or Managing Grid Data, respectively, for additional information.
|
Smart Labels
The dynamic text options contain items that can duplicate each other. Understanding how each item works will prevent confusion.
RS_ENTITY and RS_VARIABLE will always label the entity and variable, respectively. In grid plots, RS_ENTITY will list the time stamp for time-dependent variables, and plane number for 2D Grid plots.
RS_FRAMETITLE will sometimes be the same as RS_ENTITY, and other times it will match RS_VARIABLE. The same is true for RS_PLOTTITLE, except it will use the alternate selection as the frame title.
Basically, RS_ENTITY and RS_VARIABLE are locked to always display exactly the text they are named for. RS_FRAMETITLE and RS_PLOTTITLE are "smart" options that adjust to reflect what makes the most sense according to the plot type.
This makes it easier to create a "generic" layout that can be used in all plot types, especially with multiple frames. For example, when you create XY Variables plots with multiple frames, each frame shows the same variables but a different entity. You might put the variable names in the header frame just once, but add the entity names to each frame. However, in the XY Entities plots, the entity name remains the same for all frames, and the variables change.
If you created layouts with RS_ENTITY and RS_VARIABLE dynamic text items, you would need to create a separate layout for each plot type. However, by using RS_PLOTTITLE for the label that goes in the header frame, and RS_FRAMETITLE for the heading that changes with each frame, you would leave it up to Tecplot RS to decide the most appropriate item to label in each.
The sample paper layouts included in your installation use the smart labels and are a great place to start.
Page Number
One of the dynamic text items is the page number. A text field in the Paper Layout sidebar allows you to input or reset the starting page number. You can also reset this value in the Auto-Export dialog.
If you entered text in the Display As box on either the XY or Grid page of the Manage Data dialog, this text will appear in your paper layout (instead of the file name). Refer to Loading XY Data or Managing Grid Data, respectively, for additional information.
Title Options
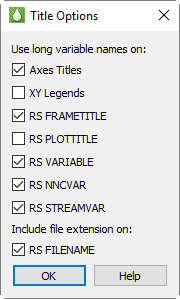
Tecplot RS gives you the ability to choose between displaying the short or long version of all variable (property) names. Click the Title Options button in the Paper Layout sidebar to specify when and whether to use long variable names in the following locations:
|
You can also choose whether to include the file extension when displaying RS_FILENAME in frames or legends.
Dynamic Text in XY Freestyle Plots
When working with XY Freestyle Plots plots, the value of some of the dynamic text variables depends on the plot contents. Tecplot RS determines the variable values according to the following rules:
-
For RS_FRAMETITLE and legends:
If multiple XY files are open, AND all maps on a single frame use the same file, then:
-
RS_FRAMENAME = the file name
-
Legend contents = the variable and entity names
Else, if all maps in the frame reference the same entity, then:
-
RS_FRAMENAME = the entity name.
-
Legend contents = the variable name.
Else, if all maps reference the same variable name, then:
-
RS_FRAMENAME = the variable name.
-
Legend contents = the entity name.
Else
-
RS_FRAMENAME is blank
-
Legend contents = the variable and entity names
For all cases listed here, if the plot includes multiple loaded files, the legend also shows the file name.
-
-
-
RS_PLOTTITLE - RS_PLOTTITLE is blank.
-
RS_ENTITY - If all maps reference the same entity, the RS_ENTITY shows the entity name. Otherwise, it is blank.
-
RS_VARIABLE - If all maps in a frame use the same variable, the RS_VARIABLE shows the variable name. Otherwise it is blank.
Adding Geometries
You can enhance a plot using Tecplot RS’s drawing tools. Tecplot RS provides simple tools for creating polylines, squares, rectangles, circles, and ellipses in your paper layout. Tecplot RS geometries are line drawings and images. Images are discussed in Adding Images.
To create a geometry, draw it in a frame using the appropriate tool accessible in the menu.
Polyline
To add a polyline to your paper, first choose from the menu to active the Polyline tool. To draw the polyline, click at the desired beginning point of the first line segment, move the pointer (without dragging) to the desired end point of the first line segment, and click again. Move the pointer to the next end point, click, and so on. After placing the last segment, double-click on the final end point, or right-click.
To draw a horizontal or vertical line segment, type the H or V keys, respectively, while drawing the segment. After you place the segment’s end point, the horizontal or vertical restriction ends. To lift the horizontal or vertical line segment restriction without placing the end point, type A on your keyboard. You can draw unconnected line segments in a single polyline; press U on your keyboard to "lift the pen." You can then move the pointer to the start of the next line segment. Refer to the following table for each key command.
A |
Allow translation of polyline segments in all directions. |
H |
Restrict translation of current polyline segment to horizontal. |
U |
Pen up, while drawing polyline. |
V |
Restrict translation of current polyline segment to vertical. |
Circle
To add a circle to your paper, choose from the menu. Then click at the desired center point of the circle, drag the pointer until the circle is the desired radius, and release.
Ellipse
To add an ellipse to your paper, choose from the menu, click at the desired center point of the ellipse, drag the pointer until the ellipse is the desired size and shape, and release.
Square
To add a square to your paper, start by choosing from the menu. Drag the pointer away from the anchor point of the square, which Tecplot RS chooses as either the lower left-hand corner or the upper right corner of the square. Drag to the right of the anchor to create a square with the anchor at lower left; drag the pointer to the left to create a square with the anchor at upper right. Release when the square is the desired size.
Rectangle
Use the Rectangle dialog to insert a rectangle into your plot workspace.
To add a rectangle to your paper, choose from the menu to activate the Rectangle tool. Then drag the pointer until the rectangle is the desired size and shape. In contrast to squares, rectangles can grow in any direction.
3D Polyline
A 3D polyline may be used to display boundaries or structures in a 3D Grid plot. While it is not possible to create a 3D polyline geometry inside Tecplot RS, one can be imported using the Tecplot Data Loader ().
A 3D polyline file should only be imported after the 3D Grid plot is established. 3D polylines are transitory: they will be removed when the plot type is changed from 3D Grid.
The complete format of the Tecplot .dat Data File for 3D polylines is defined in the Tecplot 360 EX Data Format Guide. The key elements of this format required by Tecplot RS to import a 3D polyline are the following:
| Entry | Note |
|---|---|
GEOMETRY |
Required keyword to begin a geometry specfiication. |
CS=GRID3D |
This geometry is specified in the 3D grid coordinate system. The 3D polyline must be specified in the same units as the reservoir grid. |
T=LINE |
This geometry is a polyline. |
X, Y, Z |
Specifies the X-origin, Y-origin, and Z-origin of the polyline in grid units. |
L |
Line type. (SOLID, DASHED, DASHDOT, DOTTED, LONGDASH, DASHDOTDOT) |
C |
Line color (BLACK, RED, GREEN, BLUE, CYAN, YELLOW, PURPLE, WHITE) |
LT |
Line thickness relative to the frame size. A value of 0.4 is reasonable. |
DT |
Data type: SINGLE or DOUBLE precision. |
The following example provides additional information about the 3D polyline definition. It describes two offset polylines, one red and one blue.
GEOMETRY CS=GRID3D, T=LINE, X=0, Y=0, Z=0, C=RED, L=SOLID, LT=0.4, DT=SINGLE
1 # Number of polylines based on the above geometry record
5 # Number of points in the first polyline
3725. 5795. 9615. # X, Y, Z coordinates of point 1 in polyline 1
657. 3185. 9080. # X, Y, Z coordinates of point 2 in polyline 1
1565. 2755. 9240. # X, Y, Z coordinates of point 3 in polyline 1
5010. 4620. 9840. # X, Y, Z coordinates of point 4 in polyline 1
3725. 5795. 9615. # X, Y, Z coordinates of point 5 in polyline 1
GEOMETRY CS=GRID3D, T=LINE, X=0, Y=0, Z=0, C=BLUE, L=SOLID, LT=0.4, DT=SINGLE
1
5
3725. 5795. 9575.
657. 3185. 9040.
1565. 2755. 9200.
5010. 4620. 9800.
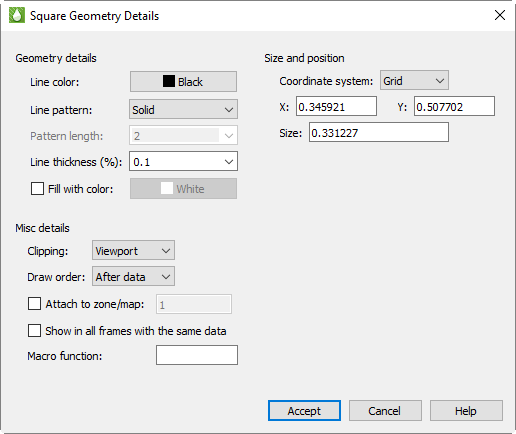
3725. 5795. 9575.Geometry Details
Use the Geometry Details dialog to specify attributes of polylines, circles, ellipses, squares and rectangles. To access the Geometry Details dialog, double-click on the geometry object itself.
The following options are available:
-
Line Color - Select a color for the geometry from the Select Color dialog.
-
Line Pattern - Select the desired pattern (Solid, Dashed, Dotted, LongDash, or DashDotDot).
-
Pattern Length (%) - Specify the length of the line pattern as a percentage of the frame width.
-
Line Thickness (%) - Specify the thickness of the line as a percentage of the frame width.
-
Fill With Color - Toggle-on to fill a circle, ellipse, square, rectangle or line segment polygon. Then select a color for the geometry fill from the Select Color dialog.
-
Coordinate System - Specify the coordinate system for the geometry (Frame or Grid).
-
Frame - The geometry is always displayed at constant size when you zoom in or out of the plot.
-
Grid - The geometry resizes with the data grid.
-
-
Positioning - Enter the X and Y-coordinates of the anchor position of the geometry (in frame units if the coordinate system is frame; in grid units if the coordinate system is grid) and its size. The fields for doing this vary depending on the type of geometry.
-
Clipping - Clipping refers to displaying only that portion of an object that falls within a specified clipping region of the plot. If you have specified your geometry position in the Frame coordinate system, the geometry will be clipped to the frame any portion of the geometry that falls outside the frame is not displayed. If you have specified the Grid coordinate system, you can choose to clip your geometry to the frame or the viewport.
-
Draw Order - Geometries can be drawn either before the data, or after the data. If a geometry is drawn before the data, the plot layers, such as mesh, contour lines, etc. will be drawn on top of the geometry. If a geometry is drawn after the data, the geometry will be drawn last, obscuring the data.
| You can place text and geometries in any order you like. Tecplot RS draws all geometries first, in the order in which they were placed, then all text. Use the Push and Pop commands from the menu to reorder objects in the viewstack. |
-
Attach to Zone/Map - Toggle-on "Attach to Zone/Map" to attach the geometry to a particular zone or mapping by entering the number of the zone or mapping. Geometries that are attached to an inactive or non-existent zone are not displayed.
-
Show in All "Like" Frames - Toggle-on this option to display the geometry in all frames sharing the active frame’s dataset.
-
Macro Function - In the text field, specify the name of the macro function that you wish to link to a particular geometry.
The following fields are specific to particular geometry types:
-
Polyline Arrowhead - These options control the appearance of an arrowhead on a drawn polyline.
-
Attachment - Choose the end or ends of the polyline by selecting the appropriate check boxes.
-
Style - Plain, filled or hollow arrowhead.
-
Size(%) - Specify the size of the arrowhead, as a percentage of frame height.
-
Angle - Specify the angle the arrowhead makes with the polyline. You can either enter a value (in degrees) in the text field, or choose a preset value from the drop-down.
-
-
Circle - Controls the radius and precision of approximation of the circle:
-
Radius - Set the radius of the circle (in coordinate system units, Frame or Grid).
-
Number of Sides - Enter the number of polylines used to approximate the circle.
-
-
Ellipse - Controls the shape and precision of approximation of the ellipse, as follows:
-
Horizontal Axis - Set the horizontal axis of the ellipse (in coordinate system units, Frame or Grid).
-
Vertical Axis - Set the vertical axis of the ellipse (in coordinate system units- Frame or Grid).
-
Number of Sides - Enter the number of polylines used to approximate the ellipse.
-
-
Square - Controls the size of the square, as follows:
-
Size - Set the size of the square (in coordinate system units, Frame or Grid).
-
-
Rectangle - Controls the size and shape of the rectangle, as follows:
-
Width - Set the width of the rectangle (in coordinate system units, Frame or Grid).
-
Height - Set the height of the rectangle (in coordinate system units, Frame or Grid).
-
Adding Images
You can also add BMP, JPEG, or PNG images to your paper, for example a logo or a backdrop. To add an image to the paper, choose from the menu and browse to the desired image file.
You cannot save images in data files or in a project. When you save a project or data file, any images in the plot are not saved.