Basic XY Plots
When you load an XY data file, it displays by default as an XY Variables plot type. You can change the plot type at any time using the menu or the Plot Type menu at the bottom of the sidebar. Tecplot RS supports the following basic XY plot types:
-
XY Variables XY variable plots depict a single X-axis (independent) variable with up to five Y-axis (dependent) variables. The axis variable selections are applied to all entities.
-
XY Entities XY entity plots depict an entity or group of entities plotted for single XY axes variable pair.
-
XY Subsets XY Subset plots display all of the components of a single well, user group or branch at one time (for a single variable).
-
XY Freestyle Plots XY Freestyle plots allow you to manually specify the components of your plot.
This chapter contains a discussion of each of the above plot types and examples for each type.
Loading XY Data
Tecplot RS allows you to load as many XY data sets as your computer’s memory will allow, and supports several different XY data set formats, including those used by Eclipse, Chears, VIP, Sensor, CMG, Landmark, and UTCHEM. The VIP, .plt and VDB loaders include the capability to read compositional plot data.
| CMG-format files are supported only on Windows. |
You can use multiple data sets for comparison or to switch from one to another. For example, you can load Chears HIST files for comparison with Eclipse .unsmry files. For a complete description of the supported formats, reference Tecplot RS Files.
| When loading a CMG-format data file, you can choose the units for the file from Tecplot RS’s menu using the CMG System Units menu item. You must choose the desired units before loading the data. This choice is saved in the project file and your most recent choice will be remembered for future use. All files in a project must use the same units. |
To start creating an XY plot in Tecplot RS, load a data set. Tecplot RS
supports two methods of loading XY data. The first, and most comprehensive
method, is the Load XY Data dialog, accessible by clicking the
 (Load
XY Data) button in the toolbar or choosing from the
menu.
(Load
XY Data) button in the toolbar or choosing from the
menu.
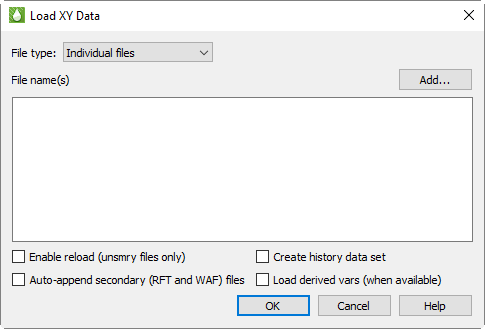
In the Load XY Data dialog, choose Individual Files or VDB Folder from the File type menu to specify the type of XY data file to load. Use the Individual Files choice to load all types of XY Data Files except for VDB folders. In that case, use the VDB Folder choice.
The second method optimizes data loading if you wish to load a large number of XY data files. You can drag a folder containing XY data files onto the Tecplot RS icon on your desktop (Windows platforms) or drag the folder onto the Tecplot RS application window.
The following sections explain each method.
| If you already loaded the data into a project and saved the project, choose from the menu. By opening the project, Tecplot RS will reload all data files contained in that project. Refer to Projects for details. |
Loading a Folder of XY Data Files
To load multiple XY data files most efficiently, drag and drop a folder containing XY data files onto either the Tecplot RS icon or onto the Tecplot RS application window.
Tecplot RS loads the following recognized XY data files contained in the dragged folder:
|
This load operation adheres to the following rules:
-
Loading the folder of data will not unload any loaded data; Tecplot RS adds the files to any already loaded data.
-
If the current project has loaded data, the active data set does not change. If the current project has no loaded data, the first file loaded from the folder becomes the active file.
-
If some files in the folder are already loaded into Tecplot RS, Tecplot RS will keep these files loaded and will load the remaining recognized files in the folder.
-
If a file with an .rft, .frft, .waf, or .rswaf extension has a base name matching the base name of another data file in the folder, Tecplot RS appends this file as secondary data (RFT or WAF, depending on the extension) to the data file with the matching name.
-
If the folder name includes "VDB", Tecplot RS loads all cases recognized in the file, as well as other XY data file types (VIP, Observed, and compositional).
-
Tecplot RS does not load data from any folders contained within the dragged folder, except for VDB cases.
To stop loading a folder of XY data files, click the Stop button in the status line of Tecplot RS.
You can also load a folder of these XY data file types from the command line, by navigating to the bin folder of the installation and then using the following syntax:
tecplotrs %data%/folder-to-load
In this example, include the path to the bin folder of the Tecplot RS installation if you did not first navigate to that location via the command line. Typing tecplotrs will launch Tecplot RS, and including the folder that you wish to load, represented by folder-to-load (including its path, represented by %data%), will indicate to Tecplot RS the folder that you wish to load. If the path to the folder to load or the folder name itself contains any spaces, enclose the entire item in quotes.
| Tecplot RS processes the command line arguments in order. So, for example, if you wish to include other arguments in the command line, such as a macro to run, list the folder to load before the macro. |
XY Data Files
Choose "XY Files" from the File type menu in the Load XY Data dialog to load individual XY data files or a VDB folder of XY data. (Access the Load XY Data dialog by choosing from the menu.)
| If you want to load both XY and grid data from a single simulation, you can do this through the Load Grid Data or Load VDB Data functions. See Loading Grid Data for details. |
The Load XY Data dialog has the following options:
-
Add Click the Add… button to launch the Open Files dialog, which will allow you to choose the data file(s) you wish to load. In the Open Files dialog, navigate to and choose the desired file(s). Click the Open button, and then click OK in the Load XY Data dialog to complete the loading process. You may click Add again to add files from a different folder. Each time you click Add…, the files you select are added to the list of files to be loaded.
-
Enable reload Toggle-on "Enable reload" in the Load XY Data dialog to allow reloading of the data file (Eclipse .unsmry) during your Tecplot RS session. If you toggle-on "Enable reload" when loading your data set, you can reload your data file at any time by clicking the Reload button in the sidebar. The current plot will revert to the initially loaded data. This helps when you want to monitor the output from a long simulator run. By clicking Reload, you can view the most recent output during the run.
-
Auto-append secondary (RFT and WAF) files Toggle-on "Auto-append secondary (RFT and WAF) files" in the Load XY Data dialog to automatically append RFT and/or WAF files to the data set. If you toggle-on this option, for each Eclipse .unsmry file that Tecplot RS loads, it loads an RFT file (with either an .rft or .frft extension) and/or a WAF file (.waf or .rswaf extension) having the same root file name, if found, and appends it to the corresponding Eclipse .unsmry file. With RFT data loaded, you can create Quick RFT plots (see Depth).
If you load only an RFT or WAF file with data already loaded, Tecplot RS will automatically append the RFT or WAF data to the corresponding .unsmry file. Refer to RFT Plots for information on loading an RFT Data file separately. In brief, click the Add… button in the Load XY Data dialog, and choose *.rft as the file extension in the Open Files dialog.
|
Auto append secondary (RFT and WAF) is only available for ECLIPSE .unsmry files and will be ignored for other file types. The auto-append checkbox also applies to .unsmry files loaded by dragging them into the Tecplot RS application window or onto the Tecplot RS icon. The state of this checkbox persists between RS sessions. |
-
Create history data set If you load an Eclipse file with this control toggled-on, Tecplot RS will create a data set consisting of all the history data contained in the Eclipse file. This way, you can use the file to compare simulation data to history data when using the history match feature in your reservoir model.
Tecplot RS creates and reads this history data set from the Eclipse file; it does not require the creation of a new data file. If you save data loaded with a created history data set as a project, Tecplot RS will re-create the history data set when you re-open the project.
If you have Tecplot RS create a history data set from the data in an Eclipse file, when you finish loading, Tecplot RS will prompt you to choose the active data set, since you now have more than one loaded.
A good way to compare your simulator data with the history data is to use the History Match plot type.
-
Load derived vars (when available) If you load a file with this checkbox activated, Tecplot RS automatically computes additional variables from the variables stored in the data file, where this supported by the loader. For example, most CMG files do not include rates or ratios; where these variables are missing, they will be calculated from the cumulative variables. Loading will be somewhat slower with these additional calculations performed. Inside Tecplot RS, derived variables are indistinguishable from variables that were actually read from the file.
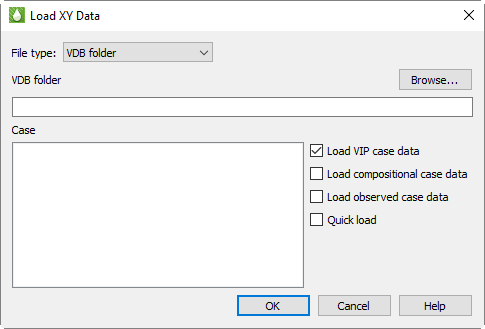
VDB Folder
Choose "VDB folder" in the File type menu of the Load XY Data dialog to open a VDB. To open the Load XY Data dialog, choose in the menu.
Data from the following class types can be loaded into Tecplot RS from within a VDB folder:
|
The Load XY Data dialog for a VDB folder has the following options:
-
Browse Click the Browse… button to launch the Browse For Folder dialog, which will allow you to choose the VDB folder from which to load case data. Choose the root VDB folder (this folder typically ends in a .vdb extension).
-
Case When you load a valid VDB folder with the Browse… button, the Case region of the dialog will display a list of case names read from the database. Choose one or more cases to load. Data from different cases will be loaded as different data sets in Tecplot RS.
-
Data types (Optional) Use the Load VIP Case Data, Load Compositional Case Data, and Load Observed Case Data, and Quick Load options to specify which sets of XY data to load from the database. (Quick Load reads only field, well, and region data and skips loading completions and network connections.) If you choose to load multiple types of data, each data type will be loaded into a separate data set in Tecplot RS.
Loading History Data
Tecplot RS provides several ways to load history data. You can load a CHEARS HIST file (.hist), load an Eclipse file containing history data, or create an ASCII file. If you use the History Match plot type, you can choose which data file to use as the history data in the Plot Controls sidebar.
-
Chears or Intersect History File To load a Chears or Intersect history data file (wells only), click the Load XY Data button in the toolbar (or choose in the menu) to open the Load XY Data dialog. Click the Add button in that dialog, and choose "Chears HIST (*.hist)" or "Intersect OBSH (*.obsh)" as the file type to load. Navigate to and select the file and click Open and OK to finish loading it.
-
Chears CSV File You can create a CSV file of history data and load it as the "Chears CSV (*.csv)" file type. With this file type you can include wells, fields, groups, and regions, rather than just wells. To create this file type, use a spreadsheet program such as Microsoft Excel and create a table of your data. The file should include one header row labeling the following required columns:
-
Date or Time Use one column to give each row a date or time. Tecplot RS accepts most standard date and time formats.
-
Category In this column, label each row "Well", "Group", "Field", or "Region".
-
Name Include the name of the entity.
-
Variable value Name the variable in the header row and give the entity’s value for it in its row.
Save the file as a CSV (*.csv) file and load it into Tecplot RS through the Load XY Data dialog.
-
-
Eclipse Data File Containing History Data If you load an Eclipse file with the "Create history data set" control turned on, Tecplot RS will create a data set consisting of all the history data contained in the Eclipse file. This way, you can use the file to compare simulation data to history data when using the history match feature in your reservoir model.
Tecplot RS creates and reads this history data set from the Eclipse file; it does not require the creation of a new data file. If you save data loaded with a created history data set as a project, Tecplot RS will re-create the history data set when you re-open the project.
-
ASCII Data File You can create an ASCII file of your history data (wells only). For more information on how to build this file, see Generic ASCII Files.
After you load your data, a good way to compare your simulator data with the history data is to use the History Match plot type.
Additional Information about XY Data
Please note the following points regarding XY Data:
-
Undefined Values Tecplot RS recognizes -999999 as an undefined value. Data points with a value of -999999 are treated as zero when plotted and ignored during any routine that uses minimum or maximum values.
-
Online Variable For XY data with field data, Tecplot RS creates a variable called ONLINE. The ONLINE variable stores a count of all wells that have OPR (or any appropriate alias) greater than zero at a given time step.
Managing XY Data
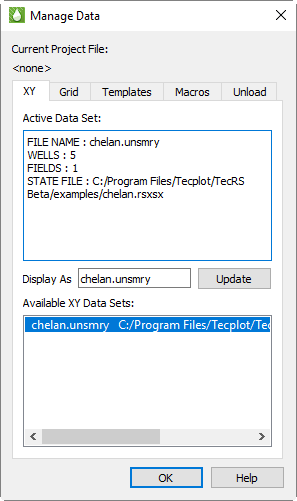
If you load a single data file, that file will display as the Active Data Set. Otherwise, the first file you selected of multiple files will display as the Active Data Set. You can manage your currently loaded data sets by clicking the Manage Data button in the toolbar, or choosing from the menu. Switch to the XY page of the Manage Data dialog to manage XY data sets.
XY Data Settings
The XY page of the Manage Data dialog offers the following options:
-
Display As (Optional) After loading your data file(s), you can use the Display As text field on the XY page of the Manage Data dialog to designate a display name for the Active data set. The display name will display instead of the file name in your plots. The file name will display if the Display As field contains no name.
| You must click the Update button to save your changes to the Display As field. |
-
Available Data Sets The available data set area displays information about the number of wells, groups, and other related information. To change active data sets on the XY page of the Manage Data dialog, choose the desired file name in the "Available Data Sets" region of the dialog. This will highlight the Active Data Set in the "Available Data Sets" list.
Unloading Data Files
Use the Unload page of the Manage Data dialog to unload data files from Tecplot RS. To conserve memory you can selectively unload data. Choose the files to unload and click the Unload Highlighted Files button.
| If you unload a file that acts as part of an XY Freestyle Plots plot, Tecplot RS will delete any line mappings from the data file from the plot(s). |
Swapping Data Files
You can exchange any loaded data file for another by using the Swap Files dialog, accessible from . This is particularly useful for plots in the Bookmark Gallery and for XY Freestyle Plots plots, which are tied to a specific data set. For complete information on using this dialog, see Swapping Data Files.
Exporting Quick Plot Data
You can export the XY data for any of the "quick" XY plot frames to a CSV or RS-Formatted Generic ASCII File by selecting "Export Quick Plot Data" from the "Data" menu. There are 5 quick plot formats available for export.
Cross Plot
Choose "Cross plot" to export a CSV data file of the currently displayed Cross Plots frame. Selecting this option is equivalent to clicking the "Export CSV" button on the Cross plot settings dialog. This option is available in 2D or 3D if the cross plot toggle on the sidebar is enabled.
Depth
Choose "Depth" to export an RS-formatted XY datafile of the Depth quick frame. This option is available in 3D if the "Depth" toggle is enabled on the 3D sidebar and the probe type for the quick plot is CELL. The exported data file is in RS Generic ASCII format and can be loaded into RS by clicking the "Load XY data" toolbar button.
Histogram
Choose "Histogram" to export a CSV data file of the currently displayed Histogram plot frame. Selecting this option is equivalent to clicking the "Export CSV" button on the Histogram settings dialog. This option is available in 2D or 3D if the "Histogram" on the sidebar is enabled.
Time/History
Choose "Time / History" to export an RS-formatted XY datafile of the Time/History quick frame. This option is available in 3D if the "Time / History" toggle is enabled on the 3D sidebar and the probe type for the quick plot is CELL. The exported data file is in RS Generic ASCII format and can be loaded into RS by clicking the "Load XY data" toolbar button.
Well Path
Choose "Well Path" to export an RS-formatted XY datafile of the Well Path quick frame. This option is available in 3D if the "Well Path" toggle is enabled on the 3D sidebar. The exported data file is in RS Generic Ascii format and can be loaded into RS by clicking the "Load XY data" toolbar button.
Writing XY Data
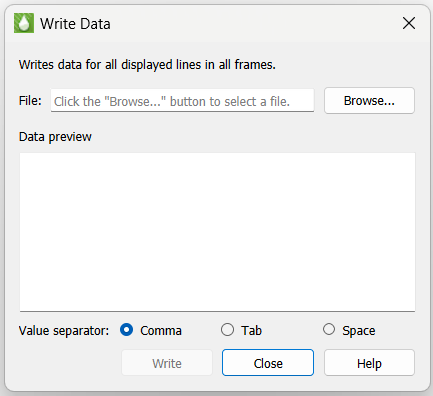
By choosing from the menu, you can create an ASCII text file containing data from the displayed XY plots. Values in this file may be separated by commas, tabs, or spaces. This option will be available only when the current plot is an XY line plot. The "Write Data" dialog is displayed when you select from the menu.
On the "Write Data" dialog, start by clicking the Browse… button to specify an output file. This will display a standard file open dialog from which you can either choose an existing file or provide the name of a new one. If the specified file exists, you will be given the option of overwriting it or appending to it.
| The Write button is not available until you have specified an output filename with the Browse… button. |
Once you have selected a filename, be sure that your XY plot is displaying data. All values of variables shown in all frames of your current plot will be exported to the specified file. What you see in the plot screen is what will be written to the file, so use the sidebar options to choose variables, entities, comparison options, delta computations, etc.
You can also choose the data value separator. Commas are typically the vest choice, particularly if you intend to load the data into Excel or other spreadsheet applications. Tab and space are other options.
Click the Write button to write or append the XY data to the specified file name. The data that was written will appear in the Write Data dialog as well as being written to the file.
You can continue to append to the selected file by choosing additional plots to be displayed and clicking Write again. You can also open a different file at any time and begin writing or appending to it.
Column Sequential
In column sequential format, the first column will be the x-axis variable. Subsequent columns will consist of the selected entities followed by the selected Y-axis variable. Typically the X-axis variable is the DATE variable, but this is not required.
| This option is only available in the “XY Entities” view type. |
Row Sequential
In row sequential format, each selected entity is output in a two-column section. The first column is the X-axis variable, the second column is the selected Y-axis variable.
| If there is no data that can be written due to the current sidebar selection, the Write button will be disabled. Hover the mouse over the Write button for more information regarding why the Write button is disabled. Many controls in Tecplot RS provide this information when disabled. |
Aligning Start Times
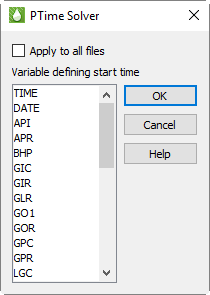
XY plots are often generated with a date or time variable on the X-axis so that you can see the value of variables over time for one or more entities, such as wells. It is often convenient to align the date or time that entities started production so that you can see how they compare to each other over their lifetimes. However, creating the plot with a date or time variable on the X-axis will show the production curve of each entity at the date or time it actually started production.
To align the start time of the entities, use the "Solve pTime" command on the menu and select a production variable, such as OPR, that becomes non-zero when a well or other entity begins production. A new variable called "PTIME" (for Production Time) is created that represents the time since an entity began production. You may then use this variable on the X-axis to produce a plot in which the start times of the selected entities are aligned.
Common Controls
You can choose from a variety of XY plot types and plot customization choices to achieve your desired plot display. Explore the buttons in the sidebar and the menu for the bulk of plot customizations.
Common Sidebar Controls
Each XY plot type includes the following controls in the Plot Controls sidebar:
-
Drawing Layers Use any combination of the Lines and Symbols toggles to adjust an XY plot.
-
Reload Click the Reload button at any time to refresh your data set.
The Reload option is available only if "Enable reload" was toggled-on in the Load XY Data dialog during the file loading process. See Loading XY Data for more information. -
Filter To manage the entities, such as wells, groups, and fields, shown in the Entities list, use the Filter button. Refer to Filtering for more information.
-
Expanded List button Whenever you see the Plus button,
 next to a list in the
sidebar or a dialog, you can click this button to open an expanded
version of the list contents. To find an item in the list more easily,
you can type letters in the Filter field at the top of the list. Only
items that include those letters in that order will appear in the
expanded list. For example, to display only items with the word "well"
in their name, type "well" into the Filter field.
next to a list in the
sidebar or a dialog, you can click this button to open an expanded
version of the list contents. To find an item in the list more easily,
you can type letters in the Filter field at the top of the list. Only
items that include those letters in that order will appear in the
expanded list. For example, to display only items with the word "well"
in their name, type "well" into the Filter field.
Common Axes Controls
You can customize most cosmetic aspects of your plot display by using the Plot Options dialog. To open this dialog, choose from the menu.
Tecplot RS supports time and date axis formatting for XY Line plots. When "Time" or "Date" is selected as a variable in the sidebar, the appropriate axis will display with Time (Days) or Date (Years) formatting. You can customize the date or time format using the Load/Save page of the Plot Options dialog.
For more information on the Plot Options dialog, and other methods of customizing your plot display, see Plot Options.
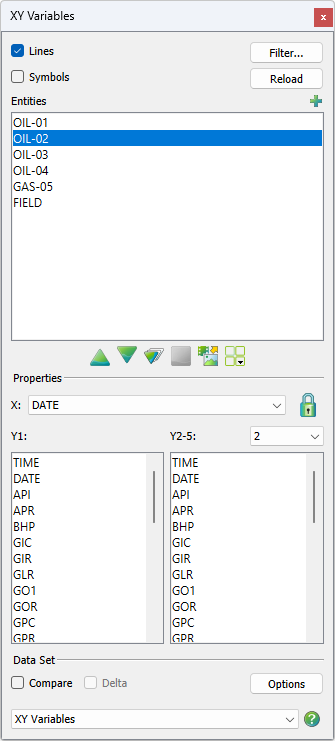
XY Variables
An XY Variables plot depicts a single x-axis (independent) variable with up to five y-axis (dependent) variables. The axis variable selections applies to all entities. To create an XY variable plot, load an XY data file and choose "XY Variables" from the Plot Type menu in the sidebar.
|
|
The sidebar for XY Variable plots has the following options:
-
Lines and Symbols Use any combination of the Lines and Symbols controls to customize whether to display lines and/or symbols for each line in your XY plot.
-
Reload Click the Reload button at any time to refresh your data set.
| The Reload control is available only if "Enable Reload" was selected in the Load XY Data dialog during the file loading process. Refer to Loading XY Data for additional information. |
-
Filter To manage the entities shown in the list, use the Filter button. Refer to Filtering for more information.
-
Entities The Entities box allows you to select wells and other structures to display. Use the scrolling tools (< or >) to move through the entity list. See Paging: Animation and Scrolling Controls for additional information. To select a specific entity from a long list of entities, click the
button in the upper-right corner of the Entities box. This will launch
an expanded entity list that you can filter to find an entity.The variables highlighted in the Variables section of the sidebar will display for the selected Entity.
When you have multiple frames displayed, the selected entity displays in the first frame, and subsequent entities display in subsequent frames.
-
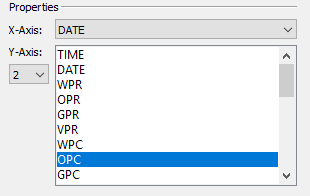
Variables Use the Variables section of the sidebar to specify the axes variable assignments.
-
X-axis Use the X menu to choose the X-axis variable. Tecplot RS allows only one variable displayed at a time for the X-axis.
-
Y1-axis The Y1 box allows you to select multiple variables for Tecplot RS to plot against the Y1-axis. When plotting multiple variables with different value ranges or units, try using two or more Y-axes with different scales.
-
Y2-5 Axes Use the Y2-5 menu to specify for which of the available axes you wish to customize the variables. When no variables are selected for an axis, that axis does not display. To deselect a variable, hold down the Ctrl key while clicking on the appropriate variable. Remember, a single variable cannot display on more than one Y-axis.
-
|
To make multiple selections in a box, use any of the following methods: To choose two or more consecutive items Drag your pointer from the first item you wish highlighted to the last item, or click the first one and hold down the Shift key while clicking the last item. To choose two or more non-consecutive items Hold down the Ctrl key and click the desired items. To un-select a single item Use Ctrl+Left-Click. |
-
Zoom Lock The lock icon next to the X menu can be engaged to hold the active frame’s X-axis range when switching the Entity selection on the sidebar. It is disengaged automatically when the X-axis variable is changed.
Data Set The Data Set region of the sidebar allows you to compare data when you have multiple data files loaded. Refer to Comparing XY Data for additional information.
Frame Selection Mode Button
Click the Frame Selection Mode button to change how Entities are assigned to each frame in a multi-frame plot. In a multi-frame plot, clicking the Frame Selection Mode button will show a menu with two available options:
-
Sequential This is the default mode in all previous versions of Tecplot RS. Frames are assigned entities starting in the top left frame with the current selection. Entities for additional frames are assigned in sequence from the Entities selected on the sidebar. Clicking the Next button will show the next set of N Entities, where N is the number of multi-frames displayed.
-
Manual In Manual mode, each frame in a multi-frame plot can be assigned an Entity irrespective of the Entity selected on the sidebar. Entities for a frame can be selected by clicking on the frame and clicking on an entity on the sidebar, or right-clicking on a frame or frame title and selecting an Entity from the context menu.
In Manual Frame Mode, the animation buttons are disabled since there is no default set of additional frames as there are in Sequential mode. The export button will only show static images available to export.
If the plot is a single frame, then the Frame Selection Mode button menu will not be available, although you can right click on the frame or frame title to select a new entity for the single frame, in addition to clicking the entity on the sidebar.
XY Entities
An XY Entity plot depicts a set of entities for a single X-axis and Y-axis variable pair. For example, you can compare oil production for a selected set of wells in one plot.

|
|
| For all XY Entities plots (including RFT), if XY fracture data is detected, the fracture data will display in a separate dotted line below the matrix data. XY fracture data is detected if the number of XY points is exactly twice the grid K dimension, or if an MFTAG variable is found when reading RFT data. |
To create an XY Entities plot, load an XY data file and choose "XY Entities" from the Pot Type menu at the bottom of the sidebar.
The sidebar for XY Entity plots has the following options:
-
Lines and Symbols Use the Lines and Symbols controls to customize your XY plot.
-
Reload Click the Reload button at any time to refresh your data set.
| The Reload control works only if "Enable Reload" was selected on the Load XY Data dialog during the file loading process. Refer to Loading XY Data for additional information. |
-
Filter To manage the entities shown in the list, use the Filter button. Refer to Filtering for more information.
-
Variables Use the Variables section of the sidebar to specify the axes variable assignments.
-
X-axis Use the X menu to choose the X-axis variable. You can choose only one X-axis variable.
-
Y-axis Use the Y-axis box to choose a Y-axis variable. You can choose only one Y-axis variable.
-
-
Zoom Lock The lock icon next to the X menu can be engaged to hold the active frame’s X-axis range (zoom) when switching to XY Subsets or XY Variables plots. It is disengaged automatically when the X-axis variable is changed.
-
Scrolling Use the animation control buttons to scroll through the available Y-axis variables. See Paging: Animation and Scrolling Controls for additional information.
-
Entities The Entities box allows you to select wells and other structures to display.
-
Sum Toggling-on "Sum" allows you to sum the variable being plotted for all entities that have been chosen.
-
Avg Toggle-on "Avg" to show the average value for all chosen entities.
-
Ignore 0 Values When displaying averages, toggle-on to ignore zero values.
When you have either Sum or Avg toggled-on, Tecplot RS cannot display comparison data. See Comparing XY Data. The variables selected in the Variables section of the sidebar will display for the selected Entity. Click the
button to launch an expanded, searchable entity list. This helps for long
lists. When you have multiple frames displayed, the selected Y-axis variable
displays in the first frame, with subsequent variables in subsequent frames.
-
-
Data Set The Data Set region of the dialog allows you to compare data when you have multiple data files loaded. Refer to Comparing XY Data for additional information.
The settings for "Entity [1-9]" in your RS Variables Files file determines the default styles (for example, line color, and symbol shape) that your plot displays. You can change any of the default styles by either updating the file or changing the settings for "Entity [1-9]" (long variable names) or "ST [1-9]" (short variable names) on the XY Lines page of the Plot Options dialog. Double-click on the line in your plot to bring up the appropriate page of the dialog.
Frame Selection Mode Button
Click the Frame Selection Mode button to change how Variables are assigned to each frame in a multi-frame plot. In a multi-frame plot, clicking the Frame Selection Mode button will show a menu with two available options:
-
Sequential This is the default mode in all previous versions of Tecplot RS. Frames are assigned variables starting in the top left frame with the current selection. Variables for additional frames are assigned in sequence from the variables selected on the sidebar. Clicking the Next button will show the next set of N variables, where N is the number of multi-frames displayed.
-
Manual In manual mode, each frame in a multi-frame plot can be assigned a variable irrespective of the variable selected on the sidebar. Entities for a frame can be selected by clicking on the frame and clicking on a variable on the sidebar, or right-clicking on a frame or frame title and selecting a variable from the context menu.
In Manual Frame Mode, the animation buttons are disabled since there is no default set of additional frames as there are in Sequential mode. The export button will only show static images available to export.
If the plot is a single frame, then the Frame Selection Mode button menu will not be available, although you can right click on the frame or frame title to select a new variable for the single frame, in addition to clicking the entity on the sidebar.
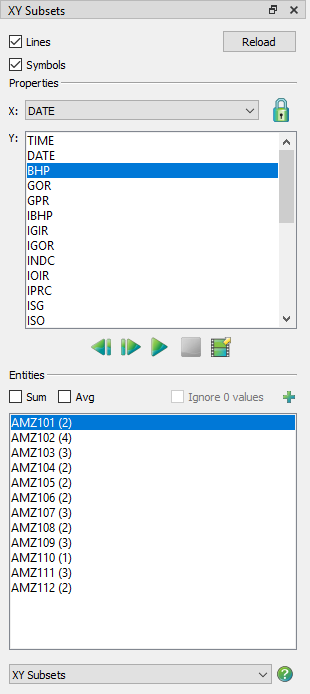
XY Subsets
The XY Subsets plot type allows you to view all of the components of a single well, user group or branch at one time (for a single variable). It is available for data sets that contain entities with subsets, such as completions, segments, branches and user groups. Completion and segment data depend on the simulator output. You can create User Groups, Well Patterns, and Branches using the User Group/Branch dialog (accessed via the menu).
|
|
In an XY Subset plot, you can view information for one entity at a time. When you select the entity, a plot line is created for each component of the entity.
The sidebar for XY Subset plots has the following options:
-
Lines and Symbols Use the Lines and Symbols controls to customize your XY plot.
-
Reload Click the Reload button at any time to refresh your data set.
| The Reload control is available only if "Enable Reload" was selected on the Load XY Data dialog during the file loading process. Refer to Paging: Animation and Scrolling Controls for additional information. |
-
Variables Use the Variables section of the sidebar to choose axes variable assignments, by clicking on a variable.
-
X-axis Use the X menu to choose the X-axis variable. You are limited to a single selection.
-
Y-axis Use the Y box to choose a Y-axis variable. You are limited to a single selection.
-
-
Zoom Lock The lock icon next to the X menu can be engaged to hold the active frame’s X-axis range (zoom) when switching to XY Variables or XY Entities plots. It is disengaged automatically when the X-axis variable is changed.
-
Scrolling Use the animation control buttons to scroll through the available Y-axis variables. See Paging: Animation and Scrolling Controls for additional information.
-
Entities The Entities region of the sidebar displays the available wells, user groups and branches. The number in parentheses after the well name indicates the number of completions and/or segments included in the well.
-
Sum Toggle-on "Sum" to sum the currently plotted variable plotted for all chosen entities.
-
Avg Toggle-on "Avg" to show the average value for all selected entities.
-
Ignore 0 Values When displaying averages, toggle-on to ignore zero values.
-
The variables selected in the Variables region of the sidebar will display
for the selected Entity. Click the
button to launch an expanded, searchable entity list. This helps for long
lists. When you have multiple frames displayed, the selected entity displays
in the first frame, and subsequent entities in subsequent frames.
Use the scrolling tools (< or >) to move through the entity list. Tecplot RS will plot the same set of variables for each entity. See Paging: Animation and Scrolling Controls for additional information.
XY Freestyle Plots
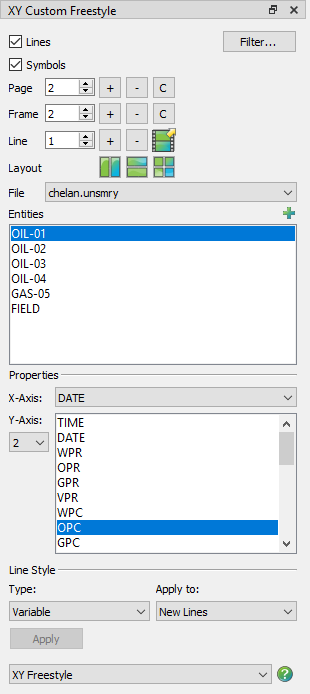
Compared to the other XY plot types, the XY Freestyle plot type provides greater control over the style and content of your plot. It allows you to create multi-page, multi-frame output, where each frame can contain a unique plot.
For each line map within a frame, you can choose the data file, entity, X-axis and Y-axis variables, Y-axis number, and plot style. For example, you can create a page containing two frames, with the first frame containing content similar to an XY Variables plot and the second frame containing content similar to an XY Entities plot. Within each of those frames, you can manually override the style settings of each line map. However, because of its flexibility, XY Freestyle cannot offer the same level of automation and animation features that other XY plot types can.
The XY Freestyle plot allows plotting entity and variable combinations not possible in other XY plot types. For example, in this plot type, you can plot oil production rate for a group of wells, and include a line map of water injection rate for an associated injector in the same plot.
This plot type also functions well when you would like to compare entities or variables between two or more data files that have different entity or variable names. This often occurs when comparing simulator results and observed data. If the entity or variable names are identical between the files, you may instead want to use the "Compare" toggle in the sidebar for XY Variables or XY Entities plot types (refer to Comparing XY Data for details).
Each XY Freestyle line plot is tied to a particular data set. If you have created complex plots in XY Freestyle and wish to change the referenced file, you can do so using . See Swapping Data Files for further details.
| In general, the steps to create XY Freestyle plots are NOT recorded in a macro. Only the plot type and page number are recorded. We strongly recommend that macro recording be turned off during creation of the XY Freestyle plots. |
Creating an XY Freestyle Plot
To create an XY Freestyle plot, follow this general procedure:
-
First, load one or more XY data files (refer to Loading XY Data).
-
If you wish to use multiple frames on a single page, we recommend that you first visit the Multi-Frame Options dialog (accessed with the
 button in the
sidebar) to set the default frame layout for new pages. You do not have to
do this; XY Freestyle has its own frame manager to allow you to create
different frame layouts for each page. However, the options in the
Multi-Frame dialog control the initial frame count and layout for each new
page of freestyle plots. You will be able change those easily.
button in the
sidebar) to set the default frame layout for new pages. You do not have to
do this; XY Freestyle has its own frame manager to allow you to create
different frame layouts for each page. However, the options in the
Multi-Frame dialog control the initial frame count and layout for each new
page of freestyle plots. You will be able change those easily. -
In general, if you are currently recording a macro, stop. Most steps to create XY Freestyle plots are not recorded in macros; only the plot type and page number are recorded. (Don’t worry: you will still be able to return to any XY Freestyle plot you created as long as you have saved your project file.) Most of the time we recommend that macro recording be turned off when creating XY Freestyle plots. The exception would be if you want to record a macro that, for example, displays each XY Freestyle page in turn and then prints it.
-
Choose from the menu or the sidebar.
-
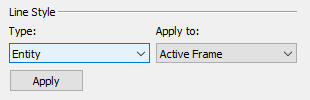
Before adding line mapping(s) to the first frame in your plot, check the Type menu in the Line Style region of the sidebar. This region of the dialog allows you to specify how the initial line style is controlled.
Make any changes necessary here before proceeding:
-
Variable If you plan to plot multiple variables for the same entity (similar to an XY Variables plot), choose "Variable" from the Type menu. In this case, Tecplot RS will read the initial style settings for each variable from the settings for that variable on the XY Lines page of the Plot Options dialog.
-
Entity Otherwise, if you plan to display the same variable for multiple entities (similar to an XY Entities plot), choose "Entity" from the Type menu. In this case, Tecplot RS will read the initial style settings for each entity from the settings for that entity on the XY Lines page of the Plot Options dialog. The settings for a given entity display when "Entity *" (long variable names) or "ST*" (short variable names) is selected in the Variable region of the dialog. Entity 1/ST1 corresponds to the first entity in your plot, and so forth.
-
-
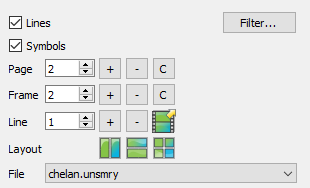
Decide how many frames you want displayed on the current page. You may have a different number and layout for each page, and you can change both the number and arrangement at any time. To start, click the
button next to the Frame
counter until you get the desired number of frames. Then, choose one of
the layout buttons to arrange the frames. Finally, choose the frame you
want to edit by either clicking on it with the mouse pointer or using the
spin control to choose the frame number. -
If you loaded more than one XY data file, choose the source file for your first mapping from the File menu in the sidebar.
This action populates the Entities list, below, with the entities belonging to the chosen data set.
-
Select the entity for your mapping in the Entities box. To select a specific entity from a long list of entities, click the
button in the upper-right
corner of the Entities box to launch an expanded, searchable entity list.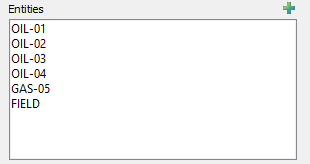
This action populates the Variables list, below, with those variables associated with the chosen entity type.
-
In the Variables region of the sidebar, choose the X-axis variable and Y-axis variable. Use the Axis menu to choose the axis number to use for the Y-axis variable.
-
Refer to Customizing the Line Styles for XY Freestyle for information on changing the style settings for each line mapping.
-
To add additional lines to your plot, click the + button next to Line in the sidebar and repeat steps 6 through 9 for each line.
-
To add more frames to your plot, use the +/- buttons next to "Frame" in the sidebar. Refer to Working With Multiple Pages, Frames and Mappings for details.
-
To add more pages to your plot, use the +/- buttons next to "Page" in the sidebar.
When you create a new page, Tecplot RS will arrange blank frames according to the settings in the Multi-Frame Options dialog. -
To save your XY Freestyle plot(s), you must create a project file. Projects contain XML instructions that define the set of XY Freestyle plots. Your re-loaded project file will include all your XY Freestyle plots, which you can then view and/or modify.
Customizing the Line Styles for XY Freestyle
The style of a given line is determined by its settings for both the line and its symbols. The available line styles include color, pattern, length and thickness. The available symbol styles include shape, size, spacing, color and fill-type.
You can customize the styles using either the Plot Options dialog (linked to RS Variables Files) or the Mapping Style dialog. The scope of the style changes depends upon the method used. When you save the style file, you make any changes made in the Plot Options dialog for a given variable or entity available for future sessions of Tecplot RS. Changes made in the Mapping Style dialog apply to the current line only. You can only use the Mapping Style dialog with the XY Freestyle plot type.
Changing Line Styles With the Plot Options Dialog and the Sidebar
When adding a line to your plot, the style of the line depends upon your selection in the Type menu in the Line Style region of the XY Freestyle sidebar. With "Variable" selected, Tecplot RS will use the settings for each variable on the XY Lines page of the Plot Options dialog for each variable’s initial style settings. With "Entity" selected, the initial style settings for each entity will be taken from the settings for that entity on the page of the dialog. The settings for a given entity are displayed when "Entity *" (long variable names) or "ST*" short variable names) is selected in the Variable region of the dialog. Entity 1/ST1 corresponds to the first entity in your plot and so forth.
You can change the default settings for variables and entities at any time on the page of the Plot Options dialog. If you would like to apply any changes to your current mappings, you will need to re-apply them with the Line Style: Apply To option in the sidebar.
You can use the Line Style: Apply To menu to switch between the "Variable" and "Entity" types at any time. You have the option to change the style settings for:
-
New Lines Select "New Lines" to apply new style definitions to new line mapping(s).
-
Current Lines Select "Current Lines" to apply new style definitions to the line mapping(s) you have selected with your pointer.
-
Active Frame Select "Active Frame" to apply new style definitions to all of the lines in the active frame.
-
All Frames Select "All Frames" to apply new style definitions to all of the lines in all of the frames on the current page.
For example, if you apply the Entity style to new lines, and then determine that the Variable option would be a better choice, you can update the line to use the new style using the following steps:
-
Select "Entity" from the Type menu in the "Line Style" region of the sidebar.
-
In the Apply to box, select the lines to which you wish the changes to be applied.
-
Click the Apply button.
Changing Line Styles With the Mapping Style Dialog
When using the XY Freestyle plot type, you can also modify lines in your plot by using the Mapping Style dialog. Use the Lines and Symbols pages of the Mapping Style dialog to customize the line or symbol style of the selected line. Use the Definitions page of the dialog to specify whether to include each line in the legend.
Technically, the lines and symbols together create a map - thus, you can display a map of a relationship between a dependent and independent variable showing only symbols, only a line, or both. In the Mapping Style dialog, the first page (the Definitions page) controls both lines and symbols for each mapping. The Lines page controls only the line element of each mapping, and the Symbols page controls only the symbols of each mapping.
To open the dialog, double-click on a line (mapping) in your plot. To change an attribute, right-click on the attribute you wish to change. You can select and edit multiple lines/mappings simultaneously by dragging your pointer over them to select them and then right-clicking on the column you wish to change.
| Right-Click on the attribute you wish to change, and choose the option you wish displayed from the context menu. |
The Definitions Page
On the Definitions page of the Mapping Style dialog, you can modify map names, activate and deactivate maps (both lines and symbols), assign axis variables, sort data points, control the maps' appearance in the line plot legend, and assign particular X and Y axes to a line.
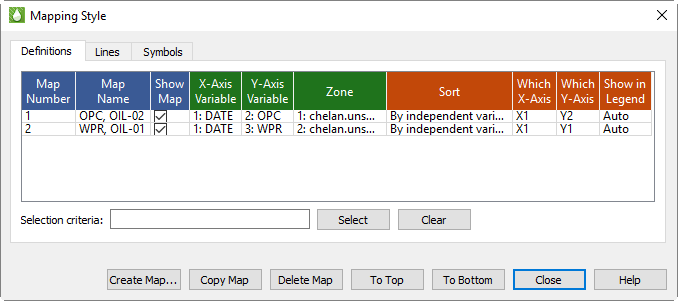
The Definitions page of the dialog includes the following controls.
-
Map Num Tecplot RS uses this number to identify the maps. You cannot edit this indicator of the line order.
-
Map Name Double-Click on the name of a mapping to edit its name.
By default, Tecplot RS assigns a name to each map that varies with the type of data used to create the line. Tecplot RS usually bases this name on the dependent variable chosen for the map. You can also construct a name by entering text combined with one or more pre-defined dynamic options:
-
Zone Name Add &ZN& to the Map Name field to include the name of the zone assigned to that map.
-
Zone Number Add &Z#& to the Map Name field to include the zone number assigned to that map.
-
Independent Variable Add &IV& to the Map Name field to include the name of the independent variable assigned to that map.
-
Independent Variable Number Add &I#& to the Map Name field to include the number of the independent variable assigned to the map.
-
Dependent Variable Add &DV& to the Map Name field to include the name of the dependent variable assigned to the map.
-
Dependent Variable Number Add &D#& to the Map Name field to include the number of the dependent variable assigned to the map.
-
Map Number Add &M#& to the Map Name field to include the number of the map.
-
X-Axis Number Add &X#& to the Map Name field to include the number of the X-axis assigned to that map.
-
Y-Axis Number Add &Y#& to the Map Name field to include the number of the Y-axis assigned to that map.
-
| In addition to the above items, any dynamic text item can be added to the Map Name field. See Dynamic Text for more information on dynamic text. |
-
Map Show You can choose whether to display each map (both lines and symbols) by toggling this control on or off. You can turn on or off multiple maps by dragging to select them and then toggling on or off one of the selected lines.
-
X Axis Variable Right-Click and choose "Select Variable" to change the X-axis variable for the selected map(s). Choose the variable in the dialog that appears.
-
Y Axis Variable Right-Click and choose "Select Variable" to change the Y-axis variable for the selected map(s). Choose the variable in the dialog that appears.
-
Zone Each map uses variable values from its zone in the data file. You cannot edit the zone.
-
Sort By default, Tecplot RS sorts each map data points by the order in which they occur in the data file. You can change this order with the Sort control on the Definitions page:
-
By Independent Variable Choose this option to sort data points in ascending order of the values of the independent variable.
-
By Dependent Variable Choose this option to sort data points in ascending order of the values of the dependent variable.
-
-
Which X-Axis, Which Y-Axis XY freestyle mapping (line) plots support five X-axes (X1-X5) and five Y-axes (Y1-Y5). Newly created maps use the X1 and Y1 axes. You can change these assignments using the Which X-Axis and Which Y-Axis controls on the Definitions page of the Mapping Style dialog.
The controls of the ranges and scales for each axis appear on the XY Axes page of the Plot Options dialog.
By default, the X1 axis displays at the bottom of the axis grid area, and subsequent X axes display at the top. Similarly, the Y1 axis displays by default on the left side of the axis grid area, and subsequent Y axes display at the right.
You can also use multiple axes to cycle through maps with different ranges or axis settings. You may find it convenient to assign different maps to different axes so that you can set axis ranges, positions, or other attributes independently for each map.
-
Show in Legend By default, all shown maps appear in the map legend. However, the legend only lists maps with identical entries once. With this control, you can choose to display a map in the legend always, never, or only when shown.
-
Always If a map has "Always" chosen in this control, the map appears in the legend even when turned off or when its configuration looks exactly like another map.
-
Never If a map has "Never" chosen, the map will never appear in the legend.
-
Auto Choose the "Auto" option to instruct Tecplot RS to show the mapping in the legend only when the map is shown. If two maps would result in the same legend, Tecplot RS will show only one of them.
-
The Lines Page
When the Line layer is toggled-on in the sidebar, all mappings in an XY Freestyle plot display as a line connecting each data point in each mapping (set of chosen independent and dependent variables). On the Lines page of the Mapping Style dialog (accessible by double-clicking any line in your XY Freestyle plot), you can adjust the appearance of the lines in your plot.
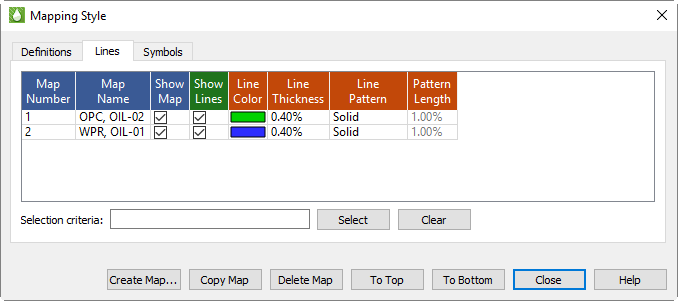
The first two columns on this page replicate the first two columns on The Definitions Page Page of the dialog. These columns list the number and name for each map. The remaining columns on the Lines page of the dialog contain specific line attribute settings.
| In order to make changes on the Lines page of the dialog, or for those changes to display in your plot, you must have the Lines layer toggled-on in the sidebar. |
To adjust any of these controls, right-click on the attribute you wish to change to access the context menu.
-
Line Show This control allows you to turn off lines for selected mappings, while keeping the mapping active (symbols can still display).
-
Line Color Use this column to change the display color of a line.
-
Line Pattern Use this column to customize the line pattern displayed for a mapping.
-
Pattern Length Set the pattern length for patterned lines with this control. Tecplot RS measures pattern length as a percentage of frame height for one cycle of the pattern.
-
Line Thickness Use this control to set the thickness of the selected lines.
The Symbols Page
When the Symbols layer is toggled-on in the sidebar, all mappings in an XY Freestyle plot display with symbols representing each data point in the mapping. (The symbols may or may not be connected by lines, depending on whether the Lines control is toggled on in the sidebar and the settings chosen on the Lines page of the dialog.) On the Symbols page of the Mapping Style dialog (accessible by double-clicking any line in your XY Freestyle plot), you can adjust the appearance of the symbols in your plot.
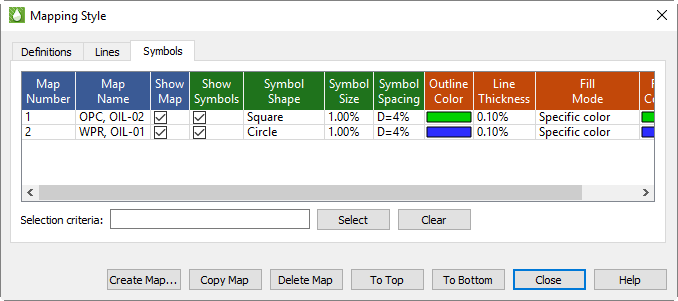
The first two columns on this page replicate the first two columns on The Definitions Page of the dialog. These columns list the number and name for each map. The remaining columns on the Symbols page of the dialog contain specific symbol attribute settings.
| In order to make changes on the Symbols page of the dialog, or for those changes to display in your plot, you must have the Symbols layer toggled-on in the sidebar. |
To adjust any of these symbol controls, right-click on the attribute you wish to change to access the context menu.
-
Show Symbols This Show Symbol control allows you to turn symbols on or off for selected mappings, while keeping the mapping active (lines can still display).
-
Symbol Shape Use this control to choose a symbol shape for each mapping.
-
Outline Color Use this control to assign a color to the outline of the symbol.
-
Fill Mode Choose whether to fill the symbols, and if so, designate the type of filling, with this control. You can choose from:
-
None Choose this option to display unfilled symbols.
-
Use Line Color Choose this option to display symbols filled with the same color as the symbol outline.
-
Use Back Color Choose this option to display symbols filled with the color of the background of the grid area, appearing hollow (thus obscuring any objects behind the symbol, such as grid lines or other mappings).
-
Use Specific Color When you choose this option, the symbols will display filled with the color specified in the Fill Color column.
-
-
Fill Color Use this control to assign a color with which to fill the inside of the symbol. To use this control, Fill Mode must indicate "Use Specific Color".
-
Symbol Size Use this control to specify the size of the symbols. Tecplot RS measures symbol size as a percentage of frame height.
-
Line Thickness Use the Symbol Line Thickness control to indicate the thickness of the lines used to outline the symbols.
-
Symbol Spacing Use the Symbol Spacing control to specify the spacing between symbols. Tecplot RS measures the spacing either as a percentage of frame height or as the number of indexes to skip. You can either enter a value or use a pre-set value:
-
Draw All Choose this option to have all symbols drawn at every data point.
-
I Skip = 2, 3, or 4 Choose this to instruct Tecplot RS to draw symbols at every second, third, or fourth data point.
-
Distance = 1, 2, or 3% Choose this to have symbols at the first data point and then subsequently at data points at least one, two, or three percent of the frame height distant from the previously plotted data point.
-
Enter Index Choose this option to type an index skip between symbols (use for skips other than two, three, or four).
-
Enter Distance Choose this option to type a distance between symbols in frame units (use for distances other than one, two, or three percent of the frame height).
-
Map Creation
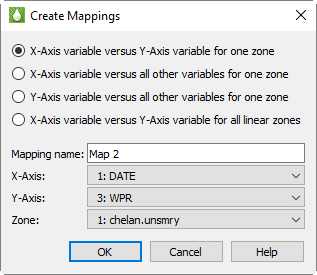
To create a new line with the Mapping Style dialog, click the Create Map button to open the Create Mappings dialog.
The Create Mappings dialog contains the following controls.
-
Type of Line to Create In the first region of the dialog, you can choose which type of line you wish to create.
-
X-axis Var versus Y-axis Var for One Zone (default) Choose this option to create a single line with one X and one Y variable for one zone.
-
X-Axis Var versus Y-Axis Var for All Zones Choose this option to define one line for each zone, with specified X and Y axis variables. If you choose this option, you only need to specify the X and Y axis variables.
-
X-Axis Var versus All Other Variables Choose this option to create a set of lines using one variable as the X variable and each of the other variables as Y variables.
-
Y-Axis Var versus All Other Variables Choose this option to create a set of lines using one variable as the Y variable and each of the other variables as X variables.
-
-
Mapping Name Type a name for the line(s) in the Mapping Name text field. Tecplot RS defaults to "Map n", where n represents the number of mappings it will create.
-
X-Axis, Y-Axis Use these controls to choose the X and Y axis variables for the new line(s).
-
Zone This control designates the zone to which the new line(s) belong. Usually you will not need to adjust this.
Mapping Style Dialog Buttons
Along with the Create Map button, the Mapping Style dialog includes a few other buttons to streamline your workflow.
-
Copy Map Click the Copy Map button to copy an existing, selected map, creating a new, identical map. This may streamline your map creation process, since you can adjust the copied map rather than creating a new one.
-
Delete Map Click the Delete Map button to delete any existing, selected map.
-
To Top Click this button to move a selected map to the top of the list of mappings in the Mapping Style dialog.
-
To Bottom Click this button to move a selected map to the bottom of the list of mappings in the Mapping Style dialog.
Working With Multiple Pages, Frames and Mappings
The XY Freestyle plot type provides you with significant control over the overall layout of your plot(s) with pages and frames. Each page can have a different number of frames, as well as a different configuration of frames (for example, 2 X 3 versus 3 X 2). Similarly, each frame can have a different number of lines.
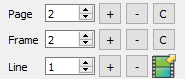
Use the + and - buttons to add or delete Pages, Frames or Lines from your workspace. Use the C button on the page row to remove the lines from every frame on the current page. Similarly, you can use the C button on the frame row to remove all of the lines from the active frame. The image:rs/users-manual/buttons/export.png button provides an automated export (printing, file creation or animation) of all of the pages of your XY Freestyle plot (refer to Printing and Exporting for details).
If you plan to work with multiple frames on every page, we recommend that you first specify the number of frames you would like on the first page using the Multi-Frame Options dialog (accessed with the Manage Frames button in the toolbar) before switching to the XY Freestyle plot type. Tecplot RS uses the settings in the Multi-Frame Options dialog to establish the default number and positioning of the frames on each new page you create in XY Freestyle. However, these are easily changed from within the XY Freestyle sidebar as you work. Frames bay be added or deleted using the + and - Frames buttons, and the frame sizes and arrangements may be altered using the Arrange buttons or by simply moving and resizing the frames with the mouse.