Working with Grid Data
Tecplot RS loads and references data independently of the active frame or plot type, so that you can view one data set in many different ways. Tecplot RS also includes many ways to view and alter your data sets inside the application.
Changes to the data set(s) within Tecplot RS do not affect the original data file(s). You can, however, save modified data to a file by choosing from the menu. In fact, the menu includes several powerful features that we discuss in this section.
Tecplot RS provides several methods for working with your grid data, including:
Data Spreadsheet
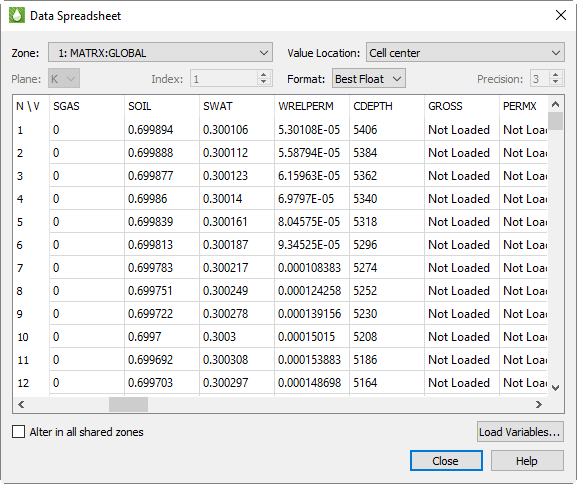
You can view loaded grid data in the Data Spreadsheet dialog by choosing from the menu. In this dialog, you can temporarily edit data, adjust the formatting of the displayed data, copy the data to your operating system’s clipboard, and paste it into another program.
The Data Spreadsheet dialog displays the variables selected in the sidebar. The listed zones represent the main grid and any local grid refinements (LGRs). Some data files may have additional zones. The variable values are listed in the table.
| You must have at least one variable selected in the sidebar in order to open the Data Spreadsheet dialog. |
Value Location
Values in Tecplot RS may be either cell-centered or nodal. The Data Spreadsheet dialog displays only one of these kinds of variables at a time. You may choose which kind is displayed using the Value Location list. If you do not see the variable you want, check this list to make sure it is set correctly.
Loading Variables
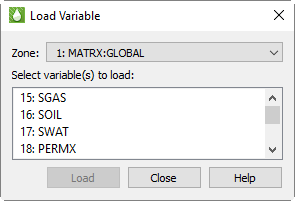
Only variables that are already loaded are shown in the Data Spreadsheet dialog. If you wish to display additional variables, click Load Variables.
In the Load Variable dialog, choose the zone that contains the variables you wish to load, then the variable to be loaded. You may choose more than one variable by holding Shift (to choose a contiguous range) or Control (to toggle individual variables on or off) while clicking.
Because Tecplot RS uses Load On Demand for variable loading, the Load Variable dialog is necessary to view currently unloaded data.
This dialog is useful only with grid data. With XY data, the variables loaded are determined by those selected in the sidebar. You cannot load additional variables using this dialog.
Spreadsheet Formatting
Using the formatting controls at the top of the Data Spreadsheet dialog, you can change the format of the displayed data without changing your data file(s) or the appearance of your plot.
-
Format Choose a number format from the Format menu in the dialog that best represents the data. You can choose from displaying the data in Integer, Float, Exponent, or Best Float form.
-
Precision If you have Float or Exponent chosen as the Format, you can specify the number of places displayed to the right of the decimal.
If some values are too wide to fit in their column, the width of the column may be adjusted by dragging the divider lines in the heading.
Grid Equations
In the Grid Equations dialog, you can create new variables from existing
grid data. Access this dialog by choosing Grid Equations from the
menu. Alternatively, if your current plot is 2D or 3D grid,
you can click the  toolbar button.
With grid equations, you can use equations to create new variables from combinations of existing variables in your data set. Tecplot RS includes the new variables in the list of variables available for plotting. If your new variable definition depends on existing time-dependent data, Tecplot RS re-calculates the variables when the time step changes.
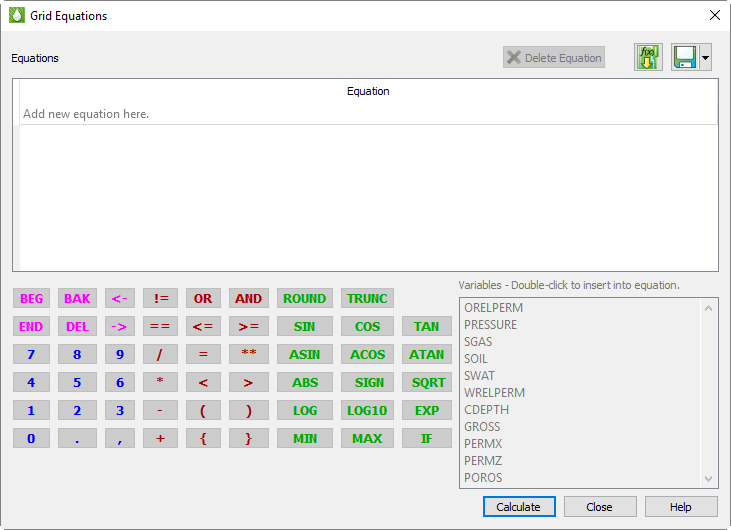
Equations are entered and edited by double clicking on an empty line in the equations table. Once selected, you may enter equations by simply typing them using the keyboard. However, the dialog also provides some handy tools to make the job easier.
First, the variables from the current data set are shown in a list. Double-click one of these to insert it into the equation at the current cursor position. Tecplot RS automatically includes the surrounding curly braces {} that are used to identify a variable.
There are also buttons for frequently-used functions. Clicking these will insert the function name followed by parentheses, and place the cursor inside the parentheses so you can easily insert the value or variable that belongs there. If the function requires multiple parameters, one or more commas will also appear inside the parentheses, alerting you to the required inputs.
The remaining buttons are mostly duplicates of what you have on your keyboard. You can use the keyboard and mouse interchangeably when entering equations. Press the Enter key on your keyboard OR click on the Enter button on the dialog to record an equation.
To make changes to current set of equations, double-click the desired item. You can also use right-click to delete one or more equations that are no longer needed, or by clicking the Delete button. When you double click on the empty line, RS inserts the text "{VARNAMEn}=" into the editing line. This is a starting point for entering a new equation, but its use is optional you can simply type what you need.
Tecplot RS holds XY data in memory. Once a new variable has been created, it remains available during your Tecplot RS session and will be saved if you write your data to Tecplot format.
For a full description of the Tecplot RS equation syntax, see Equation Reference.
Calculating Grid Equations
After you enter an equation, the equation will be automatically checked to be sure the syntax conforms to Tecplot RS requirements and that the variable names referenced are valid. This check works only if you have grid data loaded and a 2D or 3D Grid view displayed.
| After the equation has been checked, it has not yet been applied to the dataset. To run the equation, click the Calculate button. Equations are only applied when you click the Calculate button. |
After entering the equation, the text of the equation is colored as follows:
-
Dark Red: There is a syntax error in the equation. When the mouse is hovered over the equation a tool tip will be displayed showing the position of the syntax error. After editing the equation, you can retype the equation and click Calculate again.
-
Green: The equation has been checked for syntax errors, but it has not yet been applied. Click the Calculate button to apply the equations.
-
Bold Green: The equation has been successfully run and applied.
Grid equations are always saved with a project file, and are automatically applied when you reload the project without any additional action on your part. You can also save or update saved equations in a separate file and reload them later, which you may find useful when sharing equations among projects. Equations are only calculated when you click the Calculate button. If a grid plot type is active, the new variables will also appear in the sidebar variables list when you click the Calculate button.
Integration
Use the menu to calculate integrals with Tecplot RS. See Performing Integrations for information.
Cell Value Blanking
Cell Value Blanking is a powerful tool that lets you turn on or off individual drawing elements (usually cells) according to the values of selected constraint variables. You can add value blanking to your plot with the Value page of the Cell Blanking dialog (accessible by choosing from the menu).
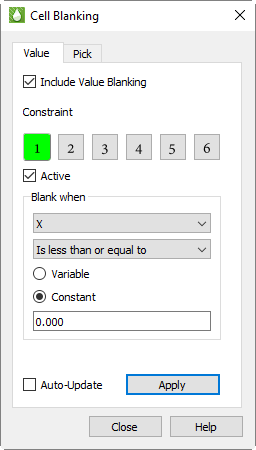
The Value page of the Cell Blanking dialog has the following options:
-
Include Value Blanking Toggle-on to include value blanking.
-
Constraint You can define up to six value blanking constraints.
-
Active Toggle-on "Active" to activate the currently selected constraint.
-
Blank When For each constraint, set the following parameters:
-
Choose the variable to use for value blanking.
-
Choose the comparison criteria.
-
-
Apply Click the Apply button to apply any active blanking constraints to your plot.
-
Auto-Update Toggle-on "Auto-Update" to add any active blanking constraints to your plot automatically as you set their parameters.
| Green highlighting in the value blanking constraint number indicates when a particular constraint is active. This allows a quick profile as to how many constraints are currently active. |
Blanking in Multi-Frame Plots
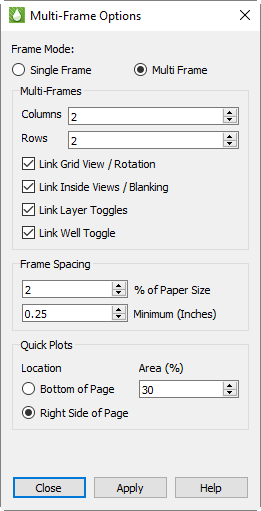
With the value blanking feature, you can blank cells either in Frame 1 or in all frames.
If you have "Link Inside Views/Blanking" turned off in the Multi-Frame Options dialog, value blanking constraints apply only to Frame 1.
Toggling-on "Link Inside Views/Blanking" causes Tecplot RS to apply the value blanking criteria to all frames in your plot.
Pick Blanking
Use the Pick page of the Cell Blanking dialog to interactively remove a cell or group of cells. All functions that allow you to choose visible or unblanked cells will recognize cells blanked by Pick Blanking, including:
-
Statistical Plots to access, choose in the menu.
-
Performing Integrations accessible by choosing from the menu)
-
Property Modifier accessible by going to .
-
Extract Data by Cell dialog accessible by going to
In general, you must blank the cells before choosing one of these functions, or click the Update / Refresh button in the corresponding dialogs after blanking the cells.
To access the Cell Blanking dialog, use the menu or the
 button in the sidebar. The
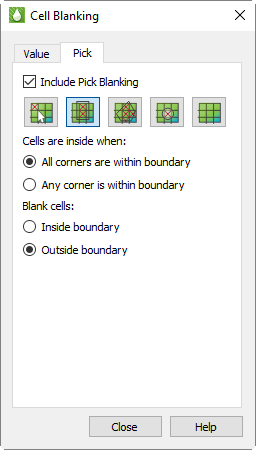
Pick page has the following options:
button in the sidebar. The
Pick page has the following options:
-
Include Pick Blanking Toggle-on "Include Pick Blanking" to activate the pick blanking options and incorporate Pick Blanking into your plot.
-
 Blank Individual Cells
Click this button to use the pointer to select individual cells for
blanking.
Blank Individual Cells
Click this button to use the pointer to select individual cells for
blanking. -
 Blank Cells in a
Rectangle Click this button to identify and blank a rectangular group
of cells. Drag the selector tool in your plot to create the rectangle.
Tecplot RS will blank the cells according to the selected criteria that
displays below this button in the Pick page.
Blank Cells in a
Rectangle Click this button to identify and blank a rectangular group
of cells. Drag the selector tool in your plot to create the rectangle.
Tecplot RS will blank the cells according to the selected criteria that
displays below this button in the Pick page. -
 Blank Cells in a Polygon
Click this button to identify and blank a polygonal group of cells. Use
the left pointer button to define each corner of the polygon. To complete
the polyline when you have created all desired edges, double-click.
Blank Cells in a Polygon
Click this button to identify and blank a polygonal group of cells. Use
the left pointer button to define each corner of the polygon. To complete
the polyline when you have created all desired edges, double-click.
When defining an irregular boundary using a polyline, you can work clockwise or counter-clockwise. You do not need to return to the starting point - Tecplot RS will close the boundary automatically.
Tecplot RS will blank the cells according to the criteria selected below this button on the Pick page.
-
 Blank Cells in a Circle
Click this button to identify and blank a circular group of cells. Your
first pointer click will identify the center of the circle. Drag the
pointer outward to extend the radius of the circle.
Blank Cells in a Circle
Click this button to identify and blank a circular group of cells. Your
first pointer click will identify the center of the circle. Drag the
pointer outward to extend the radius of the circle.
Tecplot RS will blank the cells according to the criteria selected below this button on the Pick page.
-
 Undo Pick Blanking Click this
button to remove all of your pick blanking selections.
Undo Pick Blanking Click this
button to remove all of your pick blanking selections. -
Cells are inside when Specify whether to blank cells when "any" corner is within a boundary or when "all" corners are within a boundary. This criteria applies only to rectangular, polygonal, and circular blanking.
-
Blank cells Specify whether to blank the cells that are "outside" or "inside" of the rectangle, polygon, or circle.
Notes for rectangular or polygonal pick blanking
When working with rectangular, polygonal, or circular pick blanking, the following guidelines apply:
-
The view orientation must be top-down (aerial view), and the cell corners must be in the XYZ coordinate system. This means that in 2D Grid views, the selected view plane must be "K - XY Axes" ("K - IJ Axes" will not work, nor will any of the I or J plane views).
In 3D Grid views, the view must be rotated to the Aerial view. If you click the button for picking cells in rectangular, polygonal, or circular shapes while in a non-aerial view, Tecplot RS will alert you that you must switch to an aerial view and will give you the option to automatically flip to that view. You can also select the appropriate view using .
-
When choosing multiple cells for pick blanking, the hole will "drill" through all K-planes in the grid. This feature works for both 2D and 3D Grid plot types.
KSum, KAvg, and Recovery map
KSum
When activated, the KSum toggle in the sidebar will cause Tecplot RS to sum all the variable values in a column (all cells with matching I and J indexes). If weighting is enabled in the KSum/KAvg Options dialog, the specified weighting variable is multiplied by the grid variable before being added to the total.
| The KSum applies only to the cells visible in the current 3D view. To limit the included layers, use Inside Views or Cell Value Blanking. |
The summed value appears in all cells of that column. Since these data are
typically viewed from the top, Tecplot RS will switch to an aerial view. The
full 3D Grid plot still exists, and you can view it quickly by using the
 (Reset View) button or the
view presets under the menu.
(Reset View) button or the
view presets under the menu.
Cells in LGRs are summed separately from the parent grids, and if the LGR is not visible at the grid surface, you will need to isolate it using an Inside Views selection.
KAvg
When KAvg is toggled-on in the sidebar, Tecplot RS averages the values according to the averaging method selected in the KSum/KAvg Options dialog. If weighting is enabled, the specified weighting variable is multiplied by the grid variable before being included in the average.
| The KAvg applies only to the cells that are visible in the current 3D view. You can limit the included layers using the Inside Views. |
Recovery map
The Recovery Map is a specialized plot that intends to show the amount of fluids in place at one time relative to a reference time. While the standard application is usually for oil or gas in place, RS will perform the computations on whatever transient property you choose to display. If you are displaying a static property, the displayed recovery map values will always be zero.
For example, the gas recovery would be computed as:
'ref' and 'cur' refer to the reference and current (displayed) time steps, respectively. The reference time is usually the first time step, but can be set to any time using the Recovery map Options dialog. The current time is controlled by the time slider on the sidebar.
The sum over layers refers to a single I, J location through all K-plane layers. The summation is performed on visible cells only. Any of the inside views and blanking options limit the computations, for example, K planes 1 through 12.
If the denominator is 0, the resulting value will be 0.
The Recovery Map Options dialog also gives control over the contour legend display. The default range is 0 to 1, but there may be circumstances where negative values exist, the Legend Range can be altered to include them. The Legend Range is limited to values between -1 and 1.
KSum/KAvg Delta
KSum/KAvg delta will compute KSum/KAvg at a reference time step and at the current timestep, and display the delta between the reference time and the current timestep calculations. The reference timestep, delta calculation formula, and the "use magnitude" option can be selected in the KSum/KAvg Delta Options dialog. These options work identically to the same options in the Time Delta dialog.
| When displaying deltas, KSum/KAvg are calculated exactly as they are when "KSum/KAvg" are selected, and will use any settings specified on the KSum/KAvg Options dialog. |
KSum/KAvg Options
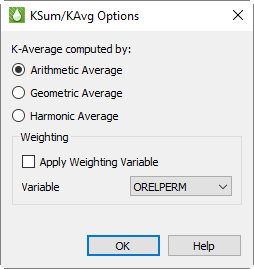
The KSum/KAvg Options dialog (accessed with the … button to the right of the KAvg toggle in the sidebar) allow you to choose the averaging method and also to optionally specify a weighting variable.
| KSum/KAvg options on this dialog apply to both KSum and KAvg. |
Averaging Methods
The following averaging methods are available. The current averaging method appears in the plot title.
-
Arithmetic Average The arithmetic average is computed by taking the total of all values divided by the number of values.
-
Geometric Average The geometric average is computed by multiplying all values together and then taking the the N-th root, where N is the total number of values. The geometric average is typically used when values increase by percentages.
-
Harmonic Average The Harmonic Average is computed by adding the reciprocal of each value ( 1 / Value ), and then dividing the total number of values by this sum.
Weighting Methods
You may choose a weighting variable to be applied to the grid variable at each cell before being incorporated into the sum or average.
For KSum, the value of the weighting variable W is simply multiplied by the grid variable V before being added to the sum, i.e., KSum(VW), the sum of V times W over active K layers for each active I, J.
For KAvg, the method of weighting varies depending on the type of averaging being used, as follows. For geometric and harmonic averages, where V is zero or less, a very small number (specifically, 0.000005) is substituted.
-
Arithmetic
-
Geometric
-
Harmonic
KSum/KAvg Delta Options
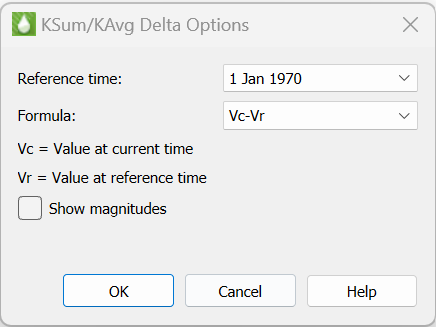
The KSum/KAvg Delta Options dialog (accessed with the … button to the right of the KSum Delta toggle in the sidebar) allows you to choose the reference timestep for KSum/KAvg delta calculations, the delta formula, and whether to use delta magnitudes (absolute value) when displaying delta.
The reference time step, or "Reference Time", is the time step to which Tecplot RS compares each time increment in the delta value formula. This is usually the first time step, but you can choose any time step as the reference time.
Tecplot RS supports several methods of calculating the delta value. Choosing one of the methods from the Formula menu will assign the delta calculation to use that formula. Methods for calculating the delta value include the following, where Vc indicates the variable value at the current time and Vr indicates the variable value at the reference time:
-
Vc-Vr = Variable value at current time minus variable value at reference time (default and previously standard method)
-
Vr-Vc = Variable value at reference time minus variable value at current time
-
(Vr-Vc)/Vr = Value at reference time minus vale at current time, normalized by value at reference time
-
(Vc-Vr)/Vc = Value at current time minus value at reference time, normalized by value at current time
Toggle-on "Show Magnitudes" to use the magnitude (absolute value) of each delta value. This option ignores the direction (+ or -) of the delta value, allowing for greater display resolution.
Restricting K Values
Tecplot RS calculates K Averaging and Summing over all visible K cells. You can restrict the K range using any of the following methods:
-
Value Blanking - refer to Cell Value Blanking.
-
Pick Blanking - refer to Pick Blanking.
-
Inside Views:
-
IJK Slices - refer to IJK Slice.
-
IJK Blanking - refer to IJK Blank.
-
Well Blanking - refer to Well Blank.
-