Comparing XY Data
Comparing data from two or more files often gives useful information or results. For example, you may wish to compare the separate data sets of simulator output and observed values, or multiple simulator runs. Tecplot RS contains several tools that allow you to compare data sets.
| While this chapter focuses on comparing XY data sets, you can also compare grid data. See Comparing Grid Data for details on this feature. |
The method used to compare data sets depends upon both the contents of the data sets and the type of plot you wish to create:
-
Using the Compare Toggle This powerful option serves as the primary method for comparing data files. It allows you to create unique style sets for each file (used when comparing a large number of files simultaneously), delta plots, and a comparison legend. With this option, Tecplot RS plots your comparison data in a single frame.
You can use the Compare toggle for XY Variables, XY Entities, XY Custom Plot and XY Custom Entities plot types. However, to use this option, all of the files must use identical names for each entity you wish to compare. The files must also use identical variable names, unless you link the variable names with an alias, which may be set using the Variables tab on the Plot Options dialog. If your files do not meet the requirements for compared entities and identical/aliased variables, use one of the alternate comparison methods.
-
Comparison Using the XY Freestyle Plot Type Use this option when the entity/variable names in the files you wish to compare do not match and you would like full control over every aspect of your plots. This option allows you to compare data sets in the same frame or in side-by-side frames. Because this option requires manual setup, you may find it requires more time to set up and operate than the other options.
-
Comparison Using the History Match Plot Type: Use the History Match plot type when you wish to compare one set of data (history, or observed, data) with one or more simulation data sets, and/or you wish to use a more quantitative measurement to determine which simulation data set best matches the history data set. This plot type displays three different plot representations of the comparison side-by-side, requires little manual setup, and gives both qualitative and quantitative results.
Each comparison method requires the steps described in Preparing for Comparison. Review these steps before you begin.
You can also compare variable values from different XY data files for the same set of wells using Delta bubbles. Refer to Delta Bubble Plots for details.
Preparing for Comparison
To compare data sets, first load multiple XY data files. If you compare data sets using the sidebar, you also need to specify the active data file. The comparison uses the active data file for reference values.
Active Data Set
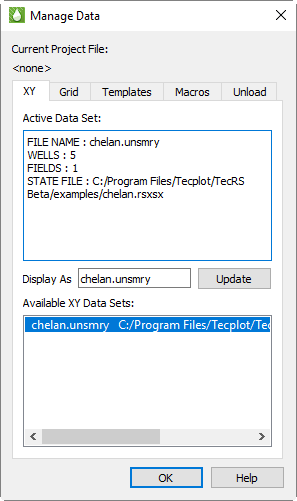
When you load multiple files, only one file functions as the active data set. Tecplot RS will display the active data set by default in all plots and will use it to determine which entities and variables appear in the selection lists. When doing comparisons, Tecplot RS uses the active data set as the data set to which it compares the other files. The Compare Options dialog, accessible by clicking the Options button in the Data Set section of the sidebar, lets you choose the active data set. If you need more information about a data set before choosing it, see instead the XY page of the Manage Data dialog. The active data set appears highlighted. The Active Data Set box lists a summary of the entity types available. |
|
To change the active data set, simply highlight the file name in the Available Data Sets box. The information in the Active Data Set region of the dialog will update accordingly. When you close the Manage Data dialog, the plot and the sidebar will reflect the new active data set. If no data file has been loaded previously, the new data file will be the active set, and each subsequent data file will be treated as an inactive data set. You can change the active data set at any time by selecting a different data set in the Available Data Sets region of the Manage Data dialog.
|
|
Using the Compare Toggle
The simplest approach for comparing data sets is to plot them in a single frame using the Compare toggle in the sidebar. This method is available for the following plot types: XY Variables, XY Entities, RFT Plots, XY Custom Plot or XY Custom Entities.
In order to use this function, you must first have multiple data sets
loaded. To load another data set, choose from the
menu. You can click the
 (Manage Data)
button in the toolbar to customize which data set appears as the active
data set. The active data set will determine which entities and variables
you can select for plotting. In order for the comparison to work, the
additional data sets must have matching entity names.
(Manage Data)
button in the toolbar to customize which data set appears as the active
data set. The active data set will determine which entities and variables
you can select for plotting. In order for the comparison to work, the
additional data sets must have matching entity names.
The Data Set portion of the sidebar for XY Variables and XY Custom Plot includes these controls:
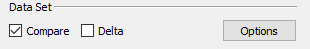
The other XY plot types include a similar Data Set portion of the sidebar, without the Show Deltas option.
Data Set Selection for Comparison
To activate the comparison feature, toggle-on "Compare" in the sidebar. Toggling-on "Compare" will open the Compare Data Sets dialog.
The name of the active data set displays at the top of the dialog, under "Active Data Set". The remaining loaded data sets are displayed in the Select Files for Comparisons box. Select the file or files that you want to include for comparison from the box.
|
|
Comparable Entities and Variables
The list of entities and variables displayed in the sidebar depends upon the active data set. You can customize the list using the Filtering dialog (open this dialog with the Filter button in the sidebar). For example, you can limit the list of entities to just the wells (don’t include completions, areas, or field data).
To compare entities using the Compare toggle in the sidebar, the selected entity names must match exactly across all files. However, you can define some flexibility with variable names using variable aliases. For example, if the active file uses OPR for oil production rate (typical for Eclipse/SLB files) and a comparison file uses QOP (VIP standard), you can tell Tecplot RS that QOP is an alias for OPR. Aliases are entered using the Variables page in the Plot Options dialog; see Variables.
| If your data files use different variable names or aliases, you can still compare your data using the XY Freestyle plot; see Comparison Using the XY Freestyle Plot Type. |
You can edit the Master Variables List to expand the list of variable aliases.
| Comparison data display is not compatible with the Sum or Avg toggle in XY Entities. When the Sum or Avg toggles are selected, comparison data will not display. |
Data File Order
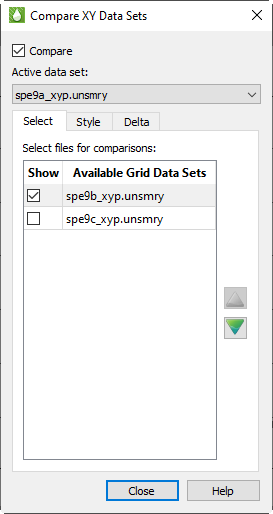
The name of the active data set appears at the top of the dialog, under "Active Data Set," and may be changed here (as well as in the Manage Data dialog shown previously). The remaining loaded data sets are displayed in the Select Files for Comparisons box.
To include/exclude a frame in the comparison plot, toggle the checkbox in the "Show" column next to the data set name on or off. Note that if the "Compare" toggle is checked on the sidebar or in the dialog, the plot will be immediately redrawn. If the compare toggle is not checked then redrawing will be deferred until it is checked. Unchecking the "Compare" toggle will allow you to select plots for comparison and rearrange their order without redrawing the plot multiple times.
Compare plots may be reordered in the plot by clicking the "up" and "down" arrow buttons, or by selecting one or more datasets and dragging them to a new position.
| Only datasets with the "Show" toggle checked will be included in the comparison plot, however the ordering of all data sets in the list may be changed. Changing the ordering of datasets not selected with the "Show" toggle has no effect on the comparison plot. |
The order of the data file assigns it to its corresponding Style Set (specified on the XY Lines page of the Plot Options dialog). By using Style Sets, you can customize the style of the lines, symbols and variables displayed for each data file included in the comparison. Refer to Altering Styles for Comparison Data Sets for information on using Style Sets.
Comparing More Than 99 Data Sets
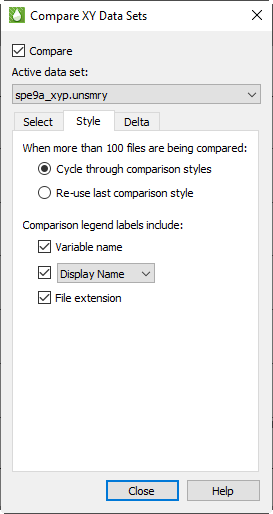
You can compare as many files as you wish simultaneously; however, the number of comparison style sets is limited to 99 (100 including the active data set). Use the Style page of the Compare Data Sets dialog to specify how to apply styles when comparing 100 or more files. You can choose either:
|
|
Comparison Legend
Use the Style page of the Compare Data Sets dialog to indicate how to display file names in the legend. The legend always includes the variable name, but you can also choose to include either a file name or display name:
-
Include display name - The legend includes the variable name and the display name for each file (as set on the XY page of Manage Data; see Loading XY Data). The display name is initially the filename unless you have changed it.
-
Include file name - The legend includes the original file name of each file.
-
Show variable name only - The legend does not refer to the file at all, displaying only the variable name.
By default, the Comparison Legend identifies files by their display name.
Delta Comparison Methods
When comparing data sets as XY Variables or XY Custom Plot, an additional toggle for delta comparison appears in the Data Set region of the sidebar. When "Delta" is toggled-on, Tecplot RS will display a selected comparison between the active data set and the comparison data set(s). By default, the Delta option displays the difference between the active data set and comparison data set(s).
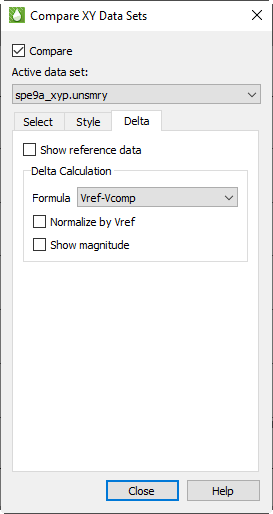
You can customize the Delta display on the Delta page of the Compare Data Sets dialog.
The Delta page includes the choice of whether to show the active data for reference on your plot (by toggling-on "Show reference data").
You can choose the manner of comparison between your active data set and comparison data set(s):
-
Vref - Vcomp = Active value minus comparison value (default setting)
-
Vcomp - Vref = Comparison value minus active value
Toggle-on "Normalize by Vref" to normalize each delta value by its active value.
If you toggle-on the "Show Magnitude" option on the Delta page, the magnitude (absolute value) of each delta value will display.
| If you want to use Time as the independent variable for comparison plots, make sure that both files reference the same starting time. |
Once you have chosen the file(s) to compare and completed your changes in the dialog, your plot will show both the active and comparison data sets (if you left "Show reference data" toggled on in the Delta page of the dialog).
Following is a display of a comparison between two files included in your installation (chelan.unsmry and chelan.hist).
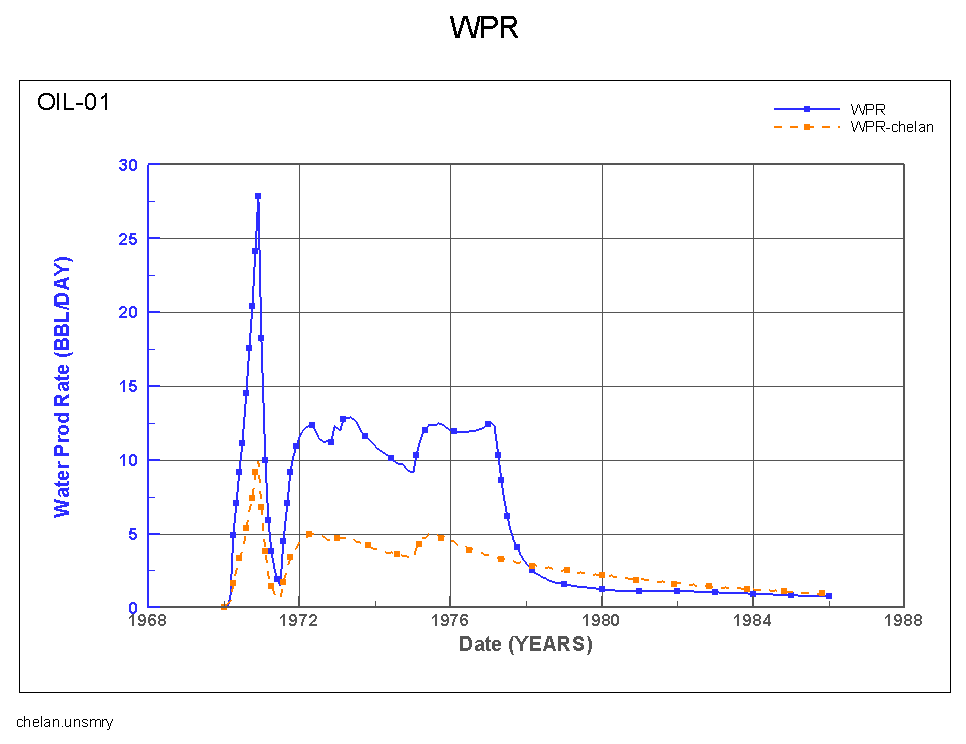
To create this comparison display, follow these steps.
-
Choose from the menu. Click Add in the Load XY Data dialog to display the Open Files dialog.
-
Navigate to the examples folder of your Tecplot RS installation folder (by default on Windows platforms, Tecplot RS installs to C:\Program Files\Tecplot\TecRS 2025 R1) and choose "All Files" in the Files of type menu. Click on the chelan.unsmry file, and, while pressing the Ctrl key, click the chelan.hist file. Click the Open button.
-
Click OK in the Load XY Data dialog.
-
Make sure that the chelan.unsmry file is highlighted in the Manage Data dialog that appears and click OK.
-
With OIL-01 highlighted in the Entities list in the sidebar, toggle on "Compare" in the sidebar. In the Compare Data Sets dialog that displays, on the Select page, click on chelan.hist. Click Close.
By default, each data set will display with a different line type (based on your previous settings on the XY page of the Plot Options dialog). See XY Lines for more information on customizing the line types.
Altering Styles for Comparison Data Sets
The XY Lines page of the Plot Options dialog allows you to customize the
style for each comparison data set. The Plot Options dialog opens
automatically when you double-click on the line you wish to customize. You
can launch it via the menu or the
 button in the toolbar.
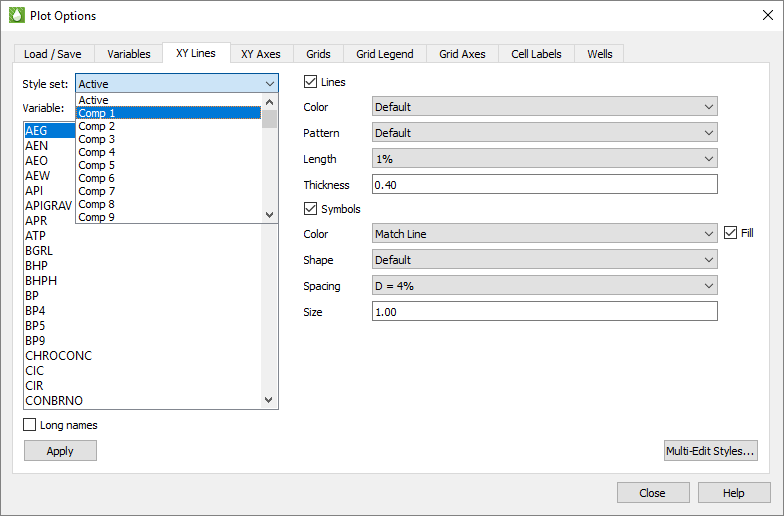
Using the Style Set menu, change the Style Set to "Comp 1". The "Default" is defined in the active rsvariables file. The factory settings in this file are for short dash lines.
When you chose "Comp 1" for the Style Set, you chose to display the styles for the first comparison dataset. Specify the order of the comparison data sets on the Orders page of the Comparison Data Sets dialog. Refer to Data File Order for more information. This time the factory setting simply changes to a different line style. While this is often sufficient to differentiate the lines, you can make additional changes.
You may often want to keep the default color for both lines for simplicity. However, you can make other changes to set the lines apart. For example:
-
Make the line thicker on the active data set and thinner on the comparison set.
-
Turn symbol fill on for the active set and off for Comp 1.
-
Show only symbols on Comp 1 (toggle-off "Lines" to omit lines), and show only lines on Active (toggle-off "Symbols" to omit symbols).
-
Make your symbols squares for one set and diamonds for the other.
Note that the Style Set menu lets you choose from Active and Comp 1 through Comp 99. With these selections you can create 100 unique sets of styles (one for your active data set and up to 99 different comparison data sets).
| If you would like to reuse the style settings you created in the Plot Options dialog, save your settings with the Load/Save page of that dialog. Refer to Load/Save for additional information. |
Comparison Using the XY Freestyle Plot Type
Use this method if you would like to compare data sets that do not have matching variable or entity names. XY Freestyle Plots plots allow you to compare data within a single frame or across several frames. If the data files that you wish to compare have matching variable or entity names and you would like to plot your comparison in a single frame, refer to Using the Compare Toggle.
To compare data sets using XY Freestyle plot type, follow the instructions in the XY Freestyle Plots section. Switch between the files you wish to compare for each line mapping using the File menu in the sidebar. To compare data sets across multiple frames, switch between frames for each line mapping.
The following example illustrates how to compare the "Cumulative Oil Production Rate" (OPC) over time from two different data files in a single frame. In this example, the observed data file used OPC as the variable name for oil production rate and the simulated data file used CumOilPr as the variable name for oil production rate.
-
Load both XY data sets into Tecplot RS (see Loading XY Data).
-
Change the plot type to XY Freestyle.
-
To set up the first line, make the following changes in the sidebar:
-
From the File list, choose the first observed data file.
-
From the Entities list, choose the well or field to compare.
-
In the Variables region of the sidebar, set "Time" as the X-axis variable and "OPC" as the Y-axis variable.
-
-
To set up the second mapping, make the following changes in the sidebar:
-
From the File list, choose the simulated data file.
-
From the Entities list, choose the well or field to compare.
-
In the Variables region of the sidebar, set "Time" as the X-axis variable and "CumOilPr" as the Y-axis variable.
-
-
To change the style of either mapping, double-click on the line and make your changes in the Mapping Style dialog.
If the axis ranges are not identical for each frame, you can adjust the axis ranges. To accomplish this:
-
Click
in the sidebar
or double-click on an axis to open the Plot Options dialog. -
On the XY Axes page, choose OPC from the Variables box.
-
In the Axis Scale region of the dialog, choose "Manual" from the Range menu and adjust the min and max ranges as you wish.
-
Choose "CumOilPr" from the Variables box.
-
Repeat step 3 for CumOilPr.
-
Close the dialog.