Data Probing
 With the Probe tool in
Tecplot RS, you can click a location in your plot and view the values of all
loaded variables at that point, as well as other information including its
I, J, and K values and face neighbor information.
With the Probe tool in
Tecplot RS, you can click a location in your plot and view the values of all
loaded variables at that point, as well as other information including its
I, J, and K values and face neighbor information.
You can also use the Probe At dialog (accessible by clicking the Probe At button in the Probe dialog) to probe at a location specified as a set of spatial coordinates X, Y, and Z, or as a set of I, J, and K indexes. After specifying the position in the dialog, clicking the Probe button activates the probe and the corresponding values appear in the Probe dialog.
 If you do not need the
values of all loaded variables and are viewing a 2D or 3D grid plot, you
can use the Quick Probe tool. This tool displays the I, J, and K indexes of
the probed point, along with the value of the contour variable, in the
Tecplot RS status bar. This can be more convenient for repeated grid probes.
If you do not need the
values of all loaded variables and are viewing a 2D or 3D grid plot, you
can use the Quick Probe tool. This tool displays the I, J, and K indexes of
the probed point, along with the value of the contour variable, in the
Tecplot RS status bar. This can be more convenient for repeated grid probes.
| If Tecplot RS appears to be unloading variables that you want to probe, you may need to adjust your memory threshold. Refer to Load On Demand for additional information. |
Overview: Values Returned by Probing
When you probe with the Probe tool, you can choose whether to probe in either Interpolate mode (by clicking in your plot) or Nearest Point mode (by holding down the Ctrl key while clicking).
In Interpolate mode, Tecplot RS displays the variable values as cell-centered data interpolated from the nearest cell centers at the location of the probe action (on the Cell Center Values page of the Probe dialog). On the Variable Values page of the dialog, probing in the Interpolate mode returns the variable values at the location of the probe interpolated from the node values, which Tecplot RS interpolated from the cell-centered values.
When you use Ctrl+Left-click with the Probe tool (thus using the Nearest Point mode), Tecplot RS returns the value of the variables at the nearest node (not at the exact location of the probe) on the Variable Values page of the dialog, as interpolated from the cell-centered data.
Because of this flexibility given by Tecplot RS, care should be taken when probing. Otherwise one might choose to view variable values smoothed by so much interpolation that their usefulness is lost.
Tecplot RS uses Load On Demand for data probing. Therefore, the only Variable data you will receive are the ones currently on screen. To load other Variables, select the Load Variables button at the bottom of the Probe dialog. See Load On Demand.
The Probe Tool: Probing a Grid Plot
To probe your data interactively, click the Probe tool in the toolbar, and then click in your plot to probe in Interpolate mode, which opens a dialog showing the probe information interpolated for that point. Hold down the Ctrl key while clicking at any location to probe in Nearest Point mode, which will obtain probe information for the node nearest to the probe tool.
The following table shows the information returned for each type of probe tool action for grid plots. All pointer operations use the left mouse button.
| Probe Action | Information Returned |
|---|---|
Left-Click |
If the pointer is over a valid cell, the dialog displays the variable values interpolated from all nodes in the cell. If multiple cells are candidates: 2D grid plots - The cell from the highest number zone is used. 3D grid plots - The closest cell in a zone, slice, iso-surface or streamtrace is selected. If multiple cells are candidates, the cell closest to the viewer is used, with priority given to surfaces drawn with mesh, flooded contours or shading. Tecplot RS excludes any translucent zone surfaces from probing. |
Ctrl+Left-click |
If the pointer is over a valid cell, the field value from the nearest node in the cell is returned. If multiple cells are candidates: 2D grid plots - The cell from the highest number zone is used 3D grid plots - The cell closest to the viewer is used. If the pointer is not over any cell, then the field values from nearest data point (as measured in distance on the screen) are returned. |
Shift+Ctrl+Left-click |
Return the field values from the nearest point on the screen (ignoring surfaces, zone number or depth of the point). This is useful in 3D for probing on data points that are on the back side of a closed surface without having to rotate the object. In 2D this is useful for probing on data points for zones that may be underneath other zones because of the order in which they were drawn. |
Alt+Left-click (3D only) |
Same as Click except ignores zones in the probed area. (Restricts the probe to return values only for streamtraces, iso-surfaces, or slices.) |
Alt+Ctrl+Left-click |
Same as Ctrl-click except ignores zones in the probed area. (Restricts the probe to return values only for streamtraces, iso-surfaces, or slices.) |
Alt+Shift+Ctrl+Left-click |
Same as Shift-Ctrl-Click except ignores zones. (Restricts the probe to return values only for streamtraces, iso-surfaces, or slices.) |
Tecplot RS displays probe results in the Probe dialog, or in the status bar at the bottom of the Tecplot RS window if the quick probe tool is being used.
| Interpolation does not work for I-ordered data displayed in a 2D or 3D grid plot; if you probe such data you will always get the error message "Point is outside of data field," because Tecplot RS cannot interpolate outside the grid. You can, however, use the Nearest Point mode in such situations (the Ctrl+Left-click combinations). |
Probing by Specifying Coordinates and Indexes
Use the Probe At dialog for precise control over probe location, probing using I, J, and K-indexes, or probing inside a 3D volume. You can launch the Probe At dialog by clicking Probe At in the Probe dialog.
Probe at Position
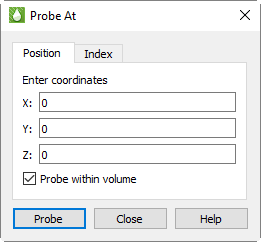
To probe at a specified location using coordinates (in Interpolate mode), use the Probe At dialog. (To open this dialog, click Probe At in the Probe dialog.)
The Position page of the Probe At dialog includes the following controls:
-
Enter Coordinates Type the X, Y, and Z coordinates of the location you wish to probe.
-
Probe Within Volume If you wish to probe a 3D volume, turn on Probe Within Volume to instruct Tecplot RS to perform the probe at the indicated point. Without this control turned on, a probe of a 3D volume zone from this dialog defaults to return the values at the surface of the zone nearest the user.
-
Probe Click Probe to perform the probe. The Probe dialog will display interpolated values for the specified location.
| If no cell exists at the coordinates provided, Tecplot RS will return the values of the surface closest to the coordinates along the line-of-sight. |
Probe at Index
To probe at a specified location using data set indexes (in Nearest Point mode), use the Probe At dialog (you can open this dialog by clicking Probe At in the Probe dialog) and switch to the Index page (shown in this section).
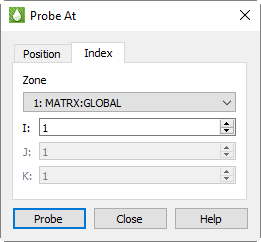
The Index page of the Probe At dialog includes the following options for specifying a point to probe:
-
Mapping/Zone Choose the desired zone or mapping from the menu. For example, you could choose to probe the active or the inactive cells from this menu. The active cells often appear as a zone labeled "1: MATRX:GLOBAL".
-
I, J, K Type the I, J, and K-indexes of the position that you wish to probe. (For finite element and I-ordered data, you can enter only the I-index. For IJ-ordered data, you can enter both I and J-indexes. For IJK-ordered data, you can enter I, J, and K-indexes.)
-
Probe Click the Probe button to perform the probe. The Probe dialog will appear with interpolated values for the location specified on the Index page of the Probe At dialog.
Viewing Probed Data
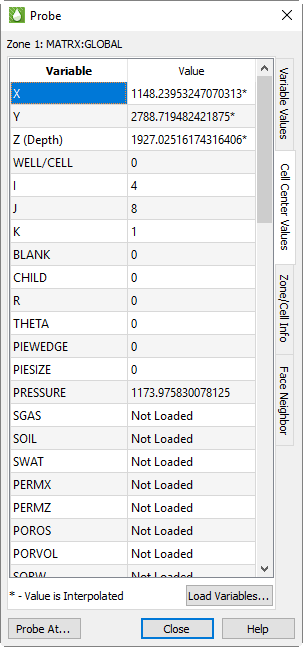
The Probe dialog displays the values returned by the most recent probing action. The dialog includes four pages, on which you can view different information about the probed location.
-
Variable Values On this page, Tecplot RS displays values of all variables at the probed location.
-
Zone and Cell Information This page of the dialog reports characteristics of the probed location, including the location’s format, cell points included, and nodes around the probed cell location.
-
Cell Center This page displays the variable values at the center of the probed cell.
-
Face Neighbor On the Face Neighbor page, you can view details of cells around the probed cell.
When using the quick probe tool, the IJK indexes of the probed point are displayed, along with the value of the contour variable, in the Tecplot RS status bar at the bottom of the window. The Probe dialog is not displayed.
If a variable appears in the Probe dialog that Tecplot RS has not loaded, the value for that variable will appear as "Not Loaded". See Load On Demand for more information on loading variables not loaded automatically.
Variable Values
The Variable Values page lists every variable in the active data set and its value at the probe point. Each variable appears on a single line.
As discussed in Overview: Values Returned by Probing, it is important to be careful understanding how Tecplot RS approximates the values on this page. In general, use this page when probing in the Nearest Point mode (by using Ctrl+Left-click).
Zone and Cell Information
The Zone and Cell Information page of the dialog lists information about the probed location:
-
Format The format of the data appears as either ordered or as a finite element format (FE-Triangle, FE-Quad, FE-Tetra, or FE-Brick).
For cell-based finite element data, the following information appears.
-
Total Points The total number of points in the data.
-
Total Elements The total number of cells (elements) in the data.
-
Element Number The number of the probed element.
-
Nodes 1-4 The nodes defining the corners of the cell (Nodes 5-8 appear for the FE-Brick format).
For ordered data, the following information appears:
-
I-Max, J-Max, K-Max The maximum index values of the data.
-
Plane Tecplot RS displays the type of plane probed. I, J, or K displays the index of the point at the principle data point of the cell containing the probed point. (If the point is probed in Nearest Point mode, with Ctrl+Left-click, the label reads "I, J, or K Index".)
-
Face Plane The I, J, or K plane used in the probe.
-
Face Indexes These planes, not listed as face planes, appear in 3D or are the axes in 2D.
Cell Center
The Cell Center page of the Probe dialog lists the value of each variable in the data set at the location of the probe as interpolated from the centers of the surrounding cells.
Face Neighbor
The Face Neighbor page of the dialog displays the cells that neighbor the probed cell.
Tecplot RS considers a cell a neighboring cell if one of its faces shares all nodes in common with the probed cell, or if the data set’s face neighbor data identifies it as a neighbor.
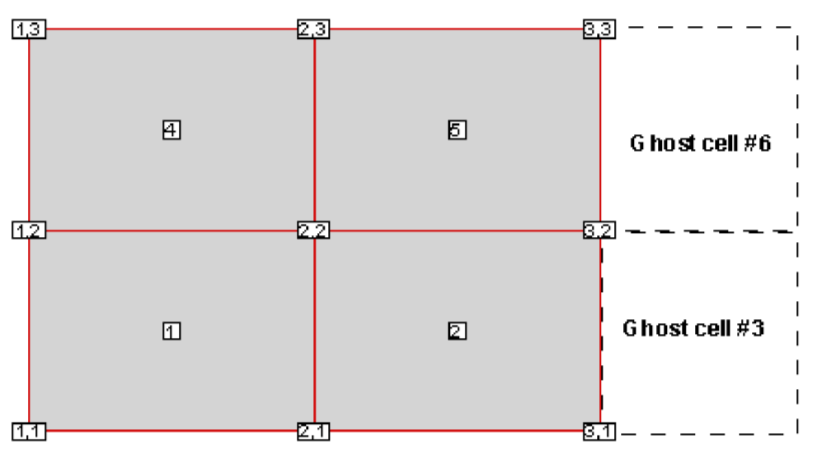
For ordered (IJ or IJK) data, cell numbers are defined by the index value of the first node, according to the following formula:
Index = i + (j - 1) Imax + (k - 1) ImaxJmax
In this formula, i, j, and k represent the i, j, and k values for the location of the first node.
Because the number of nodes in each direction is one greater than the number of cells in that direction, no cell exists to correspond with the last point in each row. In this example, no cell exists numbered "3", yet the first cell in the second row is numbered "4". As you define face neighbors, it may help you to think of a "ghost cell" at the end of each row (where I = Imax) and at the end of each column in 3D (where J=Jmax).
For finite element data, the cells are numbered in the order they appear in the connectivity list. In the following example "7 8 19 11" represents the cell number 2:
2 |
4 |
8 |
19 |
7 |
8 |
19 |
11 |
1 |
2 |
4 |
5 |
For more information, you can access the Tecplot 360 Data Format Guide from the Tecplot Web site.
Probing an XY Plot
You can probe XY plots similarly to grid plots, by using the probe tool to obtain interpolated variable values at any given location or exact values from a specified (X, Y) data point. When you probe an XY Variables plot, Tecplot RS displays a vertical or horizontal guide line, depending on whether you are probing along an X-axis or a Y-axis.
To probe in interpolate mode, click the probe tool in the toolbar and then click in your plot. Tecplot RS interpolates axis variable values of all active mappings that lie along the probe line and displays them.
To probe in Nearest Point mode, click the probe tool and then Ctrl+Left-click in your plot. When you Ctrl-click, Tecplot RS displays the exact X and Y values of the data point closest to the location clicked.
The quick probe tool is not available in XY plots.
XY Plot Probing in Interpolate Mode
Tecplot RS uses the Interpolate mode as the standard probe tool mode in XY plots just as for grid plots. For XY plots, you can probe along any of Tecplot RS’s five X-axes, or along any of Tecplot RS’s five Y-axes. By default, probing is performed along the X1 axis.
To activate the Probe Interpolate mode, click the Probe tool in the toolbar, click in your plot to create an initial probed point, and click the Probe At button in the Probe dialog that appears. The Probe At dialog has the following options:
|
|
-
Probe Click the Probe button to perform the probe. The Probe dialog will display with the variable values.
For interpolated values, the Probe dialog lists every active mapping and the interpolated value the opposing axis variable for that mapping. The dialog lists the value along the probed axis at the bottom.
In the Probe dialog, the probe value displays as dashed (---) if the probe is out of range for the mapping. The probe value is gray (inactive) if the mapping is not using the specific axis which you are probing. For example, if you probe the X1 axis and the mapping uses the X2 axis, a dashed line will display. This can happen in XY Line plots with multiple X or Y-axes.
- Tecplot RS displays each mapping value on a single line, with the position of the probe listed as following
-
-
X-Value, Y-value X, Y-value of the nearest data point to the probe position.
-
I, J, or K-Index I, J or K-index of the nearest data point to the probe position.
-
Map Number and name of the nearest map to the probe position.
-
Zone Number and name of the nearest zone to the probe position.
-
I, J, or K-Max Maximum I, J or K-index of the current zone.
-
X or Y-Axis X or Y-axis associated with the current map.
-
XY Plot Probing in Nearest Point Mode
Nearest Point probe mode provides the X and Y values of the data point at the node closest to the probed location, interpolated from the cell-centered data. If a data point is common to multiple mappings, the probe returns information on the highest numbered mapping. For example, if a data point is plotted as part of two mappings, numbered 1 and 2, the probe results are displayed for mapping 2.
To enter the Probe Nearest Point mode, click the Probe tool in the Toolbar and then Ctrl+Left-click at the desired probe location. Tecplot RS calculates the nearest point to the probe tool, independent of the axis you were probing along.
- In Nearest Point mode, the Probe dialog displays the following information about the nearest data point
-
-
X-value
-
Y-value
-
I, J, and/or K-index
-
The number and name of the mapping associated with the data point
-
The number and name of the zone referenced in the mapping
-
The maximum I, J, and K-indexes of the zone
-
For XY plots, the X-axis and Y-axis associated with the mapping
-
Probe Variables Dialog
With 2D or 3D grid plots, the Probe dialog initially displays values for the probed cell for all the solution variables shown in the plot. For example, this plot shows two solution variables, PRESSURE_and CDEPTH, and values for these are shown in the Probe dialog. The remaining solution variables are shown as "Not Loaded".
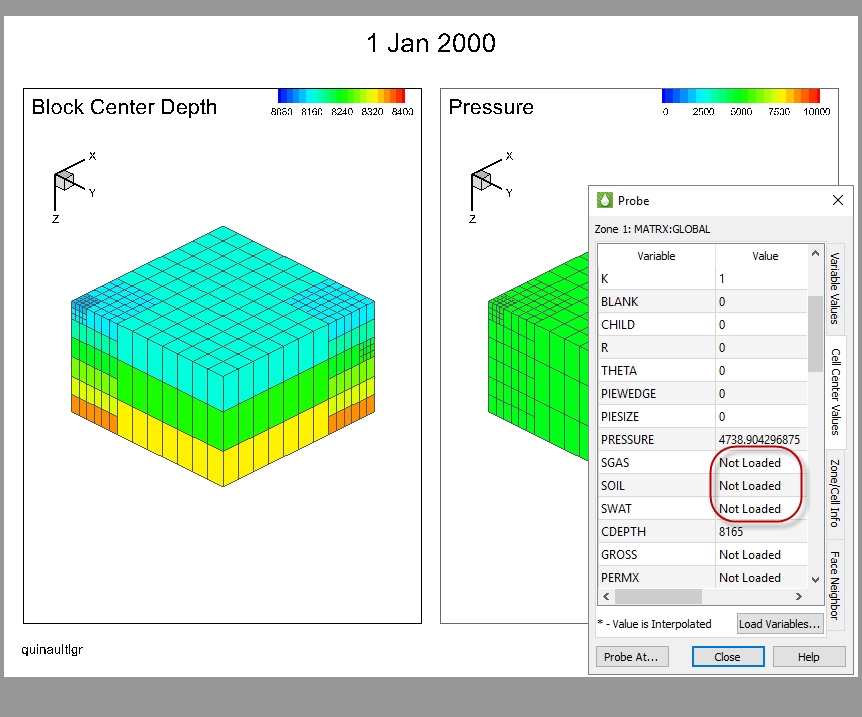
Often, you will want to see the values of other variables at the probed cell without having to set up additional plots containing these variables. The Probe dialog contains a Load Variables button that lets you load additional variables and display them in the Probe dialog, but these values do not refresh after changing time step or view type, or many other operations.
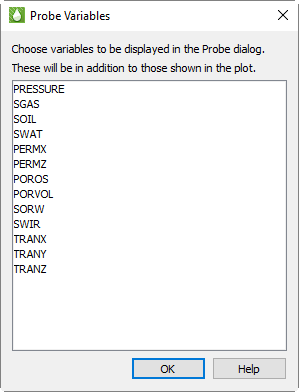
Instead of using the Load Variables button in the Probe dialog in this situation, use open the Probe Variables dialog () and choose the additional variables to be displayed and loaded in the Probe dialog.
-
Click an item with the mouse button (without holding down any keys) to select only that item.
-
Hold down the Control key while clicking the mouse button to toggle an item between selected and unselected.
-
To select a single contiguous range of items, click the first item in the range normally. Then hold down the Shift key while clicking the last item in the range.
-
To select multiple ranges, select the first range by clicking and shift+Left-clicking as just described. Then, to select another range while leaving the first selected, Control-click the first item in the range, then Shift+Control+Left-click the last item in the range. Repeat this for each additional range you wish to select.
-
To select all variables, press Control+A (for All).
Selections chosen in the Probe Variables dialog are remembered when you change time steps, select different grid planes, and so on, and are saved and restored with the grid.
When working with a comparison plot, you can probe on any of the data sets, and if a variable of the same name exists in the comparison grid, the Probe dialog also shows values from those data sets.
It is not necessary to select variables already shown in the plot, as these will always appear in the Probe dialog, but it won’t hurt to do so, and it will keep those variables' values available when probing even if you change the variable(s) shown in the plot.
| With large data sets, choosing many variables can noticeably slow some operations, particularly animation. If this becomes problematic, close the Probe dialog when not using it, or reduce the variables displayed to just the ones you are interested in. |
Editing Data
Using the Adjustor tool, you can probe and edit specific data points. In Adjustor mode, you can actually modify the coordinates of your data with the pointer.
To edit data points, move them with the pointer, using the Adjustor tool (in XY and 2D grid plots only).
| If you modify a shared variable with the Adjustor tool, Tecplot RS will branch the variable it will create a separate copy of the variable for the edited version. |
In XY and 2D grid plots, you can select and move data points with the Adjustor tool. You can select multiple data points and move them as a group by pressing the Ctrl and Shift keys while clicking the points.
See Adjustor for more information.