Streamtraces
The addition of a streamtrace, the path traced by a massless particle placed at an arbitrary position in a steady-state vector field, to your 2D or 3D grid plot, can help illustrate the nature of a vector field flow in a particular region of the plot.
Select Variables
When selecting variables for axes or for vectors, the Select Variables dialog appears.
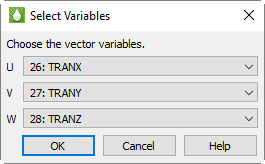
Choose the variables to assign to the X, Y, and Z axes or to the U, V, and W vectors.
Simple Streamtrace Creation
Because streamtraces depend on the vector field, you must define the vector
components before creating streamtraces in Tecplot RS. To add streamtraces
to your 2D or 3D grid plot, click the
 (Add Streamtrace)
button in the toolbar to activate the Streamtrace tool. After defining the
vector components and clicking OK, click in your plot to create a
streamtrace whose path traces through the point clicked.
(Add Streamtrace)
button in the toolbar to activate the Streamtrace tool. After defining the
vector components and clicking OK, click in your plot to create a
streamtrace whose path traces through the point clicked.
To add a rake of streamtraces (multiple streamtraces equidistant from each other across a surface), drag in your plot to indicate the width of the rake. To change the number of streamtraces in the created rake, type a number between 1 and 9 before dragging in your plot.
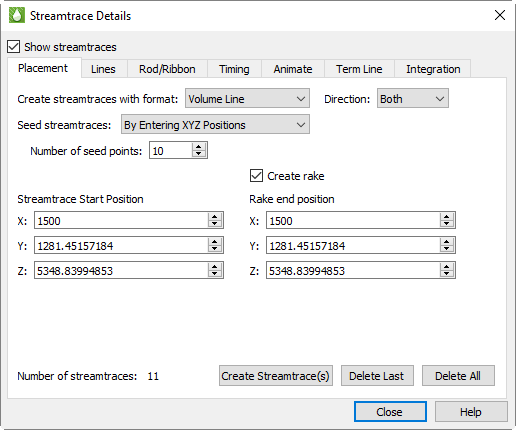
You can also use the Position page of the Streamtrace Details dialog (accessible by choosing "Streamtraces" from the menu) to specify the location of your streamtrace. Click the Create Stream(s) button to create a streamtrace with a path through the designated point.
Creating Different Types of Streamtraces
To create streamtraces with a format other than Surface Line, choose a format from the menu on the Position page of the Streamtrace Details dialog (3D grid plots only).
Tecplot RS supports two main types of streamtraces:
-
Surface line streamtraces (or streamlines) Surface streamtraces are confined to the surface on which they are placed. They can only be placed on 2D or 3D surfaces. See Lines Page to customize these surface line streamtraces. When surface streamtraces are placed on a no-slip boundary surface, they will propagate according to the flow field very near the surface.
-
Volume streamtraces Volume streamtraces can be created in 3D volumes only (IJK-ordered volumes). See Rod/Ribbon Page. Volume streamtraces include three subcategories:
-
Volume Lines, or volume streamlines
-
Volume Ribbons, or streamribbons
-
Volume Rods, or streamrods
-
|
The following shortcuts enable you to place different kinds of streamtraces with the Add Streamtrace tool in the toolbar. With this tool activated, type the corresponding key before clicking to place the streamtrace. D - Switches to stream rods |
Streamtrace Limitations
-
Unorganized data (I-ordered zones)
-
Zero-valued vectors (choose different vector components)
-
Outside the data (Hold down the Ctrl key while clicking or dragging to place a streamtrace outside the data. If drawing a rake on a concave 3D volume surface, hold down the Shift key to draw the rake outside the data.)
-
Inappropriate integration step size. Refer to Integration Page for information on integrating streamtraces.
Streamtrace Details dialog
To control the aspects of your streamtrace(s), use the Streamtrace Details dialog (accessible by choosing from the menu). The attributes set in this dialog affect all streamtraces in the active frame, including those already placed.
To display streamtraces in your plot, toggle-on the Show Streamtraces control at the top of the Streamtrace Details dialog.
| In order for streamtraces to appear in your plot, or for changes made in the Streamtrace Details dialog to appear in your plot, you must have "Show Streamtraces" toggled-on at the top of the Streamtrace Details dialog. |
Placement Page
Use the Placement page of the Streamtrace Details dialog (accessible by choosing from the menu) to add and customize the placement of a streamtrace or streamtrace rake.
| You can also add streamtraces by using the Add Streamtrace tool in the toolbar. See Simple Streamtrace Creation. |
The Placement page includes the following options:
-
Create Streamtraces with Format Choose the format for the next streamtrace from the menu. You can choose from the following formats:
-
Surface Line Two-dimensional and 3D surface streamlines. Surface lines are confined to the surface upon which they are placed. If placed in a 3D volume zone, these streamtraces are not plotted.
-
Volume Line Three-dimensional volume streamline plotted through 3D space. The streamline path is integrated in three dimensions within the 3D volume field.
-
Volume Ribbon Three-dimensional volume streamtrace with a defined thickness that twists in accordance with the local stream-wise vorticity of the vector field: a streamribbon. When you select this option, you should also check the ribbon width on the Rod/Ribbon page of the Streamtrace Details dialog. The width affects all streamtraces, including those already placed. The default width is often too large, but it is automatically calculated based upon the extent of your data. The center of the streamribbon is a 3D volume streamline. The streamribbon rotates about this streamline in accordance with the local vector field. Streamribbons have an orientation at each step.
-
Volume Rod This 3D volume type of streamtrace has a defined thickness and a polygonal cross-section: a streamrod. The cross-section of a streamrod rotates around a volume streamline in accordance with the local stream-wise vorticity. The center of the streamrod is a regular 3D volume streamline. Streamrods have an orientation at each step. As with streamribbons, you should check the rod width on the Rod/Ribbon page of the Streamtrace Details dialog, as well as the number of rod points (three, by default). The number of points indicates the cross-sectional shape of the rod. Three is an equilateral triangle; four, a square; five, a regular pentagon; and so forth. Like the width parameter, the number of points applies to all streamrods, including those already placed.
-
|
The following shortcuts enable you to place different kinds of streamtraces with the Streamtrace tool in the toolbar. Type the corresponding key before clicking to place the streamtrace. D - Switches to stream rods |
-
Direction Select the stream integration direction from the following options:
-
Forward Select for forward integration from the starting point.
-
Backward Select for backward integration from the starting point. When the streamlines are calculated backwards, the arrowheads still point in the forward direction.
-
Both Select for both forward and backward integration from the starting point. For streamribbons and streamrods, avoid this option.
-
-
Enter IJK Positions Select to specify the streamtrace starting point (and rake ending positions, if applicable) using the mesh indexes I, J, and K.
-
Enter XYZ Positions Select to specify the streamtrace starting point (and rake ending positions, if applicable) using the spatial coordinates X, Y, and Z.
-
Zone (only if Enter IJK Positions is selected) Choose from the menu the zone for which the I, J, (and K) indexes are being specified.
-
Create Rake Select to identify the starting position as the start of a rake, and to activate the Rake Ending Position fields. A rake is a group of streamtraces. If you are drawing a rake on concave 3D volume surfaces, hold down the Shift key to draw the rake outside of the data.
-
Streamtrace Start Position Specify the starting position for a single streamtrace, or (if "Create Rake" is selected) the beginning of a rake of streamtraces. There are two or three fields, labeled either X, Y, (and Z) or I, J, (and K). Enter the desired value in each field, or use the up and down arrows to increase or decrease the values.
-
Rake End Position (Only if Create Rake is selected) Specify the end position for a rake of streamtraces. There are two or three fields, labeled either X, Y, (and Z) or I, J, (and K). Enter the desired value in each field, or use the up and down arrows to increase or decrease the values.
-
Streamtraces per Rake Type an integer in the text field to specify the number of streamtraces on each rake, where a rake is a group of streamtraces.
-
Create Streamtraces(s) Click this button to place the streamtrace or rake of streamtraces.
| 1, 2, 3, 4, 5, 6, 7, 8, 9 With the Streamtrace tool selected, enter 1-9 to change the number of streamtraces to add when placing a rake of streamtraces. |
-
Number of Streamtraces (Information only) The number of streamtraces currently placed.
-
Delete Last Click this button to delete the last streamtrace placed.
-
Delete All Click this button to delete all streamtraces in the current plot.
Lines Page
You can customize the appearance of created surface streamtraces or streamlines on the Lines page of the dialog. Tecplot RS constrains these surface streamtraces to the surface on which you place them. You can only place this type of streamtrace on a 2D or 3D surface.
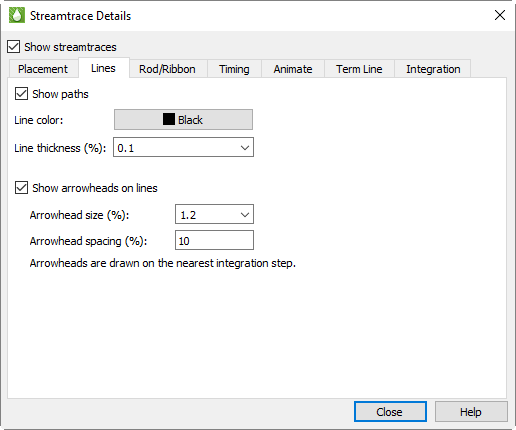
The Lines page includes the following controls. (You cannot customize streamtraces using the Line page until after drawing at least one surface streamtrace.)
-
Line Color Choose the color for all streamtraces. To color the streamtraces by the chosen contour variable in the same manner as color flooding, choose Multi colored. (If the contour variable is not currently defined, the Contour Variable dialog appears so that you can define it.) You can use the Multi-color option, for example, to color the streamtraces by the local temperature or by the velocity magnitude. You can also specify RGB coloring.
The following attributes affect only surface and volume streamlines:
-
Line Thickness Type a value or choose a pre-set value for the streamline thickness (as a percentage of the frame height for 2D lines and as a percentage of the median axis length for 3D surface lines and volume lines), or choose a pre-set value.
-
Arrows Toggle-on "Show Arrowheads on Lines" to display arrowheads along all streamlines (surface and volume) in the active frame. Volume ribbons and volume rods do not include arrows. You can also control the following attributes of the displayed arrows:
-
Arrowhead Size Type a value for the arrowhead size (as a percentage of the frame height), or choose a pre-set value.
-
Arrowhead Spacing Type the distance between arrowheads, in Y-frame units. A value of ten percent spaces arrowheads approximately ten percent of the frame height apart from each other along each streamline.
-
Rod/Ribbon Page
The settings on the Rod/Ribbon page of the Streamtrace Details dialog affect only volume ribbons and volume rods. To activate these settings, create at least one volume ribbon or volume rod streamtrace (you can do this on the Placement Page of the dialog).
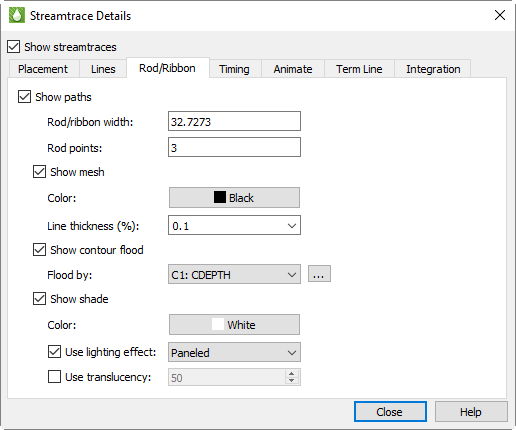
The Rod/Ribbon page includes the following controls.
-
Rod/Ribbon Width Type a width for the volume ribbons and volume rods. The width is expressed in grid units.
-
Rod Points Volume rods have a polygonal cross-section; this parameter tells Tecplot RS what that cross-section should be. Three is an equilateral triangle, four is a square, five is a regular pentagon, and so on.
-
Show Mesh Toggle-on to display a mesh.
-
Mesh Color Choose a mesh color from the Color Chooser dialog.
-
Mesh Line Thickness Choose a line thickness from the menu, or type a number in the text field.
-
-
Show Contour Flood Turn on this setting to display contour flooding.
-
Flood by Choose the contour group by which to flood.
-
Details Use the Details button to open the Contour Details dialog.
-
-
Show Shade Turn on this control to display shading.
-
Shade Color Choose a shade color from the Color Chooser dialog. Multi-color and RGB coloring are not available (use contour flooding instead).
-
Use Lighting Effect Toggle-on to enable the lighting effect menu. From this menu you can choose "Paneled" or "Gouraud" shading.
-
Use Surface Translucency Toggle-on to enable the surface translucency text field, in which you can set the surface translucency from one (opaque) to 99 (translucent).
-
Timing Page
Use the Timing page of the Streamtrace Details dialog (accessible by choosing from the menu) to control timed markers for streamlines and timed dashes for all types of streamtraces. Tecplot RS draws stream markers at time locations along streamlines. The stream markers display at intervals proportional to the magnitude of the local vector field.
Stream markers are symbols plotted along streamtrace paths to identify the positions of particles at certain times. The image below shows a plot with both streamtrace markers and dashes.
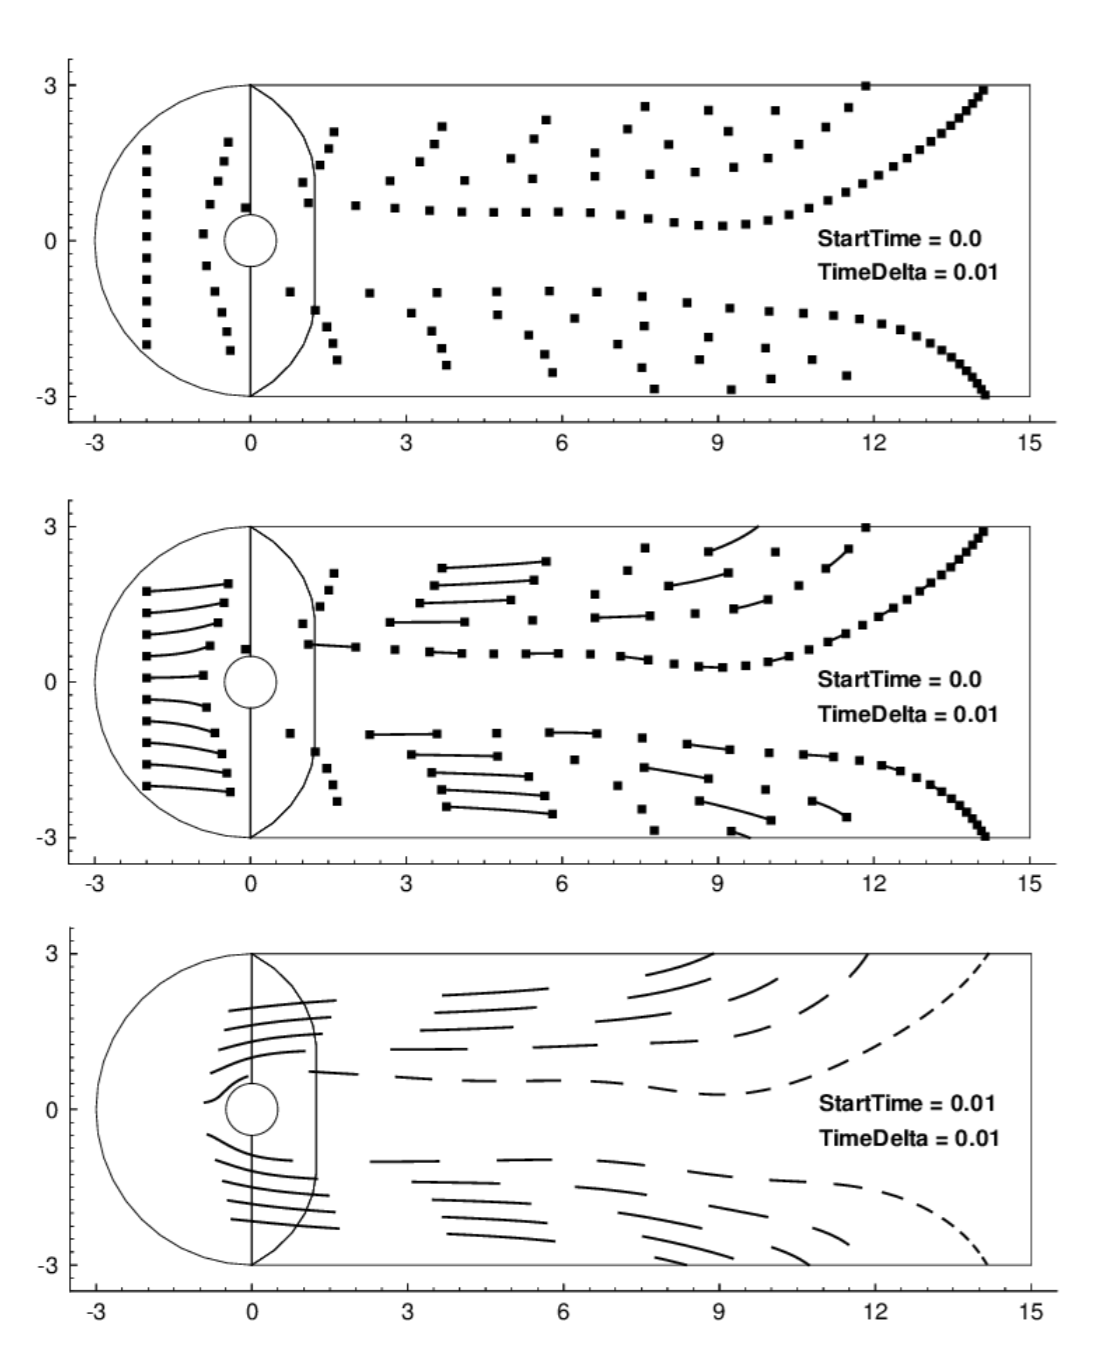
The stream markers appear at intervals proportional to the magnitude of the local vector field. You can adjust the spacing between stream markers by specifying the time interval (or delta) between stream markers. Increasing the delta time increases the space between stream markers and vice versa. The actual spacing is the product of the local vector magnitude and the specified delta.
You can also select the shape of your stream marker using the pre-set list of the menu on the Timing page of the Streamtrace Details dialog.
To place stream markers or dashes along your streamtraces, open the Timing page of the Streamtrace Details dialog (accessible by choosing from the menu).
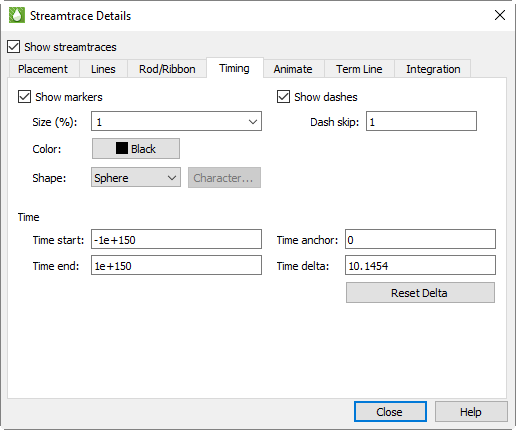
The Timing page includes the following controls:
-
Show Markers [default = spheres (3D) /circles (2D)] Toggle-on to include stream markers. Stream markers are only available for streamlines (surface and volume). Specify the size, color, and shape of the markers in the fields provided.
-
Show Dashes Toggle-on to include stream dashes. The lengths of the dashes and the spaces between the dashes are controlled by the value of Delta. Type a value into the dash skip factor to control the number of time deltas are used for the "off" sections of the streamtraces.
-
Time Start Type the time at which the first marker should be drawn. A start time of zero means that the first marker is drawn at the starting point. A start time of 2.5 means that the first stream marker is drawn 2.5 time units downstream of the starting point.
-
Time End Type the time after which no more stream markers are drawn.
-
Time Delta Type the time interval that measures the time between stream markers. The actual distance between markers is the product of this number and the local vector magnitude.
-
Time Anchor Type the time that a dash is guaranteed to start, provided the start and end time surround the dash.
Termination Line Page
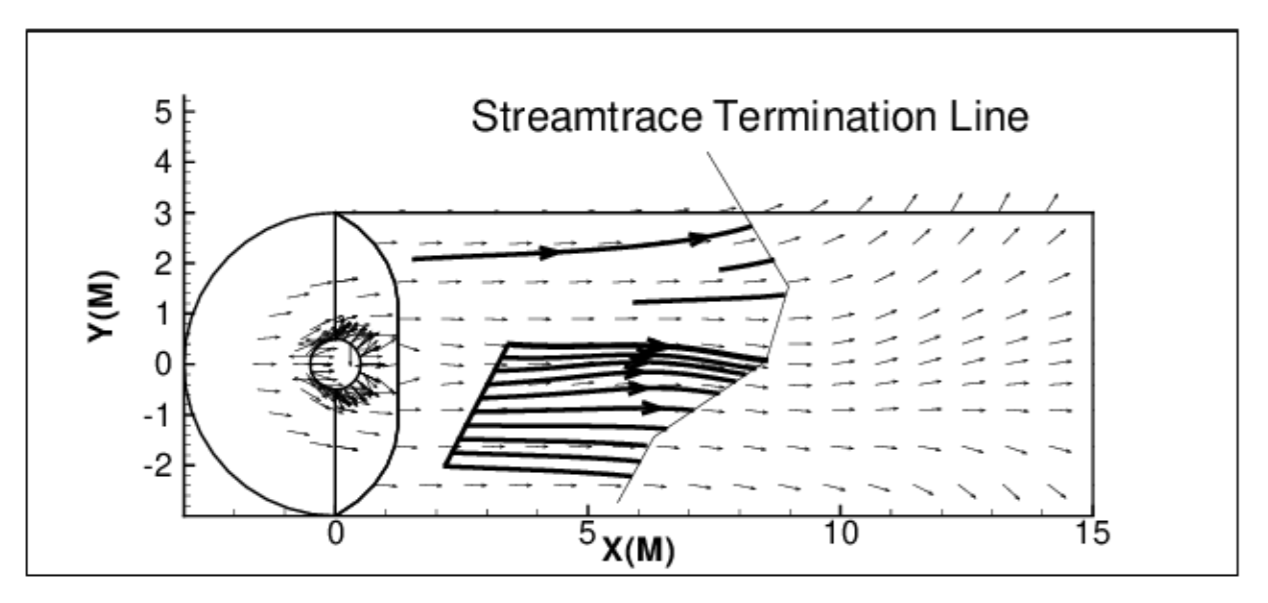
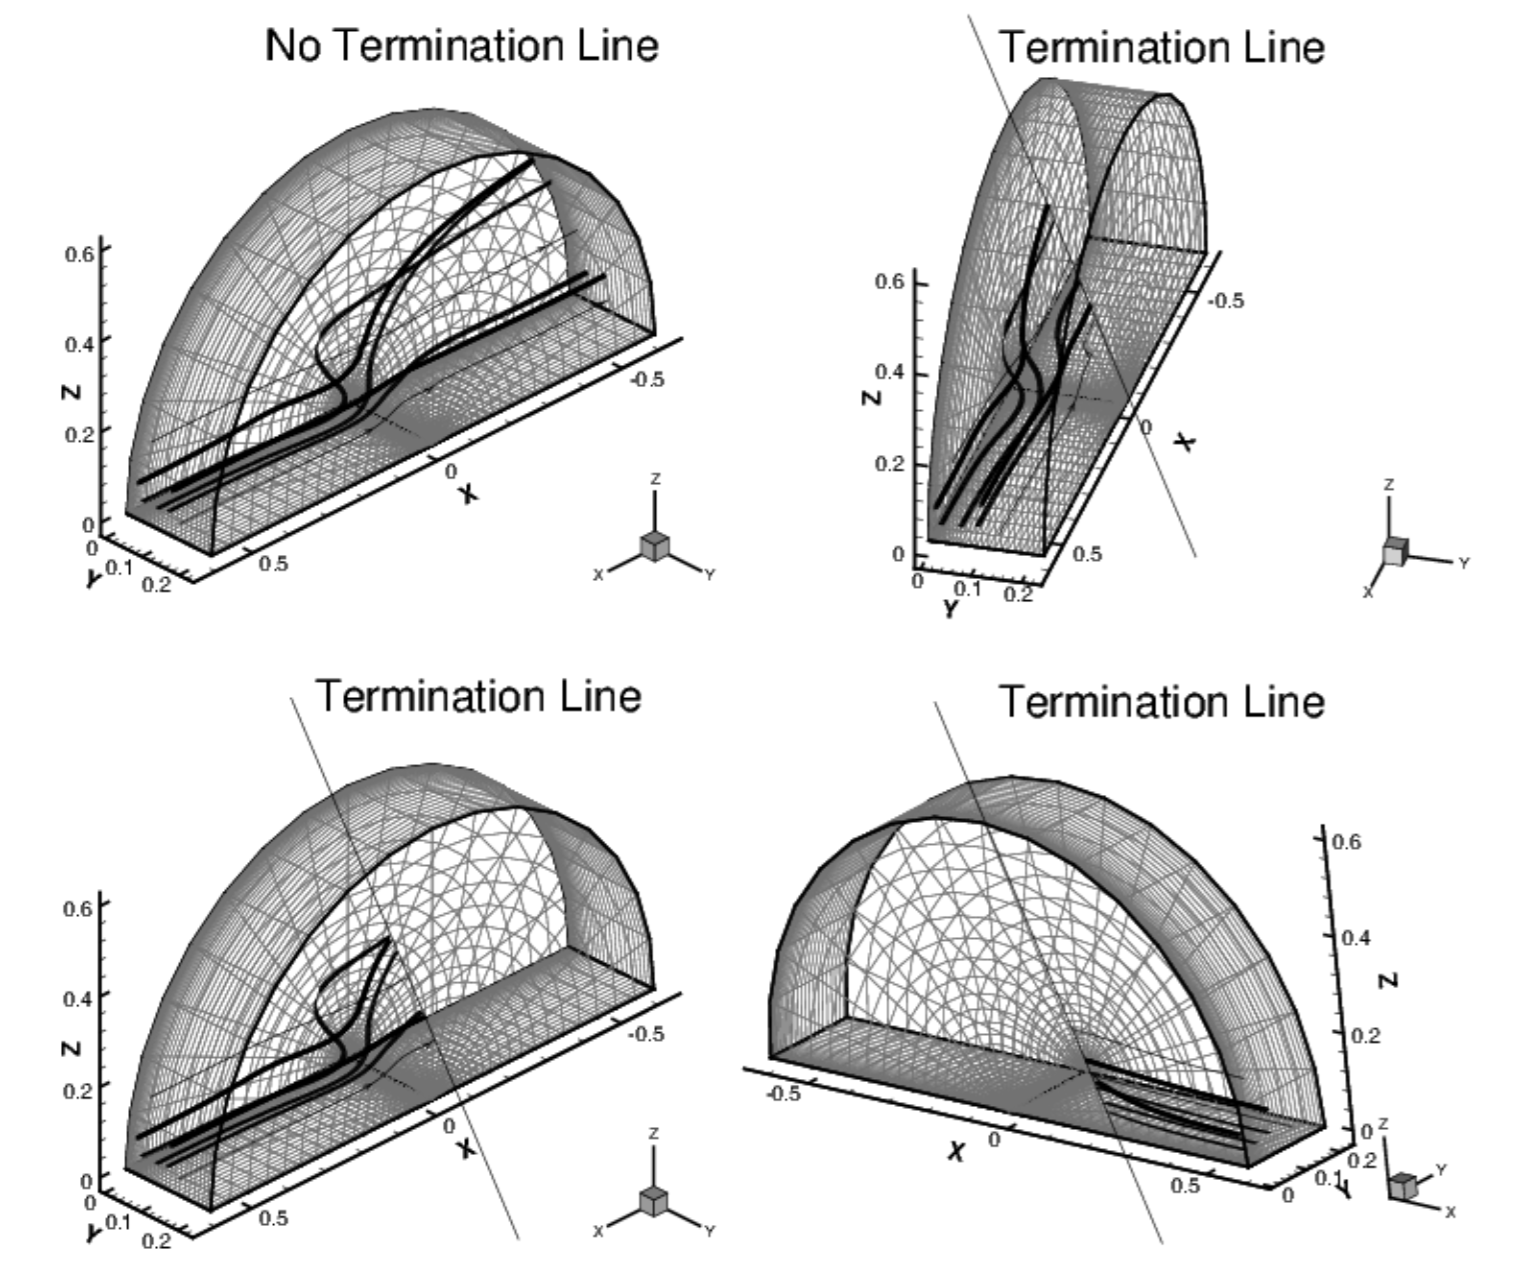
A streamtrace termination line appears as a polyline that terminates any streamtraces that cross it. The termination line is useful for stopping streamtraces before they spiral or stall. The image below shows the cylinder data with some streamtraces terminated by a 2D streamtrace termination line.
Tecplot RS terminates streamtraces whenever any of the following occur:
-
Tecplot RS reaches the maximum number of integration steps.
-
The streamtrace passes outside the available data.
-
The streamtrace reaches a point at which the velocity magnitude is zero.
The Term Line page of the Streamtrace Details dialog controls the existence and appearance of streamtrace termination line(s).
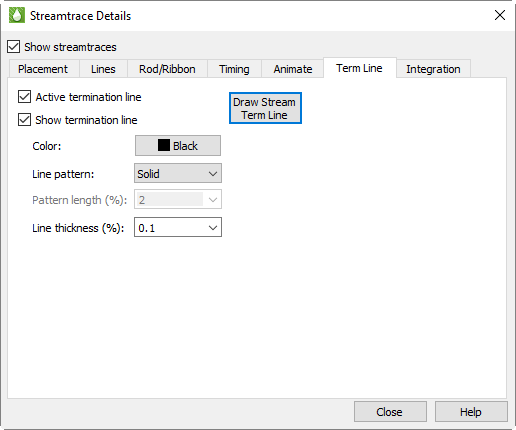
With the Term Line page, you can control the following attributes of the termination line:
-
Draw Stream Term Line Click this button to change the pointer tool to create a streamtrace termination tool. Click in your plot to create a polyline that will act as a streamtrace termination line. Double-click in your plot to end the termination line.
-
Active Termination Line Toggle-on to activate the termination line and terminate any streamtraces that cross it. Toggle-off this option and redraw the plot to view unterminated streamtraces.
-
Show Termination Line Toggle-on to display the termination line. Toggle-off this option and redraw the plot to display terminated streamlines, but not the termination line.
You can select a termination line with the Selector or Adjustor tool. This allows you to interactively move the line (with the Selector), modify the line (with the Adjustor), or delete the line (with either tool).
| Only one termination line can exist at any one time in a given frame. If you draw a second termination line, Tecplot RS automatically deletes the first one. |
Termination Lines in the Eye Coordinate System
Tecplot RS draws the streamtrace termination line in the grid coordinate system, which in 2D Grid plots moves with the data as you zoom and translate. In 3D Grid plots, Tecplot RS draws the termination line in what is known as the eye coordinate system. Grid coordinates align with the eye coordinate system, so that the termination line moves with the data as you zoom and translate, but remains fixed when you rotate the plot.
When you rotate a 3D data set after drawing a streamtrace termination line, Tecplot RS may terminate streamtraces previously terminated by the termination line at different places, or not terminated at all if the rotated streamtrace no longer intersects the termination line. The image below shows a 3D volume plot with streamribbons and a streamtrace termination line. This figure illustrates how the termination points vary as you rotate the plot. Notice that the termination line, rendered in the eye coordinate system, remains in place on the screen as the plot is rotated.
Integration Page
Tecplot RS uses an adaptive step-size, trapezoidal integration algorithm to calculate streamtraces. This creates the streamtrace by moving it in a series of small steps from the starting point in the direction of (or in opposition to) the local vector field. Each step is only a fraction of a cell or element. Tecplot RS automatically adjusts the step size based on the local cell shape and vector field variation.
You can control the streamtrace integration by modifying the following parameters on the Integration page of the Streamtrace Details dialog:
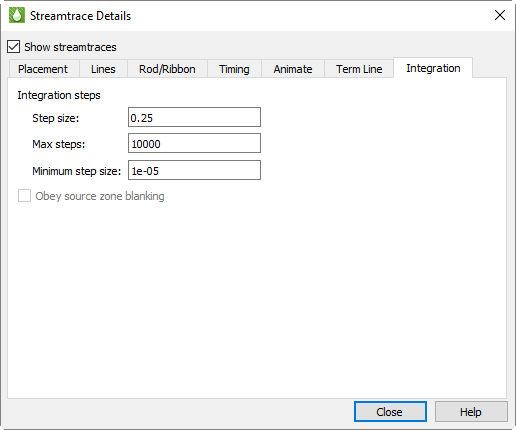
-
Step Size Type the initial and maximum step size Tecplot RS uses while integrating through the vector field as a decimal fraction of the local cell or element width. A typical value (and the default) is 0.25, which results in four integration steps through each cell or element. The value for Step Size affects the accuracy of the integration. Setting Step Size too small can result in round-off errors, while setting it too large can result in truncation errors and missed cells.
-
Max Steps Type the maximum number of steps before the streamtrace is terminated. This prevents streamtraces from spinning forever in a vortex, or from wandering into a region where the vector components are very small, very random, or both. If you choose a small Step Size, use a larger Max Steps.
-
Minimum Step Size The smallest step size for Tecplot RS to use. Setting this too small results in integration problems. Setting this greater than or equal to the Step Size results in a constant step size.
-
Obey Source Zone Blanking When active, Tecplot RS generates streamtraces for non-blanked regions only. When inactive, it generates streamtraces for both blanked and unblanked regions.
During the integration, Tecplot RS terminates a streamtrace if any of the following conditions occur:
-
The maximum number of integration steps (Max Steps) have been taken.
-
Any point the streamtrace passes outside the available data.
-
The streamtrace reaches a point where the velocity magnitude is zero.
-
The streamtrace crosses the stream termination line.
Streamtraces may terminate at a zone boundary even if there is an adjacent zone into which the streamtraces should proceed. This can happen if there is a small gap between the zones.