Creating Plots
In this chapter, you can learn how to create a basic plot in Tecplot RS, as well as how to retrieve it easily.
Read the end of the chapter to learn how to view your data files from within Tecplot RS.
Creating a Basic Plot in Tecplot RS
To create a basic plot of your data in Tecplot RS:
-
Load your data as either XY or grid data.
To do this, choose or from the menu, or click the
 (Load XY Data) or
the
(Load XY Data) or
the  (Load Grid
Data) button in the toolbar. In the appropriate Load Data dialog that
appears, choose the data type that you wish to load. Tecplot RS 2025 R1
supports the following data types: XY Data, Grid Data and data from the
Tecplot Data Loader.
(Load Grid
Data) button in the toolbar. In the appropriate Load Data dialog that
appears, choose the data type that you wish to load. Tecplot RS 2025 R1
supports the following data types: XY Data, Grid Data and data from the
Tecplot Data Loader.Table 1. XY Data Loader File extension(s) Eclipse
.unsmry, .rft files, and .user
Chears
.hist and .csv
Intersect
.obsh
VIP
.rft, .plt and .obs
General ASCII
.txt and .prn
Log ASCII Std
.las
XY Multi
.xymulti
VDB
Folder for VIP or NEXUS data
CMG
.irf, .mrf, .sr3
Sensor
.*61
UTCHEM
*OVERAL
Table 2. Grid Data Loader File extension(s) Eclipse/Chears grid
Various extensions
VIP Map grid
Various extensions
VDB
Folder for VIP or NEXUS data
CMG
.irf, .mrf, .sr3
Sensor
.*71
UTCHEM
INPUT
-
Tecplot Data Loader In addition to XY and grid data, you can load text and geometries in Tecplot ASCII (.dat) format or Tecplot (.plt) format. To do this, choose and then from the menu.
For detailed information about loading your data, see Loading XY Data and Loading Grid Data. For details on each type of file that Tecplot RS supports, refer to Tecplot RS Files.
-
-
Set up your initial plot by choosing a plot type.
To do this, once you have loaded your data, choose from any of the following plot types (by using the sidebar or the menu):
-
XY Plots Tecplot RS includes the following types of XY plots:
-
XY Variables XY Variable plots depict a single x-axis (independent) variable with up to five y-axis (dependent) variables. The axis variable selections are applied to all entities (such as wells, fields and groups).
-
XY Entities XY Entity plots depict an entity or group of entities plotted for single XY axes variable pair.
-
XY Subsets XY Subset plots allow you to view all of the components of a single well, user group or branch at one time (for a single variable).
-
XY Freestyle Plots XY Freestyle plots allow you to manually specify the components of your plot.
-
Custom XY Plots XY Custom plots allow you to define a set of plots in which you select the variables to plot and the order they should appear.
-
XY Custom Entities XY Custom Entities plots combine XY Custom and XY Entity plots. As with XY Custom plots, you can select the variables to plot and the order they should appear. XY Custom Entities expands this function by allowing you to plot multiple entities.
-
RFT Plots RFT plots display observed or simulated values at one or more depths along a well at a given time.
-
Completion Profiles Completion Profile plots display variables versus level (completion) at a single point in time.
-
-
Flow Tables Flow Tables contain an N-dimensional array of bottom hole pressure (BHP) values plotted for N-independent variables. BHP is shown on the Y-axis of the plot.
-
Grid Plots Tecplot RS includes 2D and 3D Grid plots. For further discussion of these plot types, see Basic Grid Plots.
-
Paper Layout Use the Paper Layout plot type to control the styles of your plot frames, headers and footers on the paper for display or printing.
After selecting your plot type, use the sidebar to customize the variable and entity settings for your plot type.
-
-
Optional Perform data manipulation.
Tecplot RS provides several methods for you to manipulate and customize your data, including:
-
Filtering For XY plots, use filtering and selection sets to display only entities that meet your criteria (such as a water production rate threshold). Refer to Filters, Selection Sets, Groups, Well Patterns, and Branches for additional information.
-
For XY plots, use the comparison option to display differences between multiple data files. Refer to Comparing XY Data for additional information.
-
Equations Use the equation dialogs to create or modify variable values directly in Tecplot RS. Refer to XY Equations and Grid Equations to learn about these features.
-
-
Optional Incorporate derived objects or additional plot views.
In 2D and 3D Grid plots, you can:
-
Add multiple layers to your plot, such as a contour layer, wells or bubbles (see Basic Grid Plots).
-
Customize the view of your grid plot using pointer tools and the options in the menu.
-
Add alternate views of the data, such as a histogram (see Grid Plot Controls for more information).
In 3D Grid plots, you can also:
-
Create custom inside views (see Inside Views).
-
Create custom slices (see Inside Views).
-
-
Output your final plot(s).
Once you have completed your plot, you can output the plot or data with any of the following methods:
-
Printing Choose from the menu to print your plot. Refer to Printing and Exporting for additional information.
-
Animation Click the
 button in the
sidebar to open the Auto-Export dialog to export an animation of your
plot(s). Refer to
Printing and Exporting for additional information.
button in the
sidebar to open the Auto-Export dialog to export an animation of your
plot(s). Refer to
Printing and Exporting for additional information.
You can also use the Paging: Animation and Scrolling Controls in the sidebar to animate your frames on the screen.
-
Export Choose from the menu to export your plots to a graphics file. See Printing and Exporting for additional information.
-
Copy Plot to Clipboard (Windows platforms only) Choose from the menu to add the active frame to your clipboard for pasting into another program, such as Microsoft Word or PowerPoint.
-
Write Data to a File There are several methods for writing your data to a file that include the data in simulator input.
-
Layout Package File Choose and then from the menu to create a Tecplot Layout Package file. This is the best way to share plots with users who have Tecplot 360 or Tecplot Focus but not Tecplot RS. Refer to Saving a Tecplot Product File for additional information on layout package files.
-
For XY plots, choose from the menu to output a comma-separated value (csv) file of your XY data.
-
For Grid plots:
-
Use the Extract Data by Cell dialog (accessible by choosing from the menu) to save information about the cells in your plot and output it either as a .csv file or as sector data (to a .txt file). Refer to Extract Data by Cell for additional information.
-
Use the Extract Data by Well dialog (accessible by choosing from the menu) to save cell information for a well or group of wells to .csv file. See Extract Data by Well for more information.
-
Use the Property Modifier dialog (open by choosing ) to output your data based on the value blanking properties and/or any variable modifications. This function outputs an ASCII file that can be used by the VIP, Eclipse, or CHEARS simulator. Refer to Property Modifier for additional information.
-
Use the Modify Wells dialog (open by choosing ) to create and modify node locations and then output the adjusted data to an ASCII data file. Refer to Well Editor for additional information.
-
-
Retrieving Your Plot
Whenever you load data into Tecplot RS, you are working within a project. In order to quickly return to your plot later, you can save your project. Saving and reusing your project makes make working with data more efficient, while taking up only trivial file space. When you save your project, Tecplot RS creates a simple ASCII text file and writes a macro to represent the loaded data, plot type, and many other plot characteristics. Later, to get back to your previously created and saved plot, just open the project. Tecplot RS will run the ASCII file as a macro to retrieve your previous plot.
To save your project, choose or from the menu.
After saving your project and then making further changes to your plot, to update your project to the current state of your plot, choose from the menu.
Refer to Projects for additional information.
Viewing Data Set Information
You can view information about the currently loaded data in the active frame in the "Data Set Information" dialog. To access this dialog, you must have data loaded. Then click on a frame to make it active and choose from the menu.
The "Data Set Information" dialog that appears gives summary information about the data set, including the variables names and minimum and maximum values of each variable.
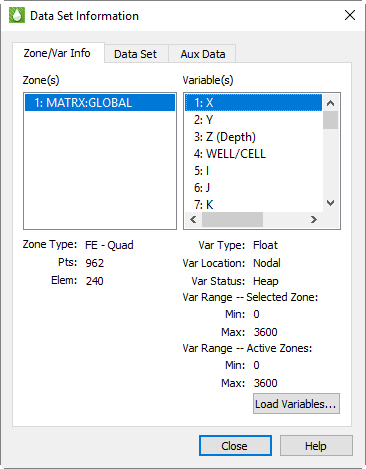
Zone/Variable Info Page
The Zone/Variable Info page of the "Data Set Information" dialog contains the following information.
-
Zone(s) This page lists all zones included in the data set.
-
Zone Type (Ordered or Finite Element, FE, data) The Zone Type field displays the type of zones selected in the Zone(s) box. For ordered data, index values for IMax, JMax, and KMax follow this information (described following). Finite element (FE) data includes the element type, number of points, and number of elements.
-
IMax (ordered data) This indicates the IMax value of the selected zone.
-
JMax (ordered data) This indicates the JMax value of the selected zone.
-
KMax (ordered data) This indicates the KMax value of the selected zone.
-
Pts (finite element data) This indicates the number of data points in the selected zone.
-
Elem (finite element data) This indicates the number of elements in the selected zone.
-
-
Variable(s) The Variable(s) box lists all variables by number, with their names.
-
Var Type The next line displays the type of data of the selected variable in the Variable(s) field.
-
Var Location Indicates if variables are located at nodes or cell-centers.
-
Var Status Use the Var Status field in the dialog to determine the status of the current variable. The variable status can indicate the variable passivity, lock state, and additional system state information.
-
Var Range - Selected Zone This control displays the minimum and maximum values of the selected variable in the selected zone.
-
Var Range - Referenced Zone This control displays the minimum and maximum values of the selected variable for all referenced zones.
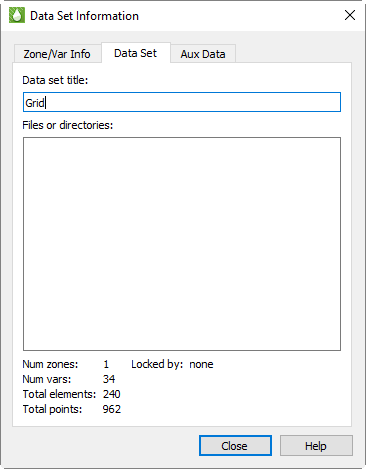
Data Set Page
The Data Set page provides information about your data set, including: title, filenames, number of zones, variables, elements, and lock status.
The following information can be found on the Data Set page:
-
Data Set Title Enter a title for the current dataset, or edit an existing title. The default is the result of concatenating the titles specified in each Title record encountered in the data files making up the dataset.
-
Data File(s) Lists the names and paths of all external data files making up the current dataset.
-
Num Zones Number of zones in the dataset.
-
Num Vars Number of variables in the dataset.
-
Total Elements Total number of elements in the dataset.
-
Total Points Total number of points in the dataset.
-
Locked By This field will inform you if the current dataset has been locked by an add-on. Add-ons can lock a dataset which in turn prevents you from deleting zones or deleting the last frame associated with the dataset.
Auxiliary Data Page

Auxiliary data, or meta data attached to zones, data sets, or frames, displays in the second page of the Data Set Information dialog.
This page includes the following information.
-
Show Auxiliary Data Use this menu to display auxiliary data for a zone, data set, frame, variable, line map, or page.
-
Data Name/Value Use this menu to choose to display either the names or values of any auxiliary data.
You can use the Tecplot 360 Data Format Guide (available at the Tecplot Web site) to learn how to create a data file that includes auxiliary data.