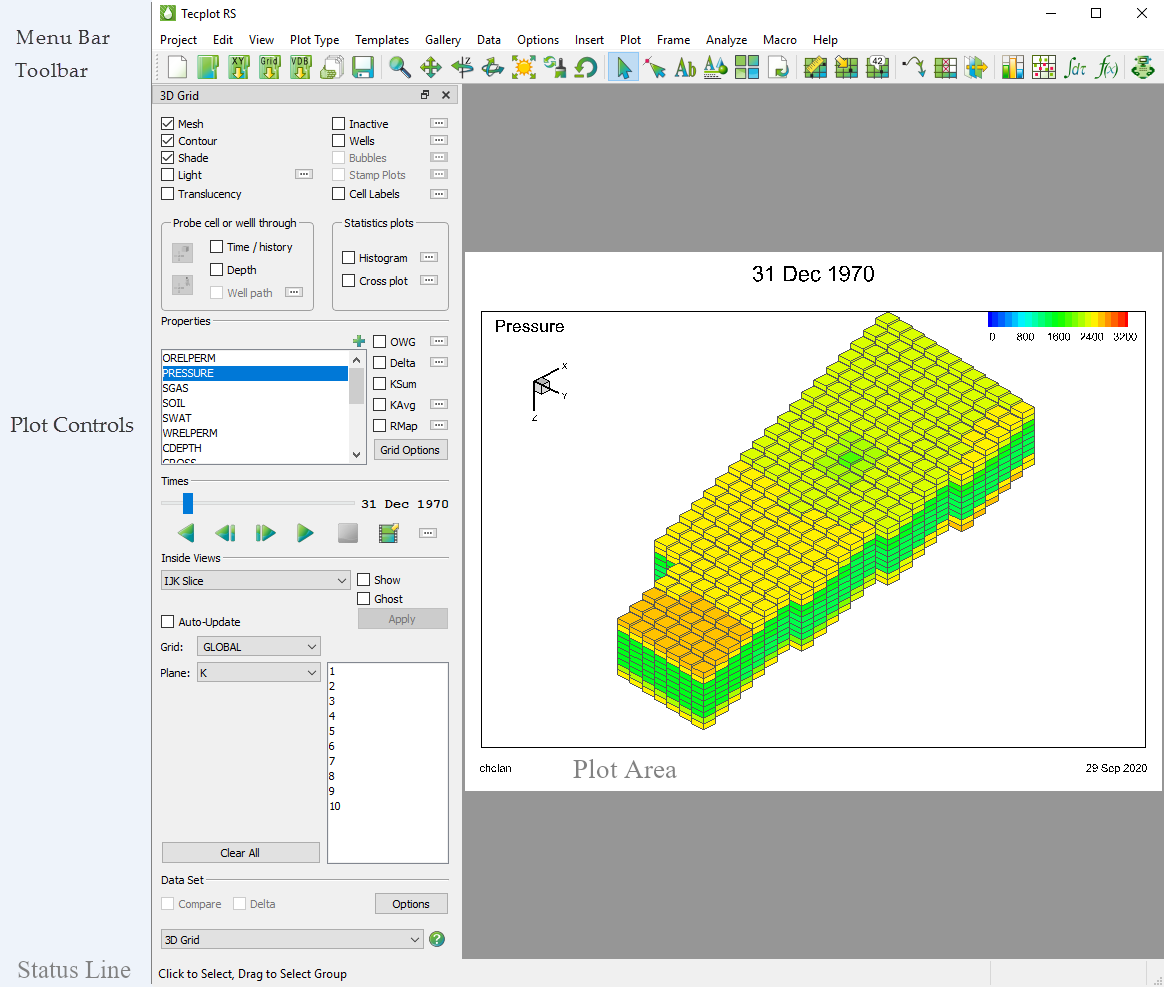
Five major sections make up the Tecplot RS workspace, as you can see when you launch Tecplot RS:
Refer to the following sections to learn about each area of Tecplot RS. You can think of the five sections like this:
• View your plots in the plot area.
• Use the menu bar for systematic access to almost every feature in Tecplot RS, and for feature configuration dialogs.
• Use the toolbar for quick access to accomplish the common tasks in your workflow.
• Use the sidebar to configure your plot and its settings.
• Watch the status line for helpful information about your current task.
The plot area makes up the largest space of the Tecplot RS environment. All created plots appear in this area, inside one or more frames. Tecplot RS considers each visible measure of the workspace as a page. The current state of the plot workspace, including the data files loaded, the plot type chosen, the templates applied, and most attributes of your plot, make up a project.
By default, the plot area contains one empty frame. Frames, inside the plot area, contain all the elements of your plot. Your plot can contain one or more frames, and you can independently size and position each frame in your plot area (although most plot types will revert to standard frame layout when you change plot type). Because most items in a plot scale relative to the frame by default, you can create layouts that will automatically adjust to different paper sizes (for printing), or resize frames to add an extra image. Tecplot RS displays the frame background as white; you can customize this in the Frame menu. To learn more, see Section 3 - 1 “Using Frames”.
Pages
Usually, Tecplot RS allows only one page, or visual measure of the workspace, in the workspace. However, when you are using the XY Freestyle plot type, you can add additional pages to your project. See Section 4 - 8 “XY Freestyle” for more information.
Projects
Tecplot RS creates projects as very small files that keep track of the work done in your plots so you do not have to repeat work to retrieve a previously created plot. Learn more in Chapter 22: “Projects”.
The Tecplot RS menu bar appears across the top of the Tecplot RS workspace. Each menu provides access to various related Tecplot RS functions and their settings.

Tecplot RS’s features are organized into the following menus:
• Project When you use the Tecplot RS interface, you are always working within a project. The Project menu enables you to save your project, open a new one, load data files into your project, manage loaded data, print and export your project, and more. To learn more about projects, see Chapter 22: “Projects”.
• Edit Use the Edit menu to cut, copy, paste, or clear objects in your project. You can also copy your plot to your operating system’s clipboard to quickly export it. To read about these functions, see Section 3 - 3 “Using the Edit Menu”
|
|
 Cut
Cut.
• View Use the View menu to manipulate your perspective of your data, including scale, range, and rotation. You can also use the View menu to copy and paste views between frames, choose whether to display the sidebar or menu bar, and more.
The View menu includes the following convenient sizing options:
• Fit Everything The Fit Everything control resizes a plot so that all data points, text, and geometries fit visibly in the frame.
• Fit Data Choose “Fit Data” to fit all the loaded data points visibly in the frame.
For more information about controls in the View menu, see Section 3 - 2 “Changing the View”.
• Plot Type With the Plot Type menu, you can control which plot type to display. For more information, see Plot Types.
• Templates With the Templates menu, you can save or apply templates to your plot. To learn about templates, go to Section 23 - 2 “Templates”.
• Gallery Provides access to plot settings you’ve saved, as described in Section 23 - 3 “Plot Gallery”.
• Data Use the Data menu to create, manipulate, and examine data. In Tecplot RS, you can manipulate your data through blanking, probing, extracting data, and creating or altering variables.
• Options With the Options menu, you can control the attributes of your workspace, including the plot, display, and performance attributes. Learn more in Chapter 28: “Customization”.
• Insert Use the Insert menu to add text, geometries (polylines, squares, rectangles, circles, and ellipses), or image files to your plot. Learn more in Section D - 4 “Adding Text”, Section D - 5 “Adding Geometries”, and Section D - 6 “Adding Images”.
• Plot Use the Plot menu to control variable assignments and streamtrace attributes in your plots.
• Frame Use the Frame menu to create, edit, and control frames in your plot. To learn more, see Section 3 - 1 “Using Frames”.
• Analyze Go farther understanding your data with the advanced features available in the Analyze menu. Read more in Chapter 20: “Data Analysis”.
• Macro The Macro menu controls the ability to record or play macros. Read more in Chapter 25: “Macros: Task Automation”.
Help The Help menu gives access to information about Tecplot RS. Choose “Tecplot RS Help” from the Help menu to view specific, complete help articles about features or operations within Tecplot RS. By choosing “About Tecplot RS” from this menu, you can obtain specific information about your license.
The Plot Controls sidebar appears along the left side of the Tecplot RS window and provides easy access to modify plot settings. Although some operations use dialogs, you can control most inputs and make plot modifications directly in the sidebar.
You can un-dock the Plot Controls sidebar by dragging its title bar to a new position. To put the Plot Controls back on the side of the workspace, double-click on its title bar (the region that displays the words “Plot Controls”). Or you can drag its title bar to either side of the workspace and let go, and it will snap into place.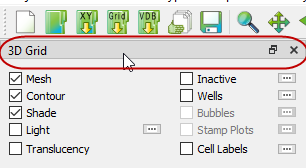
While the sidebar contents depend on the plot type displayed, many regions of the sidebar display for multiple plot types and serve common purposes in Tecplot RS, as discussed in the following sections.
The layer controls at the top of the sidebar set the display of various drawing layers in your plot. The control must be checked (active) to display the corresponding layer. You can choose to have the controls applied on a frame-by-frame basis (giving you the ability to turn off the mesh on one frame and have it on in a second), or have them applied to all frames in a multi-frame plot. To investigate these settings, look in the Multi-Frame Options dialog.
The plot layers available depend on the active plot type. Generally, one set of controls displays for XY plot types, and a different set of controls displays for grid plot types. Several plot layers that display for grid plot types display only for 3D Grid plots. For additional plot layer information, review the chapters corresponding to each plot type.
Paging: Animation and Scrolling Controls
A series of animation and scrolling buttons display in the sidebar for most plot types.
•  and
and  (Next and Previous) Retreat or advance a single step.
•  (Play) Cycle through all entities in the list or play through all time steps in the data. The play list normally begins at the current entity or time step and progresses to the final item in the list (or time step in the data).
•  (Reverse Play) Click the Reverse button to view the animation sequence in reverse.
•  (Stop) Click the Stop button to interrupt the animation process.
•  (Export) Click the Export button to launch the Auto-Export dialog for a variety of output choices. See Exporting an Animation or Group of Images for more information.
•  (Details) Click the Details button to launch the Time Options dialog (2D or 3D Grid plot only). Similar Details buttons in other locations of the interface access other settings dialogs.
Not every button is available for every plot type, and the functions may differ slightly according to the different plot types.
|
|
 Use the
 Tecplot RS includes a toolbar of buttons to provide quick access to the most important steps in your workflow, and most of these buttons also appear in the sidebar. To learn more about these buttons, see Section 1 - 3.4 “Toolbar”. Hover your pointer over each button to see that button’s tool tip.
Whenever you see the Plus button,  next to a list in the sidebar or a dialog, you can click this button to open an expanded dialog of the list. To find an item in the list more easily, you can type letters in the Filter field at the top of the list. Only items that include those letters in that order will appear in the expanded list. For example, to display only items with the word “well” in their name, type “well” into the Filter field.
 The current plot type displays at all times in a menu at the bottom of the sidebar. This reflects the plot type chosen in the Plot Type menu, and you can change the plot type in either place.
Tecplot RS includes the following plot types.
• XY Plots Tecplot RS includes eight specific types of XY plots, each with smart defaults to optimize different types of data or plot specifications:
• XY Variables XY Variable plots depict a single independent (x-axis) variable with up to five dependent (y-axis) variables. The axis variable selections apply to all entities (such as wells, fields and groups).
• XY Entities XY Entity plots depict an entity or group of entities plotted for a single XY axes variable pair.
• XY Subsets XY Subset plots allow you to view all of the components of a single well, user group or branch at one time (for a single variable).
• XY Freestyle XY Freestyle plots allow you to manually specify the components of your plot.
• Custom XY Plots XY Custom plots allow you to define a set of plots for which you can select the variables to plot and the order in which they appear.
• XY Custom Entities XY Custom Entities plots combine XY Custom and XY Entity plots. As with XY Custom plots, you can select the variables to plot and the order they should appear. XY Custom Entities expands this function by allowing you to plot multiple entities.
• RFT Plots RFT plots display observed or simulated values at one or more depths along a well at a given time.
• Completion Profiles Completion Profile plots display variables versus level (completion) at a single point in time.
• Flow Tables Flow Tables contain an N-dimensional array of bottom hole pressure (BHP) values plotted for N-independent variables. BHP is shown on the Y-axis of the plot.
• Grid Plots Tecplot RS includes 2D and 3D Grid plots. For further discussion of these plot types, see Chapter 13: “Basic Grid Plots”.
• Paper Layout Use the Paper Layout to control the styles of your plot frames, headers and footers on the paper for display or printing.
Tecplot RS includes a toolbar of buttons to provide quick access to the most important steps in your workflow. By default, the toolbar appears below the menu bar, but you can move the toolbar to whichever edge of the application window you find most useful.
To move the toolbar to a new location, drag the left edge of the toolbar to the new location. Drag it to an edge of the Tecplot RS application window to dock the toolbar on that edge.

You can use these buttons to control the pointer mode, execute an action, or gain quick access to a popular dialog. Hover over each button for a tool tip about that button.
The toolbar buttons are organized into common workflow steps.
The first group of tools control bringing your data into Tecplot RS with minimal effort so that you can visualize it in your plot.
 Use the Create Project button to begin a new project in Tecplot RS.
A project is the highest level of organization in Tecplot RS; everything you do in Tecplot RS happens inside a project, in which you can save plots and groups of data to easily come back to later. A Project file is small, taking up very little space (because it consists of an XML macro file that Tecplot RS runs when you open the project to replicate your previous work on your plot).
 Use the Open Project button to quickly return to a previously saved project. With this button, you can browse to a saved project. You can also use the Project menu to quickly return to a listed recent project.
Load XY Data, Load Grid Data, Load VDB Data
 With the three Load Data buttons, you can quickly open the dialog to load either XY or grid data into your project. Click the Load XY Data button to load XY data, click the Load Grid Data button to load grid data, or click the Load VDB Data button to load data from a Virtual Database (VDB) folder.
|
|
 The Manage Data button opens a dialog with which you can manage your loaded data, such as choosing which data set is active. (This is useful if you have more than one data file loaded.) To learn more about the Manage Data dialog, go to Basic XY Plots: Section 4 - 2 “Managing XY Data”.
 Save the current state of your open project by clicking the Save Project button. This way, you can quickly return to the exact data, settings, and view that you are working with when you save your project. To learn more about the value of using projects, see Chapter 22: “Projects”.
The second group gives you the ability to change the view of your data.
 With the Zoom tool you can control how much of your plot fills the frame by zooming into and out of your plot.
• Click the Zoom tool on an area in your plot to zoom in, centered around the position that you clicked.
• Hold down the Ctrl key while clicking the zoom tool to zoom out, centered around the position that you clicked.
• Drag the Zoom tool in your plot to create a rectangle around the desired view area. Tecplot RS will fit the selected rectangle into the frame.
• To zoom the entire paper of the Tecplot RS workspace, hold down the Shift key while dragging the Zoom tool in your plot, creating a rectangle around the desired view area. Tecplot RS will resize the plot so that the longest dimension of the zoom box fits into the workspace. You can fit one or all frames to the workspace by using the “Fit Selected Frames to Workspace” or “Fit All Frames to Workspace” options in the View menu (after choosing “Workspace” in the View menu).
|
|
3D mouse - Tecplot RS also supports a 3D mouse, an input device that allows zooming (and translation and rotation) of 3D plots with a touch. You do not need to activate the Zoom tool to use the 3D mouse for zooming. Simply push the mouse’s cap toward or away from you to zoom. Hold the Alt key while zooming with the 3D mouse to switch the zoom method (see “Input Devices” on page 17 for details).
Avoid tilting the mouse cap, as this may induce unintended rotation.
To return to the previous view, choose “Last” from the View menu.
 Use the Translate tool to reposition your plot within the frame. With the Translate tool, drag your pointer to move your plot within its frame. Hold down the Shift key while dragging with the Translate tool to move the paper within the Tecplot RS workspace.
|
|
 You can use the pointer to “shift” the view within the frame. Drag the right pointer button anywhere in the frame to drag the view left, right, up, or down.
3D mouse - Tecplot RS also supports a 3D mouse, an input device that can be used to translate 3D plots at any time with just a touch, regardless of the tool or mode selected.
• Pull the mouse’s cap up or push it down to translate up or down on the screen.
• Move the mouse’s cap left or right to translate left or right on the screen.
Avoid tilting or rotating the mouse when using these motions to avoid rotating the plot.
 Click the Z-axis Rotation button and drag the pointer in your plot to rotate it about the Z-axis.
|
|
 Click the Rollerball button to rotate the plot freely about all axes. After clicking the button in the sidebar, use the left pointer button to “roll” the ball in any direction.
|
|
3D mouse - Tecplot RS also supports a 3D mouse, an input device that can be used to rotate 3D plots at any time regardless of the tool or mode selected. The axis of rotation is relative to the screen rather than to the data.
• Tilt the mouse’s cap forward or backward to rotate around the screen’s X axis, as if rolling toward or away from you.
• Twist the mouse’s cap clockwise or counterclockwise to rotate around the screen’s Y axis, as if on a lazy susan.
• Tilt the mouse’s cap left or right to rotate around the screen’s Z axis, like the hands of a clock.
 With the Lighting tool (available for 3D grid plots), you can adjust the shading to indicate the direction of the light source. To accomplish this, click on the Lighting tool, and then drag on your plot to adjust the light source. Make sure the Light layer is toggled on in the sidebar in order to see the effect.
You can see when you have the Lighting tool active, since the cursor changes to a moveable sun as well. To learn more about the light source feature, see Chapter 14: “Lighting Layer (3D Grid plots only)”.
 Click the Redraw button to redraw all frames in your workspace. Tecplot RS sets the redraw mode to automatic (your plot redraws automatically when you make a change), so the Redraw button is seldom needed. However, you can use it to refresh the view if something interrupts the drawing process, or during macro recording.
|
|
 To restore your plot to its initial view, click the Reset View button. This will return the plot to the initial settings. In a 3D plot, this button restores to the saved Custom 3D View, rather than to the default view, if one exists in the current project. (See “Custom 3D View” on page 263 for further details.)
|
|
With the next group of toolbar buttons you can make adjustments to your plot, such as adding text or arranging frames of data.
 Use the Selector tool to select objects in your workspace. This tool is the most multi-purpose of the tools. You can often use it in combination with other tools. For example, after inserting text, use the Selector tool to double-click on the text to reopen the Text Details dialog and edit the text.
You can select and translate the following objects using the Selector tool:
• Frames
• Text and geometries
• Contour labels
• Legends
To select an object and open that object’s settings dialog (if available), double-click on the object with the Selector tool.
 Use the Adjustor tool to perform any of the following modifications to your plot and data:
• Location of individual data points in a grid plot (2D Grid plots)
• Values of data set variables at a particular point (XY plots)
• Length or placement of individual axes (2D grid and XY plots)
• Spacing between an axis label and its axis (2D grid and XY plots)
• Shape of a polyline
For all other scenarios, the Adjustor tool acts the same as the Selector tool.
|
|
To use the Adjustor tool, click to select the point you wish to adjust, and then drag the Adjustor from the point to the desired location.
|
|
 Use the Insert Text tool to add text to your plot. To learn more about adding text to your plot, see Section D - 4 “Adding Text”.
 Click this button to launch the Plot Options dialog, with which you can customize many plot settings. Refer to Appendix F: “Plot Options” for additional information.
 Click this button to launch the Multi-Frame Options dialog, with which you can customize the arrangement of frames in your workspace. Refer to Multi-Frame Options to learn more about this feature.
 With the Update Paper Layout button, you can set style or positioning changes in the current plot type as the new default for all plot types. For example, if you wish to change the position of the legend for all plot types, use the selector tool to move the legend in the current plot type and then click the Update Plot Layout to make this position the new default. Now when you switch plot types, the legend will appear in the new position, rather than reverting to the old default position. Refer to Section D - 3 “Modifying your Paper Layout” for additional information.
With this more advanced group of buttons, you can examine your data or make more complicated adjustments.
 The Measure Distance tool displays the straight-line distance between two points clicked on a 2D or 3D grid in the Tecplot RS status bar. Each pair of clicks sets a start and end point for distance measurement.
 With the Probe tool, you can view variable values of any selected data point.
Click the Probe tool to activate it, and then click in your plot to view variable values at that point:
• To obtain interpolated values of the data set variables at a specified location, click at any point in the data region.
• To obtain exact values for the data point nearest the specific location, Ctrl-click at the desired location.
See Section 1 - 5 “Data Queries” and Chapter 16: “Data Probing” to learn more.
|
|
 For XY plot types, when you move into the axis grid area, a vertical or horizontal line augments the pointer cross hair, depending on whether you are probing along the X-axis or the Y-axis. You can change the axis to probe simply by pressing X to probe the X-axis or Y to probe the Y-axis.
 The Quick Probe tool, available in 2D and 3D Grid plots, lets you see the value of the contour variable at the probed point. Instead of displaying a dialog, as the Probe tool does, this tool quietly displays the coordinates and probed value in the status bar at the bottom of the Tecplot RS window. See Chapter 16: “Data Probing” to learn more.
 Click this button to activate the Streamtrace tool, with which you can add a streamtrace interactively by clicking in your plot. Drag to add a rake of streamtraces. Choose the number of streamtraces to include when adding a rake by prefacing the dragging with pressing a number (1-9) on the keyboard. See Chapter 17: “Streamtraces” for more information.
 Clicking this button launches the Cell Blanking dialog. Cell blanking allows you to remove data points above or below a specified threshold. Refer to Section 18 - 3 “Cell Value Blanking” and Section 18 - 4 “Pick Blanking” for more information.
Property Modifier
 This button opens the Property Modifier dialog, which allows you to create an ASCII file to use as input into reservoir simulators, optionally changing the values of properties throughout the entire grid or in a subset. See Section 21 - 1 “Property Modifier” for more information.
 Click the Histogram button to display a histogram of your data in the Tecplot RS workspace. For more information, see Section 20 - 1.1 “Histograms”.
 Click the Cross plot button to display a quick cross plot of your data in the Tecplot RS workspace. For more information, see Section 20 - 1.2 “Cross Plots”. You cannot view a cross plot and a histogram at the same time.
 This button opens the Integration dialog, with which you can run integrations on your data.
 Use the Calculate button to open the equations dialog corresponding to the current plot type (either the XY Equations dialog or the Grid Equations dialog). With this dialog, you can use equations to create new variables that are expressions of existing variables (for example, PRESSURE divided by SOIL).
With the final button, you can automate repetitive processes to save time analyzing additional data.
Play a Macro
 Use the Robot button to quickly browse to an existing macro and play it.
Template and Filter Data
Although we do not have toolbar buttons for this section, you may wish also to apply templates and/or filters to customize your output.
To create or edit templates, switch to the Paper Layout plot type. To apply a template, choose “Apply” from the Templates menu. To learn more about templates, see Chapter 23: “Saving and Reusing Views and Plots”.
To apply filters to your data, you can use the Grid Equations and XY Equations dialogs from the Analyze Data section of the toolbar.
Export and Interpret Results
Finally, Tecplot RS provides quick access to full views or export options for your data.
To give a full screen view of your data, choose “Toolbar” from the View menu to turn off the sidebar. Choose “Plot Controls Sidebar” from the View menu to turn off the sidebar.
You can export an animation by clicking the Export button in the Times region of the sidebar, or export an image by choosing “Export” from the Project menu or “Copy Plot to Clipboard” from the Edit menu. To learn more about exporting, see Chapter E: “Printing and Exporting”.
The status line that appears along the bottom edge of the Tecplot RS environment displays “hover help”. When you move the pointer over a tool in the toolbar, a button in a dialog, or a menu item, a description of the control appears. The status line also provides a progress bar and information during non-trivial calculations.
During calculations for which the progress bar displays, you can stop the operation by clicking the Stop button in the status line.