The XY Subsets plot type allows you to view all of the components of a single well, user group or branch at one time (for a single variable). It is available for data sets that contain entities with subsets, such as completions, segments, branches and user groups. Completion and segment data depend on the simulator output. You can create User Groups, Well Patterns, and Branches using the User Group/Branch dialog (accessed via the Data menu).
|
|
 You can un-dock the Plot Controls sidebar by dragging its title bar to a new position. To put the Plot Controls back on the side of the workspace, double-click on its title bar (the region that displays the words “Plot Controls”). Or you can drag its title bar to either side of the workspace and let go, and it will snap into place.
In an XY Subset plot, you can view information for one entity at a time. When you select the entity, a plot line is created for each component of the entity.
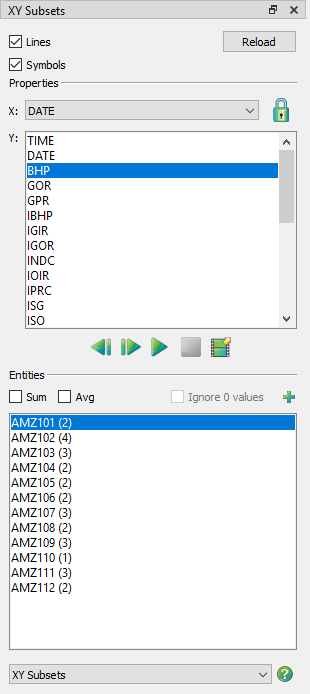
The sidebar for XY Subset plots has the following options:
• Lines and Symbols Use the Lines and Symbols controls to customize your XY plot.
• Reload Click the Reload button at any time to refresh your data set.
|
|
• Variables Use the Variables section of the sidebar to choose axes variable assignments, by clicking on a variable.
• X-axis Use the X menu to choose the X-axis variable. You are limited to a single selection.
• Y-axis Use the Y box to choose a Y-axis variable. You are limited to a single selection.
• Zoom Lock The lock icon next to the X menu can be engaged to hold the active frame’s X-axis range (zoom) when switching to XY Variables or XY Entities plots. It is disengaged automatically when the X-axis variable is changed.
• Scrolling Use the animation control buttons to scroll through the available Y-axis variables. See Paging: Animation and Scrolling Controls for additional information.
• Entities The Entities region of the sidebar displays the available wells, user groups and branches. The number in parentheses after the well name indicates the number of completions and/or segments included in the well.
• Sum Toggle-on “Sum” to sum the currently plotted variable plotted for all chosen entities.
• Avg Toggle-on “Avg” to show the average value for all selected entities.
• Ignore 0 Values When displaying averages, toggle-on to ignore zero values.
The variables selected in the Variables region of the sidebar will display for the selected Entity. Click the  button to launch an expanded, searchable entity list. This helps for long lists. When you have multiple frames displayed, the selected entity displays in the first frame, and subsequent entities in subsequent frames.
Use the scrolling tools (< or >) to move through the entity list. Tecplot RS will plot the same set of variables for each entity. See Paging: Animation and Scrolling Controls for additional information.