To access the Multi-Frame Options dialog, click the Multi-Frames button in the toolbar, or choose “Multi-Frame Options” from the Options menu. The dialog includes the following controls.
• Frame Mode Use the Frame Mode region of the dialog to choose a fram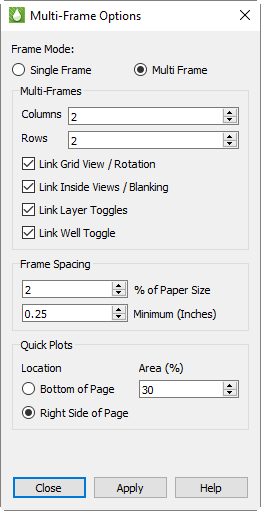 e management mode.
• Single Frame - Tecplot RS will automatically create a single frame for the requested plot type. Any time you change the plot type, Tecplot RS will clear the old frame to display the new plot type.
• Multi Frame - In this mode, Tecplot RS creates multiple frames to display the data for the chosen plot type. Each frame will display a different view of the data set. The variation depends on the plot type. For example, grid plots will display a different variable in each frame, while XY-Variables plots will cycle through the entity list.
|
Tecplot RS cannot fully support frame linking with dual porosity grids loaded. Refer to Grid Options for additional information. |
 Several plot types do not support using multiple frames:
• Multi-Frames The Multi-Frames region of the dialog allows you to control the configuration of frames when using the “Multi Frame” mode. The region has the following options:
• Columns and Rows Use these controls to set the number of frames appearing across and down the paper.
The settings immediately below the Colums and Rows fields let you to link frames, to share settings for view, value blanking, or toggles:
•Link Grid View/Rotation When the views are linked, changing the viewing angle or distance on one frame will make the changes in all frames. Without linking, you can set the views independently in each frame.
•Link Inside Views/Blanking With the inside views and blanking linked, a single set of value blanking and inside views criteria will apply to all frames. When this option is toggled-off, you can set cell and pick blanking constraints and inside views independently in each frame. See Section 18 - 3 “Cell Value Blanking” for a discussion of value blanking, Section 18 - 4 “Pick Blanking” for a discussion of pick blanking, and Section 14 - 3 “Inside Views” for a discussion of inside views.
•Link Layer Toggles Layer Toggles include the Mesh, Contour, Connect, Shade, Translucency, and Light toggles at the top of the grid sidebars, and the Lines and Symbols toggles in the XY plot sidebars. When linked, any change to these toggles will affect all frames. Toggle-off “Link Layer Toggles” to set these options independently for each frame.
•Link Well Toggle When toggled-off, wells will be displayed only in the first frame. When on, wells will display in all frames. Unlike the layer toggles, well display cannot change from frame to frame. This option simply lets you control whether wells are shown in one frame or all. See Section 14 - 1.8 “Wells” for additional information about wells.
• Frame Spacing These options control the spacing between frames and the margin from the edge of the paper to the plot frame(s). The first value sets the spacing as a percentage of the longer dimension of the paper, and may range from 0 to 5. The second value represents a minimum distance in inches, and is independent of the paper size.
For no spacing at all around frames, set both values to 0. Otherwise, you may use both options or just one. If both are set, the frames will be spaced according to whichever setting results in the larger spacing.
• Quick Plots Quick Plots are available in the 2D and 3D Grid plot types. These provide plots of statistical data (histogram and cross plots), plots of value for one cell over all time steps, or one location at each cell depth. See “Additional Data Views” on page 179 for more information on the Quick Plots.
The Quick Plots options allow you to control where these plots are placed in relation to the main plots (below or to the right), and how much of the paper area is allocated for the quick plots (between 20% and 50% of the page).