The Load/Save page of the Plot Options dialog includes methods of saving and retrieving style settings, as well as ways to format your axes.
On the Load/Save page of the Plot Options dialog, you can load or save style settings. This useful function can help you save significant changes for future plots.
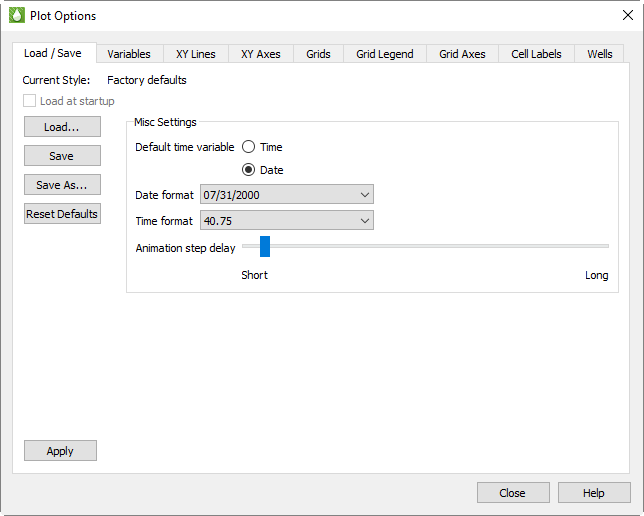
Toggle-on “Load at startup” to load the current style file whenever Tecplot RS is launched. The current style file that will be loaded at startup when that toggle is checked is listed as the Current Style heading at the top of the dialog.
When you save style settings, Tecplot RS stores all plot options settings in a Tecplot Style File (extension .rsstyx). When you save a project file, Tecplot RS embeds the style settings in the project file itself. You can load embedded style settings from a project file by clicking the Load button on the Load/Save page and then choosing the “RS Project with embedded data” file type in the Open File dialog.
Use the Save and Save As buttons to create and updated style files (.rsstyx) which can then be loaded automatically at startup (by toggling-on “Load at startup”) or manually at any time (by clicking the Load button and browsing to the file).
The Reset Defaults button will reset all Plot Options settings to the factory default states.
|
|
 If you would like to associate a style file with a set of XY and/or grid data files, we recommend creating a project file. To create a project file, choose “Save Project” from the
 Previous versions of Tecplot RS saved style files with the .sty extension. To load style files with this extension, choose “Old format style file (*.sty)” from the Files of type menu in the Open File dialog.
F - 1.2 Miscellaneous Settings
Use the Misc Settings region of the Load/Save page of the Plot Options dialog to customize default time display and animation settings. The time and date formatting options apply only to XY plot axes.
You have the following options:
• Default Time Variable - Many simulators record both a Time and Date for the time variable. On XY plots, this selection controls which one (if both are available) that Tecplot RS displays by default on the X-axis. On Grid plots, this selection controls whether time or dates are displayed on the plot title and when choosing the time step.
This setting controls only the default setting. Within the appropriate dialog you can choose any variable for any axis.
|
|
 For additional control of the time increments displayed on your grid plot, use the Details button next to the “Delta” option in the sidebar. See
 • Date Format The Date Format menu provides options of how to format your axis label when displaying dates. Tecplot RS includes the following options:
|
Option |
Description |
|---|---|
|
2000.50 |
The year displays as a four-digit integer, followed by a decimal portion of the year (DEFAULT) |
|
07/31/00 |
Two digits represent the month, two digits represent the day, and two digits represent the year |
|
07/31/2000 |
The day and month are represented by two digits; the year displays as four digits |
|
Jul-31-00 |
The three-letter month abbreviation displays, followed by a two-digit day and two-digit year |
|
Jul-31-2000 |
Three-letter month, two-digit day, four-digit year |
|
31/07/00 |
Two-digit day, two-digit month, two-digit year |
|
31/07/2000 |
Two-digit day, two-digit month, four-digit year |
|
31-Jul-00 |
Two-digit day, three-letter month, two-digit year |
|
31-Jul-2000 |
Two-digit day, three-letter month, four-digit year |
|
07/00 |
Two-digit month, two-digit year |
|
07/2000 |
Two-digit month, four-digit year |
|
Jul-00 |
Three-letter month, two-digit year |
|
Jul-2000 |
Three-letter month, four-digit year |
|
2000/07/31 |
Four-digit year, two-digit month, two-digit day |
|
2000-Jul-31 |
Four-digit year, three-letter month, two-digit day |
|
|
• Time Format The Time Format menu controls the axis label formatting when displaying elapsed time. You can display the time on your axis in any of the following ways:
|
Option |
Description |
|---|---|
|
40.75 |
The number of days displays, followed by a decimal portion of days. |
|
40 18:30 |
The number of days displays, followed by the number of hours and the number of minutes |
|
40 18:30:00 |
The number of elapsed days displays, followed by the number of hours, the number of minutes, and the number of seconds (separated by colons) |
|
|
Animation Step Delay This slide controls the length of the pause between each step of a plot that includes an animation option. If a plot animation cycles too quickly through all the available entities, variables, or time steps, use this slider to adjust the timing.