Compared to the other XY plot types, the XY Freestyle plot type provides greater control over the style and content of your plot. It allows you to create multi-page, multi-frame output, where each frame can contain a unique plot.
For each line map within a frame, you can choose the data file, entity, X-axis and Y-axis variables, Y-axis number, and plot style. For example, you can create a page containing two frames, with the first frame containing content similar to an XY Variables plot and the second frame containing content similar to an XY Entities plot. Within each of those frames, you can manually override the style settings of each line map. However, because of its flexibility, XY Freestyle cannot offer the same level of automation and animation features that other XY plot types can.
The XY Freestyle plot allows plotting entity and variable combinations not possible in other XY plot types. For example, in this plot type, you can plot oil production rate for a group of wells, and include a line map of water injection rate for an associated injector in the same plot.
This plot type also functions well when you would like to compare entities or variables between two or more data files that have different entity or variable names. This often occurs when comparing simulator results and observed data. If the entity or variable names are identical between the files, you may instead want to use the “Compare” toggle in the sidebar for XY Variables or XY Entities plot types (refer to Chapter 10: “Comparing XY Data” for details).
Each XY Freestyle line plot is tied to a particular data set. If you have created complex plots in XY Freestyle and wish to change the referenced file, you can do so using Project>Swap Files. See “Swapping Data Files” on page 146 for further details.
|
|

4 - 8.1 Creating an XY Freestyle Plot
To create an XY Freestyle plot, follow this general procedure:
1.First, load one or more XY data files (refer to Section 4 - 1 “Loading XY Data”).
2.If you wish to use multiple frames on a single page, we recommend that you first visit the Multi-Frame Options dialog (accessed with the  button in the sidebar) to set the default frame layout for new pages. You do not have to do this; XY Freestyle has its own frame manager to allow you to create different frame layouts for each page. However, the options in the Multi-Frame dialog control the initial frame count and layout for each new page of freestyle plots. You will be able change those easily.
3.In general, if you are currently recording a macro, stop. Most steps to create XY Freestyle plots are not recorded in macros; only the plot type and page number are recorded. (Don’t worry: you will still be able to return to any XY Freestyle plot you created as long as you have saved your project file.) Most of the time we recommend that macro recording be turned off when creating XY Freestyle plots. The exception would be if you want to record a macro that, for example, displays each XY Freestyle page in turn and then prints it.
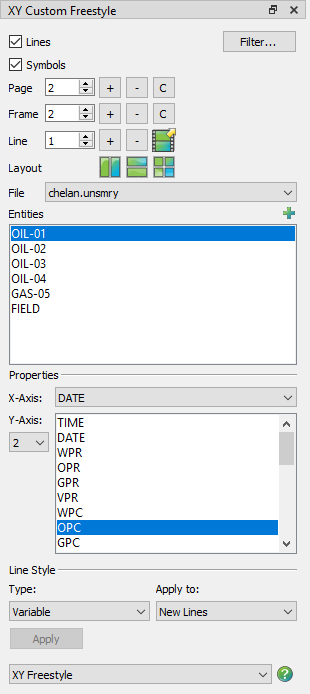
4.Choose “XY Freestyle” from the Plot Type menu or the sidebar.
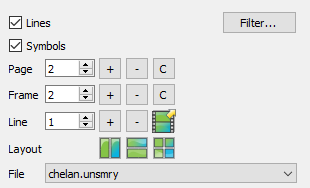
5.Before adding line mapping(s) to the first frame in your plot, check the Type menu in the Line Style region of the sidebar. This region of the dialog allows you to specify how the initial line style is controlled.
Make any changes necessary here before proceeding:
• Variable If you plan to plot multiple variables for the same entity (similar to an XY Variables plot), choose “Variable” from the Type menu. In this case, Tecplot RS will read the initial style settings for each variable from the settings for that variable on the XY Lines page of the Plot Options dialog.
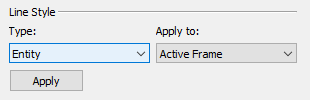
• Entity Otherwise, if you plan to display the same variable for multiple entities (similar to an XY Entities plot), choose “Entity” from the Type menu. In this case, Tecplot RS will read the initial style settings for each entity from the settings for that entity on the XY Lines page of the Plot Options dialog. The settings for a given entity display when “Entity *” (long variable names) or “ST*” (short variable names) is selected in the Variable region of the dialog. (Entity 1/ST1 corresponds to the first entity in your plot, and so forth.) Refer to Section F - 3 “XY Lines” for additional information.
6.Decide how many frames you want displayed on the current page. You may have a different number and layout for each page, and you can change both the number and arrangement at any time. To start, click the [+] button next to the Frame counter until you get the desired number of frames. Then, choose one of the layout buttons to arrange the frames. Finally, choose the frame you want to edit by either clicking on it with the mouse pointer or using the spin control to choose the frame number.
7.If you loaded more than one XY data file, choose the source file for your first mapping from the File menu in the sidebar.
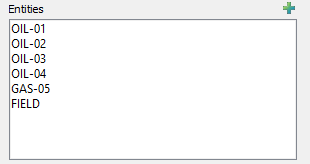
This action populates the Entities list, below, with the entities belonging to the chosen data set.
8.Select the entity for your mapping in the Entities box. To select a specific entity from a long list of entities, click the  button in the upper-right corner of the Entities box to launch an expanded, searchable entity list.
This action populates the Variables list, below, with those variables associated with the chosen entity type.
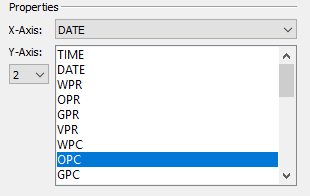
9.In the Variables region of the sidebar, choose the X-axis variable and Y-axis variable. Use the Axis menu to choose the axis number to use for the Y-axis variable.
10.Refer to Section 4 - 8.2 “Customizing the Line Styles for XY Freestyle” for information on changing the style settings for each line mapping.
11.To add additional lines to your plot, click the + button next to Line in the sidebar and repeat steps 6 through 9 for each line.
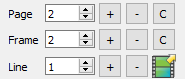
12.To add more frames to your plot, use the +/- buttons next to “Frame” in the sidebar.
Refer to Section 4 - 8.3 “Working With Multiple Pages, Frames and Mappings” for details.
13.To add more pages to your plot, use the +/- buttons next to “Page” in the sidebar.
Refer to Section 4 - 8.3 “Working With Multiple Pages, Frames and Mappings” for details on working with multiple frames.
|
|

14.To save your XY Freestyle plot(s), you must create a project file. Projects contain XML instructions that define the set of XY Freestyle plots. Refer to Chapter 22: “Projects” for details. Your re-loaded project file will include all your XY Freestyle plots, which you can then view and/or modify.
4 - 8.2 Customizing the Line Styles for XY Freestyle
The style of a given line is determined by its settings for both the line and its symbols. The available line styles include color, pattern, length and thickness. The available symbol styles include shape, size, spacing, color and fill-type.
You can customize the styles using either the Plot Options dialog (linked to RS Variables Files) or the Mapping Style dialog. The scope of the style changes depends upon the method used. When you save the style file, you make any changes made in the Plot Options dialog for a given variable or entity available for future sessions of Tecplot RS. Changes made in the Mapping Style dialog apply to the current line only. You can only use the Mapping Style dialog with the XY Freestyle plot type.
Changing Line Styles With the Plot Options Dialog and the Sidebar
When adding a line to your plot, the style of the line depends upon your selection in the Type menu in the Line Style region of the XY Freestyle sidebar. With “Variable” selected, Tecplot RS will use the settings for each variable on the XY Lines page of the Plot Options dialog for each variable’s initial style settings. With “Entity” selected, the initial style settings for each entity will be taken from the settings for that entity on the XY Lines page of the Plot Options dialog. The settings for a given entity are displayed when “Entity *” (long variable names) or “ST*” (short variable names) is selected in the Variable region of the dialog. Entity 1/ST1 corresponds to the first entity in your plot and so forth.
You can change the default settings for variables and entities at any time on the XY Lines page of the Plot Options dialog. Refer to Section F - 3 “XY Lines” for additional information. If you would like to apply any changes to your current mappings, you will need to re-apply them with the Line Style: Apply To option in the sidebar.
You can use the Line Style: Apply To menu to switch between the “Variable” and “Entity” types at any time. You have the option to change the style settings for:
• New Lines Select “New Lines” to apply new style definitions to new line mapping(s).
• Current Lines Select “Current Lines” to apply new style definitions to the line mapping(s) you have selected with your pointer.
• Active Frame Select “Active Frame” to apply new style definitions to all of the lines in the active frame.
• All Frames Select “All Frames” to apply new style definitions to all of the lines in all of the frames on the current page.
For example, if you apply the Entity style to new lines, and then determine that the Variable option would be a better choice, you can update the line to use the new style using the following steps:
1.Select “Entity” from the Type menu in the “Line Style” region of the sidebar.
2.In the Apply to box, select the lines to which you wish the changes to be applied.
3.Click the Apply button.