An XY Variables plot depicts a single x-axis (independent) variable with up to five y-axis (dependent) variables. The axis variable selections applies to all entities. To create an XY variable plot, load an XY data file and choose “XY Variables” from the Plot Type menu in the sidebar.
|
|
 You can un-dock the Plot Controls sidebar by dragging its title bar to a new position. To put the Plot Controls back on the side of the workspace, double-click on its title bar (the region that displays the words “Plot Controls”). Or you can drag its title bar to either side of the workspace and let go, and it will snap into place.
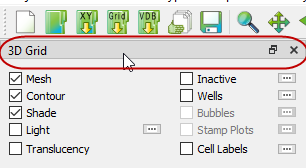
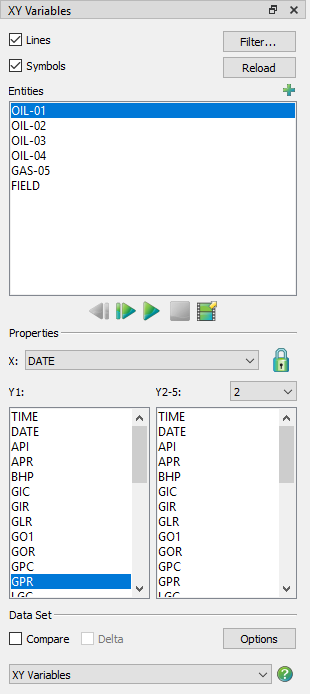
The sidebar for XY Variable plots has the following options:
• Lines and Symbols Use any combination of the Lines and Symbols controls to customize whether to display lines and/or symbols for each line in your XY plot.
• Reload Click the Reload button at any time to refresh your data set.
|
|
• Filter To manage the entities shown in the list, use the Filter button. Refer to Section 7 - 1 “Filtering” for more information.
• Entities The Entities box allows you to select wells and other structures to display. Use the scrolling tools (< or >) to move through the entity list. See Paging: Animation and Scrolling Controls for additional information. To select a specific entity from a long list of entities, click the button in the upper-right corner of the Entities box. This will launch an expanded entity list that you can filter to find an entity.
The variables highlighted in the Variables section of the sidebar will display for the selected Entity.
When you have multiple frames displayed, the selected entity displays in the first frame, and subsequent entities display in subsequent frames.
• Variables Use the Variables section of the sidebar to specify the axes variable assignments.
• X-axis Use the X menu to choose the X-axis variable. Tecplot RS allows only one variable displayed at a time for the X-axis.
• Y1-axis The Y1 box allows you to select multiple variables for Tecplot RS to plot against the Y1-axis. When plotting multiple variables with different value ranges or units, try using two or more Y-axes with different scales.
• Y2-5 Axes Use the Y2-5 menu to specify for which of the available axes you wish to customize the variables. When no variables are selected for an axis, that axis does not display. To deselect a variable, hold down the Ctrl key while clicking on the appropriate variable. Remember, a single variable cannot display on more than one Y-axis.
|
To choose two or more consecutive items Drag your pointer from the first item you wish highlighted to the last item, or click the first one and hold down the Shift key while clicking the last item. To choose two or more non-consecutive items Hold down the Ctrl key and click the desired items. To un-select a single item Use Ctrl-click. |
 To make multiple selections in a box, use any of the following methods:
• Zoom Lock The lock icon next to the X menu can be engaged to hold the active frame's X-axis range when switching the Entity selection on the sidebar. It is disengaged automatically when the X-axis variable is changed.
Data Set The Data Set region of the sidebar allows you to compare data when you have multiple data files loaded. Refer to Chapter 10: “Comparing XY Data” for additional information.
Frame Selection Mode Button
Click the Frame Selection Mode button to change how Entities are assigned to each frame in a multi-frame plot. In a multi-frame plot, clicking the Frame Selection Mode button will show a menu with two available options:
• Sequential This is the default mode in all previous versions of Tecplot RS. Frames are assigned entities starting in the top left frame with the current selection. Entities for additional frames are assigned in sequence from the Entities selected on the sidebar. Clicking the “Next” button will show the next set of N Entities, where N is the number of multi-frames displayed.
• Manual In Manual mode, each frame in a multi-frame plot can be assigned an Entity irrespective of the Entity selected on the sidebar. Entities for a frame can be selected by clicking on the frame and clicking on an entity on the sidebar, or right-clicking on a frame or frame title and selecting an Entity from the context menu.
NOTE: In Manual Frame Mode, the animation buttons are disabled since there is no default set of additional frames as there are in Sequential mode. The export button will only show static images available to export.
If the plot is a single frame, then the Frame Selection Mode button menu will not be available, although you can right click on the frame or frame title to select a new entity for the single frame, in addition to clicking the entity on the sidebar.