You can choose the type of grid display (2D or 3D) in the Plot Type menu, or by using the small menu at the bottom of the sidebar.
2D Grid Plots display one plane (layer) of grid cells at a time. You can choose which plane to plot by specifying both the view (I, J, or K) and the plane index. Radial grids can also display the views at constant R or Theta values.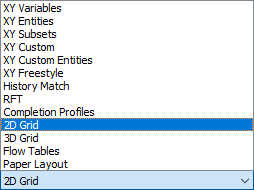
3D Grid Plots show the entire reservoir grid in an orthogonal or perspective view. The initial orientation of the view is preset, but you can easily rotate, zoom, or translate the view.