The Flow Tables function requires familiarity with CHEARS flow table (.flot) files. Flow table plots display the information in one or more CHEARS *.flot files. Flow tables contain an N-dimensional array of bottom hole pressure (BHP) values plotted for N-independent variables. BHP is shown on the Y-axis of the plot. Flow tables also include a dependent variable which Tecplot RS places on the X-axis. (Dependent variable applies to the flow table, not to the Tecplot RS plot.) Flow tables are plotted by creating XY-slices from a combination of independent variable settings.
6 - 3.1 Loading Flow Table Data
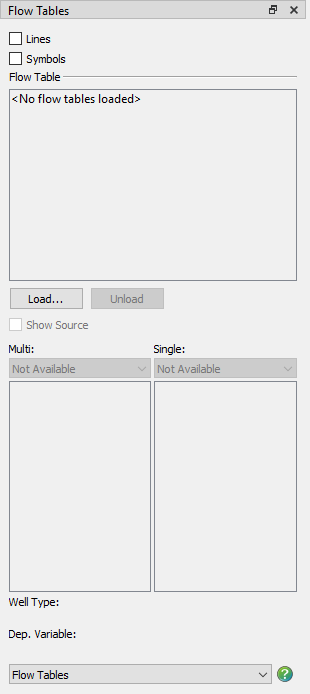
A flow table data set acts differently from other data sets used in the other XY plotting options. Because of their uniqueness, you cannot load them from the standard file loading dialogs. You can access them through the Flow Table sidebar (choose “Flow Tables” from the Plot Type menu).
|
|
 You can un-dock the Plot Controls sidebar by dragging its title bar to a new position. To put the Plot Controls back on the side of the workspace, double-click on its title bar (the region that displays the words “Plot Controls”). Or you can drag its title bar to either side of the workspace and let go, and it will snap into place.
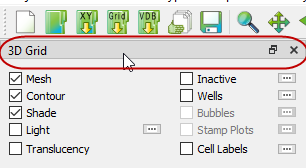
Click the Load button to launch the Read Data dialog. To load a flow table file, select .flot file type. To experiment with flow tables, you can load the chelan.flot data set included in the examples folder of your Tecplot RS installation.
You can load more than one flow table file at a time. If you do, you may find it helpful to toggle-on “Show Source” in the sidebar, below the Load button. This will show the file name along with the flow table number.
You can remove the flow tables with the Unload button in the sidebar.
6 - 3.2 Flow Tables Selections
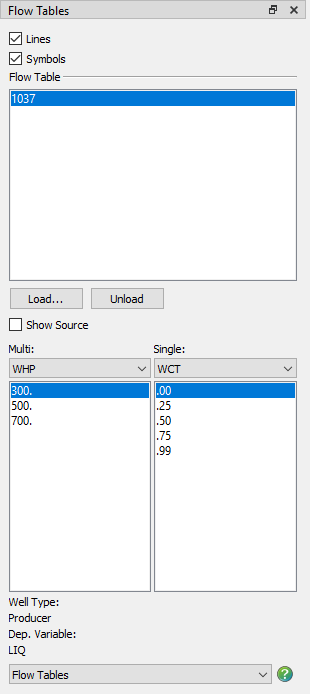
Once you have loaded a flow table data set, the sidebar will display available variables and options.
The data file determines the well type (injector or producer) and dependent variable. The sidebar displays these variables for reference.
Multi
When you select a variable in the Multi menu, the box beneath shows all the associated independent values of the selected variable. From this list, you can select one or more data values. Each will display on the plot using a different line color.
Single
The Single heading can list one or more variables. When you choose one from the menu, the box beneath will display the independent values for that variable.
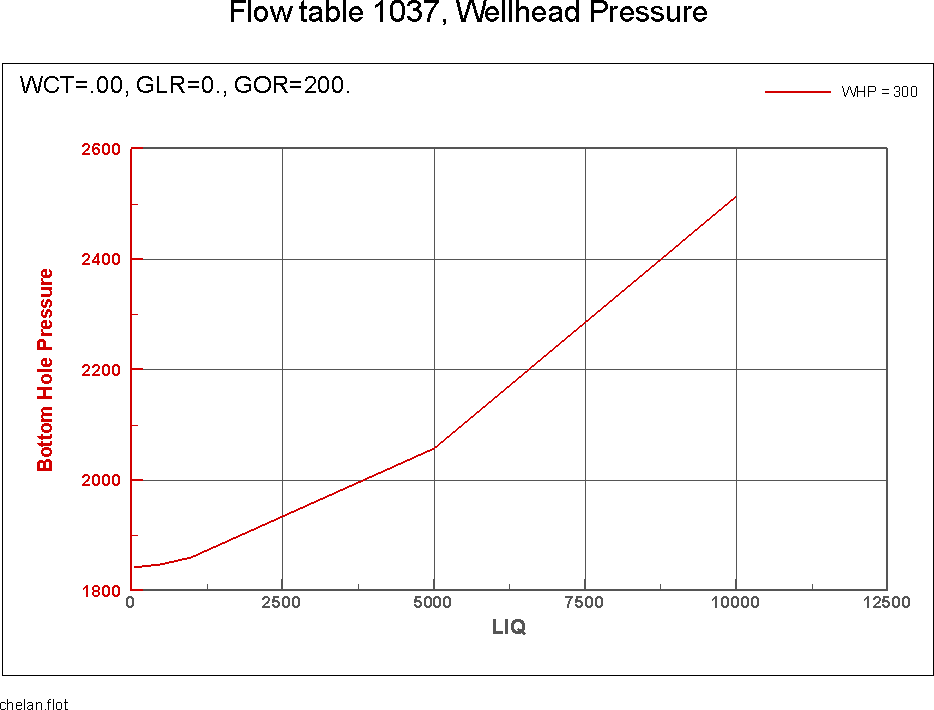
You should choose one value for each of the single variables. These selections will determine the data to be plotted. The plot title will also reflect your variable value choices. For example, if you load the example file chelan.flot, you will see the following plot.
|
|