Use the Time Options dialog to specify a time step increment value and delta display options. To launch the dialog, click the Details button in the Times region of the sidebar, or click the Details button next to the Delta option in the Variables region of the sidebar. This dialog is available for only 2D Grid Plots and 3D Grid Plots.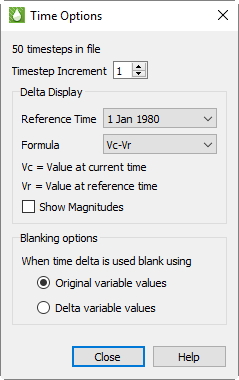
You can set the Time step Increment value to any integer between 1 and 20. The number chosen dictates the number of time steps that each step of an animation will advance, as well as the number of time steps that the Next (>) and Previous (<) buttons advance the plot. To display the most detailed time animation (the highest number of time steps), enter a time step increment value of “1”. To view the animation, use the Play (<<) and Rewind (<<) buttons in the Times region of the sidebar.
The Delta Display region defines the settings used to display delta values on the grid plot (by toggling-on “Delta” in the sidebar). The delta values represent a selected relationship between the solution data at the current time step (set in the Times region of the sidebar) and the solution data at a reference time step (set in the Time Options dialog).
The reference time step, or “Ref Time”, is the time step to which Tecplot RS compares each time increment in the delta value formula.1 This is usually the first time step, but you can choose any time step as the reference time.
Tecplot RS supports several methods of calculating the delta value. Choosing one of the methods from the Formula menu will assign the delta calculation to use that formula.
Methods for calculating the delta value include the following, where Vc indicates the variable value at the current time and Vr indicates the variable value at the reference time:
• Vc-Vr = Variable value at current time minus variable value at reference time (default and previously standard method)
• Vr-Vc = Variable value at reference time minus variable value at current time
• (Vr-Vc)/Vr = Value at reference time minus value at current time, normalized by value at reference time
• (Vc-Vr)/Vc = Value at current time minus value at reference time, normalized by value at current time
Toggle-on “Show Magnitudes”, the last option in the Delta Display region of the Time Options dialog, to use the magnitude (absolute value) of each delta value. This option ignores the direction (+ or -) of the delta value, allowing for greater display resolution.
The grid legend displays the range of variable values, as calculated based on selections in the Time Options dialog. When “Show Magnitudes” is toggled-on, a minimum range of zero displays. If you choose an unnormalized range, the legend will range from the minimum range value (either positive or negative) to the maximum value. If you choose a normalized range, the legend will vary between negative one and positive one (-1 to +1).
|
|
 You can modify the range to any positive or negative values by using the
 When time delta is used blank using:
When time delta is used, blanking will be applied based on either the original variable values or delta values depending on this selection. (Default: Original Values)
Settings in the Time Options dialog will display when “Delta” is toggled-on in the sidebar.
13 - 3.2 Variable Display Controls
Depending on the plot type displayed, two or more controls appear in the sidebar next to the list of variable names. In 2D Grid plot mode, the first two controls (OWG, Delta) will display. In 3D Grid plot mode, all 8 controls display. These selections let you perform specialized computations on the variable values and show the results in the contour display.
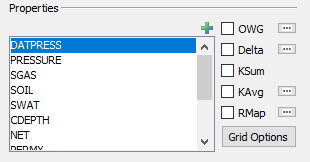
You can only use one of the options at a time. Choosing one will deselect any other. Tecplot RS may disable an option if the active grid does not have the data needed to support that function.
To learn more about the KSum, KAvg, KSum Delta, KSum Avg Delta controls, refer to Section 18 - 5.1 “KSum”, Section 18 - 5.2 “KAvg”, Section 18 - 5.6 “KSum/KAvg Delta Options” respectively.
Standard
If the “Standard” radio button is selected, then the 3D view is unmodified.