An XY Entity plot depicts a set of entities for a single X-axis and Y-axis variable pair. For example, you can compare oil production for a selected set of wells in one plot.
|
|
 You can un-dock the Plot Controls sidebar by dragging its title bar to a new position. To put the Plot Controls back on the side of the workspace, double-click on its title bar (the region that displays the words “Plot Controls”). Or you can drag its title bar to either side of the workspace and let go, and it will snap into place.
|
|
 For all XY Entities plots (including RFT), if XY fracture data is detected, the fracture data will display in a separate dotted line below the matrix data. XY fracture data is detected if the number of XY points is exactly twice the grid K dimension, or if an MFTAG variable is found when reading RFT data.
To create an XY Entities plot, load an XY data file and choose “XY Entities” from the Pot Type menu at the bottom of the sidebar.
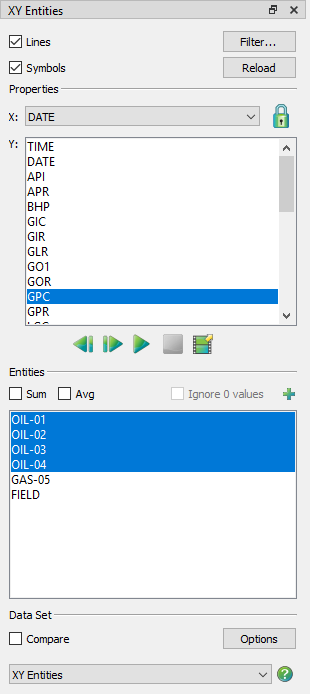
The sidebar for XY Entity plots has the following options:
• Lines and Symbols Use the Lines and Symbols controls to customize your XY plot.
• Reload Click the Reload button at any time to refresh your data set.
|
|
• Filter To manage the entities shown in the list, use the Filter button. Refer to Section 7 - 1 “Filtering” for more information.
• Variables Use the Variables section of the sidebar to specify the axes variable assignments.
• X-axis Use the X menu to choose the X-axis variable. You can choose only one X-axis variable.
• Y-axis Use the Y-axis box to choose a Y-axis variable. You can choose only one Y-axis variable.
• Zoom Lock The lock icon next to the X menu can be engaged to hold the active frame’s X-axis range (zoom) when switching to XY Subsets or XY Variables plots. It is disengaged automatically when the X-axis variable is changed.
• Scrolling Use the animation control buttons to scroll through the available Y-axis variables. See Paging: Animation and Scrolling Controls for additional information.
• Entities The Entities box allows you to select wells and other structures to display.
• Sum Toggling-on “Sum” allows you to sum the variable being plotted for all entities that have been chosen.
• Avg Toggle-on “Avg” to show the average value for all chosen entities.
• Ignore 0 Values When displaying averages, toggle-on to ignore zero values.
|
|
The variables selected in the Variables section of the sidebar will display for the selected Entity. Click the  button to launch an expanded, searchable entity list. This helps for long lists. When you have multiple frames displayed, the selected Y-axis variable displays in the first frame, with subsequent variables in subsequent frames.
• Data Set The Data Set region of the dialog allows you to compare data when you have multiple data files loaded. Refer to Chapter 10: “Comparing XY Data” for additional information.
The settings for “Entity [1-9]” in your RS Variables Files file determines the default styles (for example, line color, and symbol shape) that your plot displays. You can change any of the default styles by either updating the file or changing the settings for “Entity [1-9]” (long variable names) or “ST [1-9]” (short variable names) on the XY Lines page of the Plot Options dialog. Double-click on the line in your plot to bring up the appropriate page of the dialog.
Frame Selection Mode Button
Click the Frame Selection Mode button to change how Variables are assigned to each frame in a multi-frame plot. In a multi-frame plot, clicking the Frame Selection Mode button will show a menu with two available options:
• Sequential This is the default mode in all previous versions of Tecplot RS. Frames are assigned variables starting in the top left frame with the current selection. Variables for additional frames are assigned in sequence from the variables selected on the sidebar. Clicking the “Next” button will show the next set of N variables, where N is the number of multi-frames displayed.
• Manual In manual mode, each frame in a multi-frame plot can be assigned a variable irrespective of the variable selected on the sidebar. Entities for a frame can be selected by clicking on the frame and clicking on a variable on the sidebar, or right-clicking on a frame or frame title and selecting a variable from the context menu.
NOTE: In Manual Frame Mode, the animation buttons are disabled since there is no default set of additional frames as there are in Sequential mode. The export button will only show static images available to export.
If the plot is a single frame, then the Frame Selection Mode button menu will not be available, although you can right click on the frame or frame title to select a new variable for the single frame, in addition to clicking the entity on the sidebar.