14 - 1.4 Lighting Layer (3D Grid plots only)
You can enhance the shading of 3D grid plots by using lighting and translucency layers. To activate the Light layer, turn on the Light control in the sidebar.
Tecplot RS calculates the lighting as though the light source appears as a point of light far from the drawing area (so casting nearly parallel beams, as the sun does on the earth).
 Once you have turned on the Light layer, you can use the Light Source tool to change the position of the light source relative to your plot. To do this, after turning on the Light layer, click the Light Source tool in the toolbar, and drag in your plot to change the light source position. You can also see the light position change reflected on the 3D orientation axes.
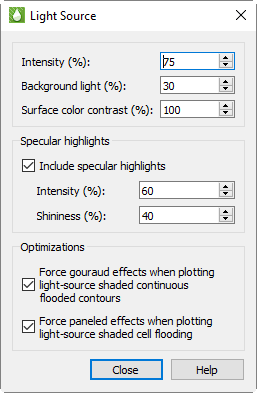
To adjust the effect that the light source has on your plot, click the Details button next to the Light control in the sidebar to open the Light Source dialog. In this dialog you can adjust the following settings.
Lighting Use these controls to adjust how extremely the light affects your plot.
• Intensity Use this control to adjust how brightly the light source “shines” on your plot. A higher intensity value results in a “brighter” appearance. (An intensity of 100% produces maximum contrast between lighted and unlighted areas, and fully lighted areas use the full surface color.)
• Background Light With this control, you can adjust the lighting effect applied to your entire plot, regardless the light source position. A higher background light value results a higher amount of light on all areas of your plot. A background light of 100% results in all areas lighted the maximum amount, and areas not lighted by the directional light source use full surface color.
|
|

• Surface Color Contrast Use this control to adjust the saturation of contour coloring in your plot under the light. A higher value results in more saturated colors. A surface color contrast value of zero results in a white plot before applying lighting effects (the plot will only appear in white and/or shades of gray).
Specular Highlights With this control, you can turn on/off the appearance of reflected light on 3D shaded or flooded objects. This affects all surfaces in your plot receiving light from the light source.
• Intensity The intensity value controls the amount of specular highlights (that is, the amount of reflected light, which controls the amount of whiteness at the peak of the highlight).
• Shininess The shininess value controls how shiny the highlighting is - the size and spread of the highlighting.
Optimization A few combinations of lighting type and plot style may result in slower redrawing of plots (especially larger plots). Tecplot RS provides the choice of which lighting method to use in order to avoid slower redraws. These optimizations are on by default. You may want to turn the graphics cache off before turning off these optimizations for plots with large amounts of data. See Performance Dialog: “Graphics Cache” for details on caching graphics.
• Force Gouraud Effects This control forces gouraud shading under the circumstances described. Gouraud shading achieves smooth lighting by linearly interpolating a color or shade across a polygon. It offers a more continuous and smoother shading than paneled shading, but can result in slower plotting in some cases.
• Force Paneled Effects This control forces paneled shading under the described circumstances. In paneled shading, the color within each cell assigned to each area by shading or contour flooding is tinted by a shade constant across the cell. Tecplot RS bases the shade on the orientation of the cell relative to the light source.
14 - 1.5 Translucency Layer (3D Grid plots only)
As noted previously, you can enhance grid plot shading by using lighting and translucency in your 3D grid plot. To make your plot translucent, enabling you to see the interior of the plot, toggle-on the “Transl” toggle in the Layers region of the sidebar.
|
|