Completion profile plots display variables versus level (completion) at a single point in time. Completions display on the Y-axis. The X-axis scales to encompass the range of variable values.
To create a completion profile plot, you must first load an XY data set containing completions. To determine if a loaded data file contains completions, use the Active Data Set region of XY page of the Manage Data dialog (accessible by clicking the Manage Data button in the toolbar or by choosing “Manage Data” from the Project menu). Refer to Section 4 - 1 “Loading XY Data” for detailed information about loading data files.
|
|
 You can also use the
 Once you have loaded a data file containing completions, change the plot type to “Completions” to begin creating your completion profile plot.
|
|
 You can un-dock the Plot Controls sidebar by dragging its title bar to a new position. To put the Plot Controls back on the side of the workspace, double-click on its title bar (the region that displays the words “Plot Controls”). Or you can drag its title bar to either side of the workspace and let go, and it will snap into place.
The sidebar for completions has the following options: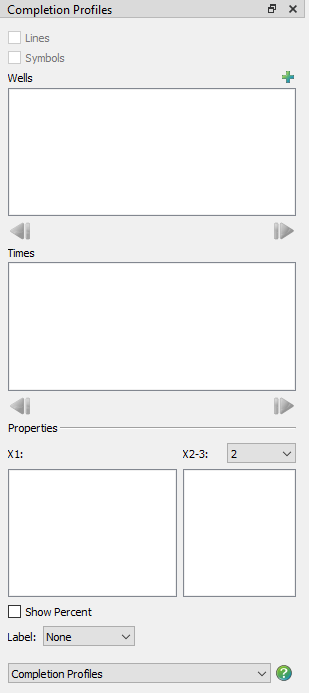
• Wells The list of wells (that displays in the Wells box, in the Wells region of the sidebar) automatically displays only wells that include completion data. Instead of listing each completion separately, this box lists the well name along with the number of completions included in that well in parentheses. Click the  button in the upper-right to launch an expanded, searchable entity list. This helps especially for very long lists.
• Times The available times display in the Times region in the center of the sidebar. Each plot will reflect values at a selected time. The time unit (date or time) to use is determined by a setting in the Miscellaneous Settings region of the Load/Save page of the Plot Options dialog.
• Variables You can choose the variable(s) that Tecplot RS will plot in the Variables region of the sidebar, in the various boxes. You can plot up to three variables at a time. Use the left-hand box to identify the X1 variable and the right-hand box to identify the X2 and X3 axis variables. The bar color matches its associated axis color.
• Show Percent Turn on the Show Percent control to add another X-axis scaled from 0 to 100. The line shows the values at each completion as a percent of the total of all layers.
• Label Use the Label menu to add Depth/Length or K-plane labels to the completion bars in the plot. The labels display in a text box at the end of the bar(s) for each completion.