You can add three types of text to your paper layout:
• Static text As the name suggests, static text does not change. Static text might include your company’s name, address, and telephone number. Refer to Title Options for additional information.
• Dynamic text Dynamic text changes according to the situation. For example, you can insert the date. Tecplot RS also uses dynamic text to label the variable name and entity name, to identify each plot.
• Placeholder text This type of text is used for legends and the orientation axis. The placeholder text will determine the position and style of these items, but the actual object will be displayed only when appropriate. For example, the orientation axis will be shown only on 3D grid plots, and the bubble legend only on bubble plots. The placeholder text is used only to mark the position on the paper layout; on the actual plot, the legend or orientation axis will be shown.
To add text to the paper layout:
1.Click the Text tool button in the toolbar, or choose “Text” from the Insert menu.
2.Click anywhere in a frame to set the location of the text.
3.Use the Text Details dialog that appears to type and modify text and formatting.
To add dynamic text and placeholder text to the paper layout:
1.Make sure the frame in which you want to add the text is active. (Click the frame border to activate the frame if necessary.)
2.Click the desired dynamic text or placeholder in the Dynamic Text list box in the sidebar.
3.Click the Add Text button. The text appears in the middle of the frame.
4.Double-click the text to open the Text Details dialog, then modify styles and options.
5.Click and drag the placeholder text to the desired location on the frame.
Legends
To include legends in your plot frame, use one of the following five specialized placeholder text strings.
|
RS_LEGEND |
Primary legend for grid or XY plots. Always appears on the main plot; will be included in each plot frame of both XY and grid plots if included on the paper layout. |
|
RS_NNCLEGEND |
Shown when non-neighbor connections (NNCs) are visible in grid plots |
|
RS_STREAMLEGEND |
Shown with streamlines in grid plots |
|
RS_BUBBLELEGEND |
Shown with bubbles in grid plots |
|
RS_INACTIVELEGEND |
Shown when an inactive grid mesh is shown in color in grid plots |
The position of the placeholder text determines the position of the legend. The text styles assigned to the placeholder text will be applied to the text in the displayed legend.
The Text Details dialog allows you to control the style of the text. For placeholder text for legends, the styles assigned to the text will be applied to the legend that appears in its place. Font, style, and color settings are used for legend labels, anchor and position settings control the legend placement, and text box options will control whether a box is drawn around the legend itself.
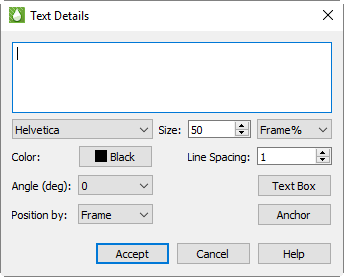
The Text Details dialog includes the following controls:
• Text Field For static text, enter the text you wish to create in the top text field. For dynamic and placeholder text, do not modify the text displayed here.
• Font Choose a font for the text from the Font menu.
• Size Use the Size control to adjust the sizing of your text or legend label. You can choose whether to control your font size in points or in frame percent (“Frame %”). If you choose to use points, the font will always appear as that size. If you choose frame percent, Tecplot RS will resize the font when the frame is resized, so that the font always appears as a ratio to the frame size.
• Color To modify the color of the text, click on the Color button and choose a color in the Color Chooser dialog.
• Line Spacing To adjust the spacing between lines of text, type or adjust the number displayed in the Line Spacing control. Applies only to multi-line static text.
• Angle (deg) You can adjust the orientation of the text with the Angle control. Tecplot RS measures the angle in degrees counter-clockwise from the horizontal axis: zero degrees indicates horizontal text; 90 degrees indicates vertical text. You can type an angle in degrees or choose a common angle in the Angle menu.
Note that this applies only to static or dynamic text. For placeholder text (legends and the orientation axis), leave this at 0. Instead, you can choose a horizontal or vertical contour legend alignment on a variable-by-variable basis in Plot Options.
• Position By Ignore this field. Both text and legends are always positioned relative to the frame.
• 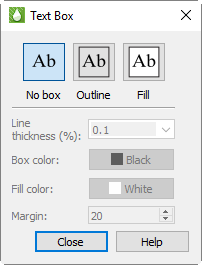 Text Box Click the Text Box button to open the Text Box dialog, where you can control the appearance of a box around the text or legend and choose a background (fill) color if desired. You can also choose a margin; although you can enter larger values, Tecplot RS limits margins to 5%
• Anchor To adjust the relationship of the entered text to the point clicked, click the Anchor button.
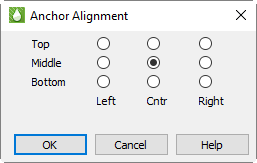
For legends, this should generally match the part of the frame where the anchor is positioned (for example, a corner); it will determine which direction the legend grows, and you will want the legend to grow toward the center of the frame.