To view a 3D plot of a grid file, choose “3D Grid” from the Plot Type menu. The display of your plot will change to a 3D view and the Plot Controls sidebar will appear.
|
|
 You can un-dock the Plot Controls sidebar by dragging its title bar to a new position. To put the Plot Controls back on the side of the workspace, double-click on its title bar (the region that displays the words “Plot Controls”). Or you can drag its title bar to either side of the workspace and let go, and it will snap into place.
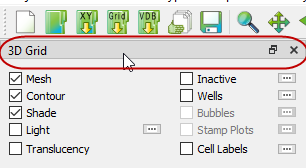
The sidebar for 3D Grid plots has the options described following: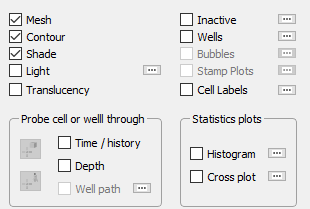
• Mesh Layer This toggle turns on or off a mesh of lines on your plot.
• Contour Layer The “Contour” toggle controls display of flooded contours.
• Connect When you have “Wells” toggled-on, this toggle turns on and off the lines connecting the well nodes.
• Shade Layer You can use the Shade toggle when you have “Contour” toggled-off. Use it to turn on/off the surface shading, making the interior of the grid mesh visible or hidden.
• Lighting Layer (3D Grid plots only) Use this toggle to turn on and off light source shading. When on, shadows make it easier to visualize the shape of the 3D model and mute the colors.
• Translucency Layer (3D Grid plots only) With “Translucency” toggled-on, the grid surface becomes translucent, making it possible to see the interior of the model.
• Inactive Cells Toggle-on “Inactive” to display the inactive cells along with the active cells in your grid. If you have not loaded the inactive cells, Tecplot RS will prompt you load the inactive cells. See Section “Loading Inactive Cells” for details. See Section 14 - 1.6 “Inactive Cells” to learn how to display solution data on the inactive grid cells.
• NNCs (2D Grid plots) Toggle-on “NNCs” to make Non-Neighbor Connections (NNCs) visible. Use the Details button to specify display options in the NNC dialog.
• Wells Toggle-on “Wells” to display any wells in the current plot. The shape of the symbol indicates the type of well (producer, injector, and so forth). The Details button adjacent to the Wells option displays the Wells dialog.
• Bubble Plots Toggle-on “Bubbles” to show well data represented as bubbles on the well heads.
• Cell Labels Toggle-on “Labels” to include cell or well labels in the plot.
|
|

• Time/History Toggling-on “Time/history” creates a new frame to display an XY line plot. You can plot value versus time for a single cell in the grid or for a chosen well. If you plot a variable versus time for a selected well, the current selections in the XY Variables plot type determine the variables shown in the Time/History plot. (To plot from a selected well, you must have the corresponding XY data loaded.) If you plot from a cell, Tecplot RS will use the variable currently selected in the 2D or 3D Grid plot to plot the variable versus time.
|
|
• Depth If you have RFT data included in your current XY data set, you can plot these similarly to the Time/history plots by toggling-on “Depth”. Choose which variables to display in the RFT Plots plot type. (Choose “RFT” from the Plot Type menu.)
• Well Path Creates an XY plot similar to the Time/history and Depth plots by toggling-on “Well Path”. Only available in 3D Plots. Select the cell contianing a well to follow the values along the well path. Can be shown in distance along well path or vertical depth.
• Statstics Displays or hides a statistical plot, either a histogram or cross plot (only one of these plots may be visible). Choose Histogram or Cross Plot sidebar to choose which plot will be displayed and to set its options; for more details, see Statistical Plots.
• Variables The Variables box lists each variable usable for a contour plot. Time-dependent (dynamic) variables display first, followed by time-independent (static) variables. When you choose a variable, each cell in the grid plot will fill with a color representing the value of that variable at the chosen time.
• OWG (Oil/Water/Gas) Saturation Plots Use the OWG option to create a ternary (red-green-blue) color map to color cells based on their combined saturations.
• Time Delta Choosing “Delta” causes the contour display to reflect the variable value at a selected time relative to the reference time step.
• KSum Choose “KSum” to display the sum of the variable values in a column (all cells with matching I and J indexes) for all displayed layers.
• KAvg Choose “KAvg” to display the average of the variable values in a column (all cells with matching I and J indexes) for all displayed layers.
• Grid Options With the Grid Options dialog that opens when you click this button, you can adjust many aspects of the display of your grid plot.
• Expanded List button Whenever you see the Plus button,  next to a list in the sidebar or a dialog, you can click this button to open an expanded version of the list contents. To find an item in the list more easily, you can type letters in the Filter field at the top of the list. Only items that include those letters in that order will appear in the expanded list. For example, to display only items with the word “well” in their name, type “well” into the Filter field.
• Paging: Animation and Scrolling Controls The Times region of the sidebar allows you to choose a time step or animate the progression of a time-dependent variable. Use the slider to control time step.
• Inside Views The Inside Views region of the sidebar provides options for displaying the grid solution.
|
|