The Grid Options dialog, accessible by clicking the Grid Options button in the Variables region of the sidebar, controls attributes of the grid display of your plot. You can use the various pages in the Grid Options dialog to customize your grid settings.
Each page of the dialog (except the Inactive Cells page) includes an Apply button. Click the Apply button to apply changes on that page of the dialog to your plot.
Unlike the standard topographical model where the Z-axis represents elevations (increasing upwards), reservoir simulators usually use a Depth value for the Z coordinate (that increases downward). If Tecplot RS displayed this type of grid using a typical 3D orientation, the plot would look upside-down.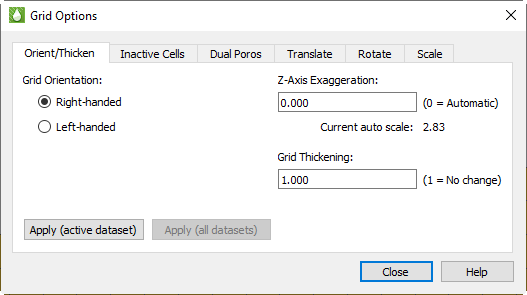
Tecplot RS provides two methods for reversing the depth component. By the first option, Tecplot RS maintains all coordinate values and rotates the 3D view so that the Z-axis points down. This maintains the right-handed nature of the coordinate system (often used by the simulator). To use this 3D view rotation, choose Right-handed as the grid orientation.
By the second method, useful for dealing with left-handed coordinate systems, Tecplot RS multiplies all Z values by -1. To use this control, choose the Left-handed grid orientation on the Orient/Thicken page of the dialog.
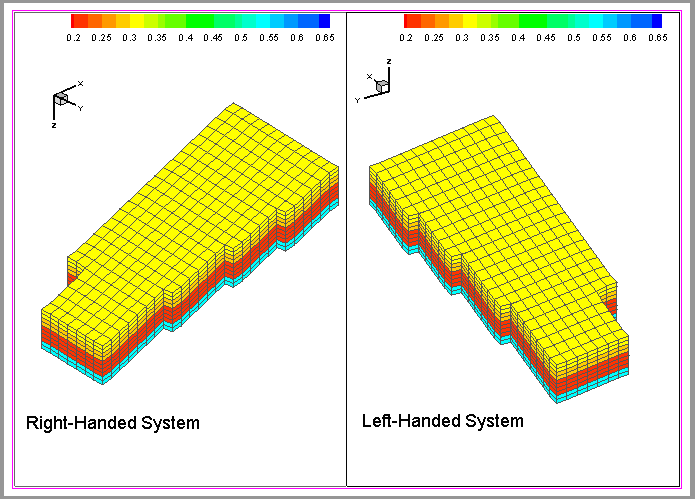
The two orientations result in different views of your plot; if viewed side-by-side, the same data set with the two different methods would appear as mirror images of each other
Different grid file types generally use either right or left-handed coordinate systems, and Tecplot RS chooses the most likely orientation when loading a grid file based on the file type and state file settings, in the following order.
1.Tecplot RS will use the orientation specified in the state file, if a state file exists for the file being loaded.
2.If Tecplot RS loads the file by a macro that includes orientation, it will use that setting.
3.Otherwise, Tecplot RS will choose coordinate systems based on file type:
• Sensor grids load with right-handed coordinates,
• VIP and VDB grids load with the coordinates specified in their files,
• .egrid files load with left-handed coordinates unless the optional GRIDUNIT flag indicates otherwise, and
• .grid files load with right-handed coordinates unless the optional GRIDUNIT flag indicates otherwise.
The Z-Axis Exaggeration value exaggerates (or flattens) the vertical scale (typically, Z). Allowable values range from 0 to 100. Use a value of 0 (recommended) to let Tecplot RS automatically compute a pleasing ratio. If you use the grid thickening factor, set the Z-Axis exaggeration to 0, at least initially.
The Grid Thickening factor enables you to stretch the Z (vertical) axis on 3D Grid plots by a selected factor, without exaggerating the topology. Especially useful for plots with thin vertical layers and irregular surfaces, this feature stretches the grid between the top and bottom surfaces, to make thin vertical layers more visible while preserving the original slopes.
While applying Z-axis scaling changes only the display, applying the Grid Thickening factor actually changes the Z values in the grid. When you apply thickening (by changing the factor to a number greater than 1), the labels on the displayed Z-axis will change, and probing results will reflect the altered Z values. Any grid equations that use the Z variable will also reflect the “stretched” Z values.
The thickening factor will default to 1 the first time a grid is loaded. Tecplot RS saves the latest factor in the project file, so that a reloaded project remembers and uses the saved factor. Multiple grids in one project may have different thickening factors.
The factor can range from 1 to 1000, where 1 indicates no thickening applied. A factor acts as a multiplier for the total grid thickness. For example, applying a thickening factor of 5 will stretch a grid with an original vertical depth of 200 to an adjusted vertical depth of 1000.
Adding a thickening factor will not thicken streamlines and survey wells (wells loaded from separate files, where those files define the well nodes with XYZ locations) with the grid. These will still display, but they may not appear at the correct depths. Wells included in the original simulation data will stretch properly with the grid.
These settings have no effect on other plot types, and you can use the thickening and exaggeration together. Click “Apply (active dataset)” to apply changes to the active dataset only, or “Apply (all datasets)” to apply changes to all currently loaded datasets.
Inactive Cells
On the Inactive Cells page of the Grid Options dialog, you can choose whether to load or unload inactive cells in the grid. You can click the Load Inactive Cells button to load the inactive cells if they are not loaded already. When Tecplot RS has inactive cells loaded, the button on this page of the dialog changes to Unload Active Cells. Click this button to immediately unload the inactive cells in your plot.
|
|
 If, when you click Load Inactive Cells, a message appears that the “Inactive grid file has not yet been solved”, you must first instruct Tecplot RS to create the
 Dual Porosity
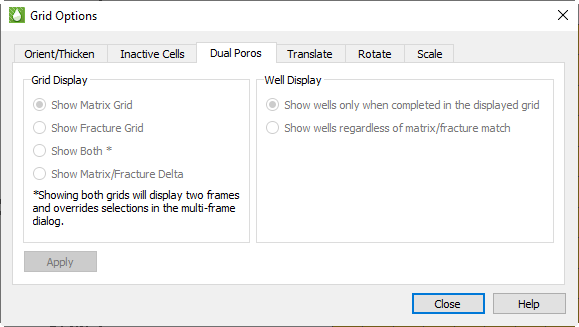
When working with dual porosity grids, you can use the Dual Poros page of the Grid Options dialog to adjust the display of matrix or fracture representations of your grid. To show both the matrix and the fracture grids simultaneously, choose “Show Both.”
When displaying both grids, Tecplot RS overrides the settings in the Multi-Frame Options dialog in favor of the dual view. The two grids appear side-by-side if the paper layout is in landscape mode, or stacked vertically if the paper is in portrait mode1.
Displaying both grids also links the view and blanking options between the two grids, regardless of the settings in the Multi-Frame Options dialog. However, layers and NNCs are still linked according to the selections in the Multi-Frame Options dialog. Cell Labels, Streams and Quick Plots appear only on the matrix grid. Finally, variable settings are linked between the frames.
For Matrix/Fracture Delta display, the left grid will show matrix cells with delta values, and the right grid will show the fracture grid. Delta is computed as follows:
1.If a cell exists in both the matrix and fracture grid, then the delta is matrix value - fracture value.
2.If a cell exists only in the matrix grid, the delta is the matrix value (matrix - 0).
3.If a cell exists only in the fracture grid, then the cell is not displayed since the delta view only shows the matrix cells.
Notes:
1.“Show Both” and “Matrix/Fracture” Delta are not available if grid “Compare” mode is enabled.
2.If the current Grid Display is “Both” or “Matrix/Fracture Delta” and the “Compare” toggle is clicked on the sidebar, the grid display will be changed to “Matrix”.
3.Matrix Fracture Delta values are not displayed when viewing time step deltas.
4.Matrix/Fracture Delta values are not supported for variables created with an equation.
5.Matrix/Fracture Delta values are not exported when extracting data by cell (Data>Extract Data>By Cell).
In all of the above cases, matrix values are displayed instead of the delta.
The Well Display option controls how wells are shown when displaying dual porosity grids. You may choose to display only the wells that complete in the displayed grid (first option) or to show all wells regardless of where they complete (second option). If Grid Display is set to Both, each well is shown only in the grid in which it completes (option 1), or in both grids (option 2), according to this setting.
Changing these settings requires Tecplot RS to re-output and re-draw the entire grid. Since this may take some time for large files, these settings are not applied until you explicity do so by clicking the Apply button.
Translate
You can use the Translate page of the Grid Options dialog to translate your grid to a new location relative to the coordinate system. Choose “Translate to 0,0” to shift the current minimum X and Y coordinates of the grid to the origin, or choose “Enter values” to shift the grid to a new position that you specify.
When “Enter values” is chosen as the translation, the dX, dY, and dZ text boxes become active. You can use these text boxes to indicate the direction in which you wish to shift the grid. These dX, dY, and dZ measurements reference the original grid position as dX = dY = dZ = 0. Tecplot RS reads any values in these text fields as a distance from the original position. (To undo all grid shifts, then, and return to the original grid position, type “0” into each of the three text boxes.)
With the Apply to survey wells control, you can choose whether to include survey wells in the translation. While usually survey wells require translation with the plot, turning this option off may be useful to align your plot and survey wells if the survey wells were input with a different coordinate system.
Click the Apply button to apply the translation to your plot.
Rotate
With the Rotate page of the Grid Options dialog, you can specify a rotation angle, align the edge of the grid with the axis, or use MAPAXES data if included in your data file(s).
• Enter Angle With this control chosen, you can type the desired rotation angle (in degrees) and click Apply to rotate your plot by the specified angle.
• Align w/ axis Choose this control to align your grid along a north/south orientation.
• Use MAPAXES If you want to rotate an Eclipse grid, and your grid file includes MAPAXES data, you can choose this control to determine rotation (and translation if included in the MAPAXES data).
Since, as with translation, the rotation angle measures the angle from the original grid position, you can type “0” into the Rotation angle text box (and click Apply) to return the grid to its original orientation.
Toggle-on “Apply to survey wells” to rotate survey wells along with your plot, and click the “Apply (active dataset)” to apply changes to the active dataset only, or “Apply (all datasets)” to apply changes to all currently loaded datasets.
Scale
With the Scale page of the Grid Options dialog, you can multiply each coordinate by a number to scale that coordinate larger or smaller. This feature can help if you wish to convert your grid from one unit of measurement to another, or to exaggerate one dimension relative to another. (However, the Orient/Thicken controls can exaggerate the vertical dimension more optimally than the scaling controls).
Toggle-on “Apply to survey wells” to scale survey wells along with your plot.
Click the “Apply (active dataset)” to apply changes to the active dataset only, or “Apply (all datasets)” to apply changes to all currently loaded datasets.