OWG (Oil/Water/Gas) Saturation Plots
Toggle-on “OWG” to display a ternary RGB (Red/Green/Blue) color scheme. The associated saturation variable determines the intensity of each color, where Blue = Water, Red = Gas, and Green = Oil. The legend also changes to a RGB color triangle.
You can change the time steps or animate the plot to see how the relative oil, gas, and water saturations change over time. For example, by observing the predominantly blue regions, you can easily monitor areas with high water saturations.
Tecplot RS automatically chooses variables for Oil, Water, and Gas when possible. If your data set only includes two of these variables, Tecplot RS will automatically calculate the missing variable for you.
If the automatic choices are not suitable, you can choose the variables that represent oil, water, and gas yourself by clicking the [...] button next to the OWG checkbox in the sidebar. The Choose OWG Variables dialog appears.
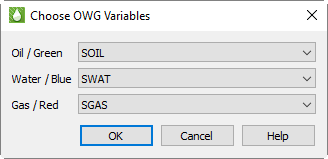
For each of oil, water, and gas, you can choose a variable using the corresponding menu. Then click OK to save your changes. The plot updates automatically after you click OK.
Instead of showing a variable value at a single time, you can create plots that represent the change in a variable value over time relative to a reference time step. Use the Delta toggle to do this.
When you toggle-on “Delta”, the colors of each cell represent the variable value at the current time value in that cell, relative to a reference time step. If the slider (in the Times region of the sidebar) is at the reference (by default, the initial) time step, the entire grid will display as a solid color, representing the variable value at the minimum time value. As the time slider progresses to sequential values, the plot’s coloration will display changes in the variable value over time.
Tecplot RS will disable the Delta option when the current data set no time-dependent variables. You can use the Delta option with the sample grid data included in your installation (such as chelan.grid). Make sure you have a time-dependent variable selected (with chelan.grid loaded, chose the “PRESSURE” variable), and note the changes on your display as you click the Play (>>) button or other time increment buttons in the Times region of the sidebar.
Refer to Section 13 - 3.1 “Time Options” for instructions on customizing the time dependency calculation settings.