Bubble plots provide a way to display data for individual wells on a 2D or 3D grid plot. The well head symbol is replaced by a bubble that represents values for well data at the time defined by the time slider. The values may be historical, simulated, or even delta values computed between the two. 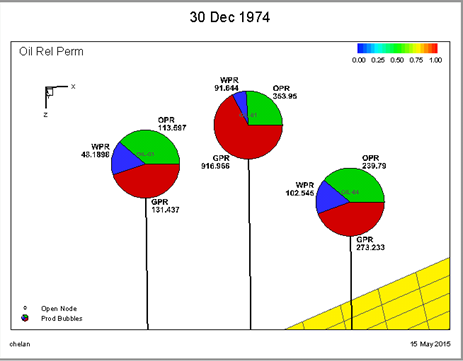
Bubbles are in the form of a pie chart with up to four different slices, one for each variable with each in a different color. Injectors and producers may be defined separately, so up to eight total values may be shown on the plot. Bubbles may also be sized according to a variable or even a sum of multiple variables. In this way, the pie slices display the relative quantities of two or more values, while the bubble size reflects the magnitude of a value.
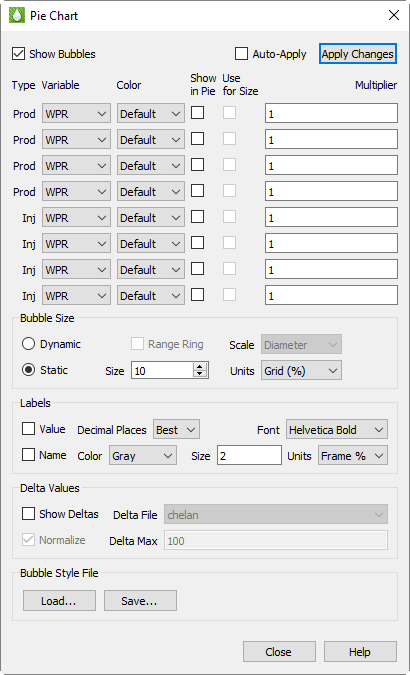
To create bubble plots, you must have both XY and grid data sets loaded (refer to 4 - 1 “Loading XY Data” and Chapter 12: “Loading Grid Data” for details). Once you have loaded both sets of files, switch to a grid plot type and toggle-on both “Wells” and “Bubbles”. Then use the […] button next to the Bubbles to bring up this dialog:
Prod and Inj
Note that the array of controls on the upper half of the dialog are divided into two groups for “Prod” (production) and “Inj” (injection) bubbles. Tecplot RS will create two separate sets of bubbles, and if both are to be shown you will need to limit your selections to variables that fall in the appropriate category. While there is nothing preventing you from selecting injection values in the production group, or vice-versa, if you mix the two you may get two bubbles plotted on top of each other, with the result being a “scrambled” image.
Variable and Color
For each bubble value to be shown, choose the variable and color. You may choose the color explicitly or select the “Default” option. This is the same as using the Default symbol color for XY line plots. The Default color is defined in the rsvariables.txt file, and can be seen/changed using Plot Options: Variables.
Multiplier
Each pie slice value will generally be measured in different units than the next. The Multiplier option can be used to balance or create equivalent units so that the relative size of one pie slice does not completely obscure the other.
Note that the multiplier is used for both the pie relative size and in the label for the pie slice value.
Show in Pie and Use for Size
Check the Show in Pie toggle to indicate that you want this variable to be included in the pie chart. You may select up to four variables within a Prod/Inj group to be shown.
The Use for Size toggle indicates that you want to use a variable to control the bubble size. Generally only one size variable will be chosen, but if you choose more than one then the sum of the values will be used to determine the size.
Bubble Size
The Use for Size toggle is active only when the bubble sizing is Dynamic, as controlled in these selections:
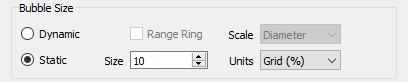
Choose Dynamic sizing when you want the bubble size to vary according to the values defined by the Use for Size checkbox. When only a single variable is selected in Show in Pie, you will almost always want to choose Dynamic sizing so that you can see changes other than what is reflected in the label. Static sizing will make all bubbles the same size.
When dynamic sizing is in effect, the Range Ring option will plot a hollow circle to represent the maximum bubble size, providing a visual scale for the current size vs. the max value for all wells over all times.
The Scale options include Diameter or Area, and this selection controls how the bubble is sized relative to the maximum size. For example, if the max value of the bubble size values is 1000 and the current value is 500, the bubble could be either half the diameter of the maximum size or half the area of the maximum, depending on this selection.
The Size and Units options control the actual dimensions of the maximum bubble size when Dynamic sizing is in effect, or the Static size if that option is chosen. Size may range from 1 to 20, and this value represents a percentage of either the frame size or the average dimension of the grid. If you choose Grid units, the bubbles will get bigger/smaller when you zoom in or out on the view. Frame units will keep the bubble sizes constant relative to the frame. The latter is usually the better option when there are many wells, since you can zoom in and eliminate overlap.
Labels
Each pie wedge can be labeled with the value and/or name of the variable being shown. The labeling options are shown here:
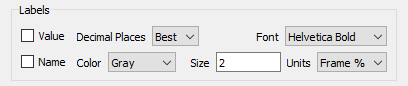
As with the bubbles themselves, you can choose sizing units for the labels that will either zoom with the grid or remain fixed relative to the paper/frame.
Bubbles can also display delta values - the change in a value between one dataset and another. This may be historical data vs. simulated, or the difference between two different simulations.
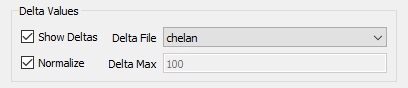
When the Show Deltas toggle is checked, you will be limited to showing a single variable value, and bubble sizing is automatically switched to dynamic so that the bubble size will reflect the magnitude of the value. The Delta File controls will display the list of loaded XY files from which you can choose the one used to calculate the differences.
Bubbles will be shown in the selected color when the delta value is positive, and in white when the change is negative.
You must also choose a value for the Delta Max, which is the value that scales to the maximum bubble size. Larger deltas will be clamped at that size. A sample use case for this is when any value greater than this max is equal cause for concern, but you want more granularity to see the lesser values.
If you toggle on Normalize, the size of the delta bubbles will represent the magnitude of the difference between the Active Data Set and the comparison data set divided by the value of the Active Data Set.
Bubble Style Files
Bubble styles are saved as part of the project file and will be remembered when the project is reopened. You can also save just the bubble styles in a separate file. This makes it easy to share the styles between projects or to create your own custom style to be used as a default starting point for new projects. Use the Save and Load buttons to accomplish this.