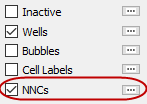
 If your grid model includes Non-Neighbor Connections (NNCs), you can view them as a layer on your 2D Grid plots. (For 3D Grid plots, choose “NNCs” from the drop-down menu in the Inside Views section of the sidebar. See “NNCs” on page 189 for further details.)
.
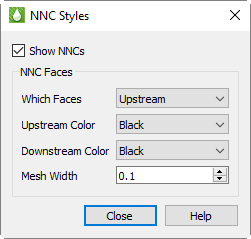
In 2D Grid Plots, a heavy line indicates NNCs, marking the upstream and/or downstream faces normal to the view plane. Click the [...] button next to “NNCs” in the sidebar to set the styles for NNC display. You can choose to display the upstream faces, downstream faces, or both. When both types are displayed, the overlap can cause interference, but selecting different colors can help differentiate the two.
To make NNC faces visible in 3D, Tecplot RS activates see-through grids when NNCs are activated. Use the Grids page of the Plot Options dialog to customize the See-Through styles.
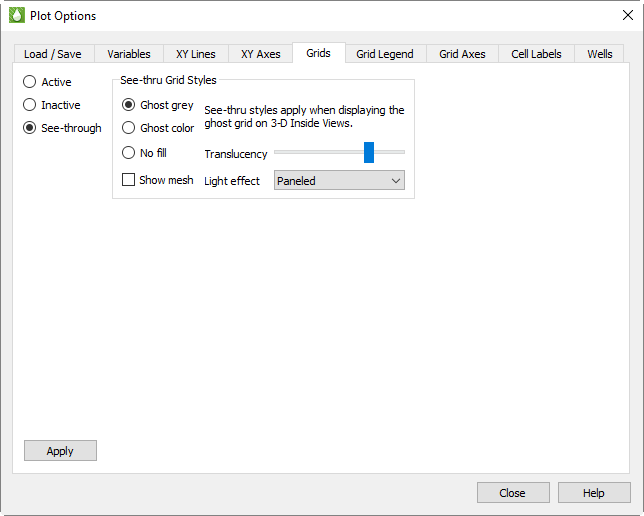
When the See-Through Style is set to “Ghost Gray”, you can use the Light Effect to alter the appearance of the surface. Choose the “Paneled” Light Effect to get a better idea of cell boundaries (especially when the mesh is turned off), or “Smooth” to create a more rounded look. The “Smooth” option may load slowly on very large models.
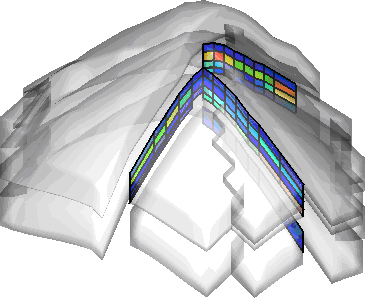
Only NNCs within a grid display. NNCs between the global grid and LGRs, or those between two LGRs, are not highlighted, although the boundaries are still visible when translucency is on.
When NNCs are displayed, Tecplot RS displays a legend for the NNC variable. You can move or remove this legend by choosing the Paper Layout plot type and moving or deleting the RS_NNCVAR (the legend title) and/or RS_NNCLEGEND (the legend itself) dynamic text items from the layout.
To adjust the legend, switch to the 3D Grid plot type and double-click the legend. The Grid Legend page of the Plot Options dialog appears; click the variable by which the NNCs are colored in the Variables list to modify the NNC legend settings.